

Key Insights
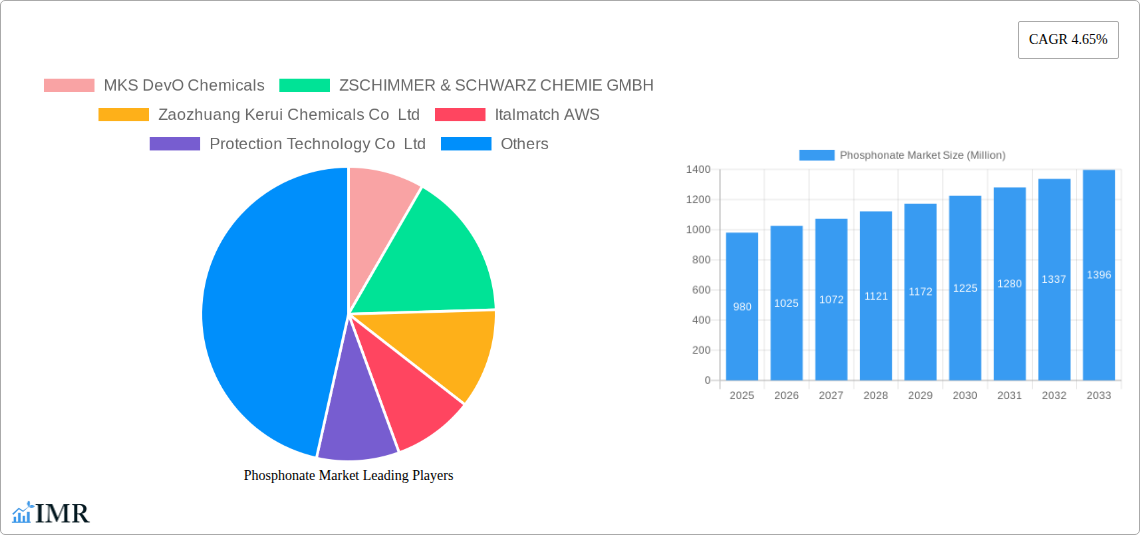
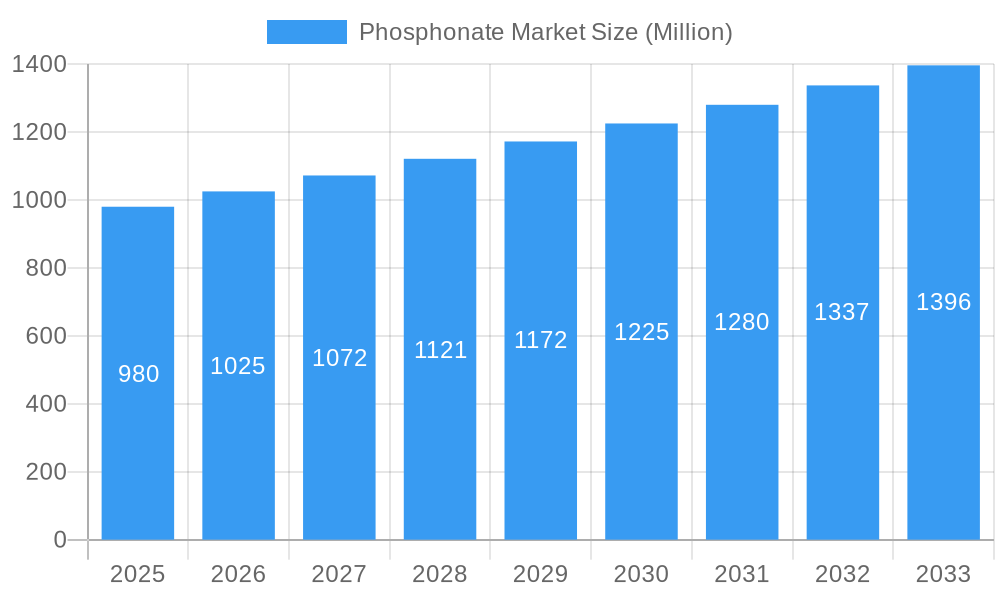
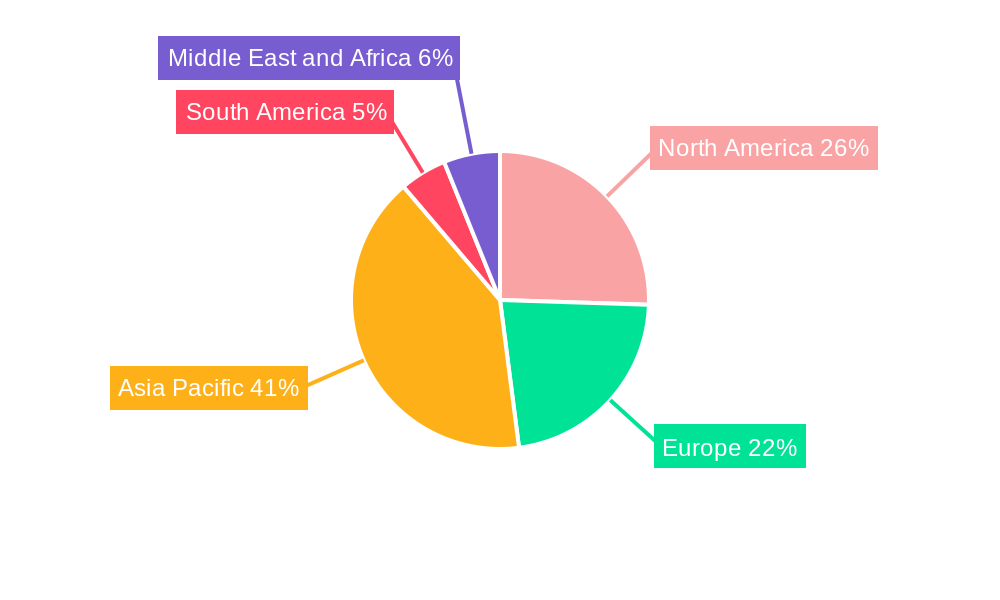
The global phosphonate market, valued at $0.98 billion in 2025, is projected to experience robust growth, driven by a compound annual growth rate (CAGR) of 4.65% from 2025 to 2033. This expansion is fueled by increasing demand across diverse sectors, particularly in water treatment, detergent and cleaning agents, and oilfield chemicals. The rising global population and the consequent surge in industrial activity and urbanization are key factors contributing to this growth. Furthermore, stringent environmental regulations concerning water pollution and the need for effective water treatment solutions are bolstering the adoption of phosphonates. Within the market segments, ATMP (Aminotrimethylenephosphonic acid) and HEDP (Hydroxyethylidene diphosphonic acid) currently dominate, owing to their versatile applications and established presence in various industries. However, the market is witnessing a growing interest in DTPMP (Diethylenetriamine penta(methylene phosphonic acid)) and other specialized phosphonates, driven by their superior performance characteristics in specific niche applications such as scale inhibition in high-temperature and high-pressure oilfield operations. The Asia-Pacific region, particularly China and India, is expected to lead market growth, driven by rapid industrialization and escalating infrastructure development. Competitive pressures among established players like LANXESS, Italmatch AWS, and ZSCHIMMER & SCHWARZ CHEMIE GMBH alongside a growing number of regional players are shaping market dynamics.
Phosphonate Market Market Size (In Million)
The forecast period (2025-2033) anticipates continued expansion, though the pace of growth might fluctuate based on macroeconomic conditions and technological advancements. Innovation in phosphonate chemistry, focusing on developing more sustainable and environmentally friendly alternatives, will be crucial for long-term market success. Potential restraints include fluctuations in raw material prices and the emergence of alternative water treatment technologies. Nonetheless, the overall outlook for the phosphonate market remains positive, with continued expansion expected across various segments and geographical regions. The market's trajectory is highly dependent on global economic growth, environmental policies, and advancements in chemical technology. Successful players will be those that can adapt to evolving regulatory landscapes, offer innovative and sustainable solutions, and efficiently manage supply chain challenges.
Phosphonate Market Company Market Share
Phosphonate Market: A Comprehensive Report (2019-2033)
This in-depth report provides a comprehensive analysis of the Phosphonate Market, encompassing market dynamics, growth trends, regional segmentation, product landscape, key players, and future outlook. The study covers the period from 2019 to 2033, with 2025 serving as the base year and estimated year. This report is invaluable for industry professionals, investors, and strategic decision-makers seeking a thorough understanding of this dynamic market. The parent market is the specialty chemicals market, while the child market is water treatment chemicals.
Keywords: Phosphonate Market, ATMP, HEDP, DTPMP, Detergent, Water Treatment, Oilfield Chemicals, Cosmetics, Building Materials, Market Size, Market Share, CAGR, Market Growth, Market Analysis, Industry Trends, Competitive Landscape, Key Players, Future Outlook, M&A Activity
Phosphonate Market Dynamics & Structure
The Phosphonate Market is characterized by moderate concentration, with several key players holding significant market share. Technological innovation, driven by the need for more efficient and sustainable solutions, plays a crucial role. Stringent environmental regulations are shaping product development and adoption. Competitive substitutes, such as other water treatment chemicals, exert pressure on pricing and market share. End-user demographics, particularly in developing economies with growing industrialization, are significantly impacting demand. Mergers and acquisitions (M&A) activity, as seen in Biesterfeld AG's acquisition of GME Chemicals, are reshaping the competitive landscape.
- Market Concentration: Moderately concentrated, with top 5 players holding xx% market share in 2025.
- Technological Innovation: Focus on eco-friendly formulations and improved performance characteristics.
- Regulatory Framework: Stringent environmental regulations drive demand for sustainable phosphonates.
- Competitive Substitutes: Other water treatment chemicals and scale inhibitors pose competitive threats.
- End-user Demographics: Growing industrialization in developing economies fuels market growth.
- M&A Activity: xx M&A deals recorded between 2019 and 2024, indicating industry consolidation.
Phosphonate Market Growth Trends & Insights
The Phosphonate Market experienced robust growth during the historical period (2019-2024), with a CAGR of xx%. This growth is attributed to increasing demand from key end-user industries, particularly water treatment and detergent & cleaning agents. Technological advancements leading to improved efficacy and sustainability are further driving market expansion. Changing consumer preferences toward eco-friendly products are also influencing market dynamics. The forecast period (2025-2033) anticipates continued growth, driven by factors such as expanding industrialization and rising environmental concerns. The market size is projected to reach xx million units by 2033. Market penetration in key segments is expected to increase steadily, with significant adoption rates observed in the water treatment sector.
Dominant Regions, Countries, or Segments in Phosphonate Market
The Asia-Pacific region is projected to dominate the Phosphonate Market throughout the forecast period. The strong growth in this region is fueled by rapid industrialization, particularly in countries like China and India, coupled with increasing investment in water treatment infrastructure. Within the types segment, ATMP holds the largest market share due to its widespread applications in water treatment. The detergent and cleaning agent segment demonstrates significant growth potential, driven by increasing demand for effective and environmentally friendly cleaning solutions.
- Key Drivers in Asia-Pacific:
- Rapid industrialization and urbanization.
- Growing investments in water treatment infrastructure.
- Stringent environmental regulations.
- Dominant Segment (Type): ATMP, driven by wide applicability in water treatment and scale inhibition.
- Dominant Segment (End-user): Water Treatment, fueled by increasing water scarcity and stringent regulations.
Phosphonate Market Product Landscape
The phosphonate market showcases a diverse range of products with varying applications and performance metrics. Innovation centers around developing eco-friendly formulations with enhanced efficiency and reduced environmental impact. Technological advancements focus on improving scale inhibition capabilities, corrosion resistance, and biodegradability. Unique selling propositions include improved stability, reduced dosage requirements, and enhanced compatibility with other water treatment chemicals.
Key Drivers, Barriers & Challenges in Phosphonate Market
Key Drivers:
- Increasing demand from the water treatment industry due to growing water scarcity and stricter regulations.
- Rising demand from the detergent and cleaning agent industry due to the increasing popularity of eco-friendly cleaning products.
- Technological advancements leading to improved product efficacy and environmental sustainability.
Challenges:
- Fluctuations in raw material prices can impact profitability.
- Stringent environmental regulations may impose limitations on product development and application.
- Intense competition among established players and new entrants. The combined impact of these challenges is estimated to restrain market growth by approximately xx% during the forecast period.
Emerging Opportunities in Phosphonate Market
Emerging opportunities lie in developing specialized phosphonates for niche applications, such as in oilfield chemicals and cosmetics. Untapped markets in developing economies present significant growth potential. The increasing demand for sustainable and eco-friendly solutions creates opportunities for innovative product development and market expansion. Furthermore, strategic partnerships and collaborations can unlock access to new technologies and markets.
Growth Accelerators in the Phosphonate Market Industry
Long-term growth is driven by technological breakthroughs in formulating more efficient and environmentally friendly phosphonates. Strategic partnerships and collaborations between manufacturers and end-users can accelerate market expansion. Expanding into new geographic markets and targeting niche applications will create further growth opportunities.
Key Players Shaping the Phosphonate Market Market
- MKS DevO Chemicals
- ZSCHIMMER & SCHWARZ CHEMIE GMBH
- Zaozhuang Kerui Chemicals Co Ltd
- Italmatch AWS
- Protection Technology Co Ltd
- Biesterfeld AG
- Shandong Xintai Water Treatment Technology Co Ltd
- Excel Industries
- LANXESS
- Henan Qingshuiyuan Technolog
- Jiangsu Yuanquan Hongguang Environmental
- Uniphos Chemicals
- Aquapharm Chemical Pvt Ltd
- Shandong Taihe Watre Treatment Technologies Co Ltd
- IRO Group
- Bozzetto Group
- Changzhou Kewei Fine Chemicals Co Ltd
Notable Milestones in Phosphonate Market Sector
- Oct 2021: Biesterfeld AG announced the acquisition of GME Chemicals to expand its presence in Asia.
In-Depth Phosphonate Market Market Outlook
The Phosphonate Market exhibits robust growth potential throughout the forecast period (2025-2033). Continued technological innovation, strategic partnerships, and expansion into new markets will be key drivers. The increasing focus on sustainability and environmental protection will shape product development and market demand. The market holds significant opportunities for companies that can effectively leverage technological advancements and cater to the evolving needs of end-user industries.
Phosphonate Market Segmentation
-
1. Types
- 1.1. ATMP
- 1.2. HEDP
- 1.3. DTPMP
- 1.4. Other Types
-
2. End-user Industry
- 2.1. Detergent and Cleaning Agent
- 2.2. Water Treatment
- 2.3. Oil field chemicals
- 2.4. Cosmetics
- 2.5. Building Materials
- 2.6. Other End-user Industries
Phosphonate Market Segmentation By Geography
-
1. Asia Pacific
- 1.1. China
- 1.2. India
- 1.3. Japan
- 1.4. South Korea
- 1.5. Malaysia
- 1.6. Thailand
- 1.7. Indonesia
- 1.8. Vietnam
- 1.9. Rest of Asia Pacific
-
2. North America
- 2.1. United States
- 2.2. Canada
- 2.3. Mexico
-
3. Europe
- 3.1. Germany
- 3.2. United Kingdom
- 3.3. France
- 3.4. Italy
- 3.5. Spain
- 3.6. NORDIC Countries
- 3.7. Turkey
- 3.8. Russia
- 3.9. Rest of Europe
-
4. South America
- 4.1. Brazil
- 4.2. Argentina
- 4.3. Colombia
- 4.4. Rest of South America
-
5. Middle East and Africa
- 5.1. Saudi Arabia
- 5.2. Qatar
- 5.3. United Arab Emirates
- 5.4. Nigeria
- 5.5. Egypt
- 5.6. South Africa
- 5.7. Rest of Middle East and Africa
Phosphonate Market Regional Market Share
Geographic Coverage of Phosphonate Market
Phosphonate Market REPORT HIGHLIGHTS
| Aspects | Details |
|---|---|
| Study Period | 2020-2034 |
| Base Year | 2025 |
| Estimated Year | 2026 |
| Forecast Period | 2026-2034 |
| Historical Period | 2020-2025 |
| Growth Rate | CAGR of 4.65% from 2020-2034 |
| Segmentation |
|
Table of Contents
- 1. Introduction
- 1.1. Research Scope
- 1.2. Market Segmentation
- 1.3. Research Objective
- 1.4. Definitions and Assumptions
- 2. Executive Summary
- 2.1. Market Snapshot
- 3. Market Dynamics
- 3.1. Market Drivers
- 3.2. Market Restrains
- 3.3. Market Trends
- 3.4. Market Opportunities
- 4. Market Factor Analysis
- 4.1. Porters Five Forces
- 4.1.1. Bargaining Power of Suppliers
- 4.1.2. Bargaining Power of Buyers
- 4.1.3. Threat of New Entrants
- 4.1.4. Threat of Substitutes
- 4.1.5. Competitive Rivalry
- 4.2. PESTEL analysis
- 4.3. BCG Analysis
- 4.3.1. Stars (High Growth, High Market Share)
- 4.3.2. Cash Cows (Low Growth, High Market Share)
- 4.3.3. Question Mark (High Growth, Low Market Share)
- 4.3.4. Dogs (Low Growth, Low Market Share)
- 4.4. Ansoff Matrix Analysis
- 4.5. Supply Chain Analysis
- 4.6. Regulatory Landscape
- 4.7. Current Market Potential and Opportunity Assessment (TAM–SAM–SOM Framework)
- 4.8. IMR Analyst Note
- 4.1. Porters Five Forces
- 5. Market Analysis, Insights and Forecast 2021-2033
- 5.1. Market Analysis, Insights and Forecast - by Types
- 5.1.1. ATMP
- 5.1.2. HEDP
- 5.1.3. DTPMP
- 5.1.4. Other Types
- 5.2. Market Analysis, Insights and Forecast - by End-user Industry
- 5.2.1. Detergent and Cleaning Agent
- 5.2.2. Water Treatment
- 5.2.3. Oil field chemicals
- 5.2.4. Cosmetics
- 5.2.5. Building Materials
- 5.2.6. Other End-user Industries
- 5.3. Market Analysis, Insights and Forecast - by Region
- 5.3.1. Asia Pacific
- 5.3.2. North America
- 5.3.3. Europe
- 5.3.4. South America
- 5.3.5. Middle East and Africa
- 5.1. Market Analysis, Insights and Forecast - by Types
- 6. Global Phosphonate Market Analysis, Insights and Forecast, 2021-2033
- 6.1. Market Analysis, Insights and Forecast - by Types
- 6.1.1. ATMP
- 6.1.2. HEDP
- 6.1.3. DTPMP
- 6.1.4. Other Types
- 6.2. Market Analysis, Insights and Forecast - by End-user Industry
- 6.2.1. Detergent and Cleaning Agent
- 6.2.2. Water Treatment
- 6.2.3. Oil field chemicals
- 6.2.4. Cosmetics
- 6.2.5. Building Materials
- 6.2.6. Other End-user Industries
- 6.1. Market Analysis, Insights and Forecast - by Types
- 7. Asia Pacific Phosphonate Market Analysis, Insights and Forecast, 2020-2032
- 7.1. Market Analysis, Insights and Forecast - by Types
- 7.1.1. ATMP
- 7.1.2. HEDP
- 7.1.3. DTPMP
- 7.1.4. Other Types
- 7.2. Market Analysis, Insights and Forecast - by End-user Industry
- 7.2.1. Detergent and Cleaning Agent
- 7.2.2. Water Treatment
- 7.2.3. Oil field chemicals
- 7.2.4. Cosmetics
- 7.2.5. Building Materials
- 7.2.6. Other End-user Industries
- 7.1. Market Analysis, Insights and Forecast - by Types
- 8. North America Phosphonate Market Analysis, Insights and Forecast, 2020-2032
- 8.1. Market Analysis, Insights and Forecast - by Types
- 8.1.1. ATMP
- 8.1.2. HEDP
- 8.1.3. DTPMP
- 8.1.4. Other Types
- 8.2. Market Analysis, Insights and Forecast - by End-user Industry
- 8.2.1. Detergent and Cleaning Agent
- 8.2.2. Water Treatment
- 8.2.3. Oil field chemicals
- 8.2.4. Cosmetics
- 8.2.5. Building Materials
- 8.2.6. Other End-user Industries
- 8.1. Market Analysis, Insights and Forecast - by Types
- 9. Europe Phosphonate Market Analysis, Insights and Forecast, 2020-2032
- 9.1. Market Analysis, Insights and Forecast - by Types
- 9.1.1. ATMP
- 9.1.2. HEDP
- 9.1.3. DTPMP
- 9.1.4. Other Types
- 9.2. Market Analysis, Insights and Forecast - by End-user Industry
- 9.2.1. Detergent and Cleaning Agent
- 9.2.2. Water Treatment
- 9.2.3. Oil field chemicals
- 9.2.4. Cosmetics
- 9.2.5. Building Materials
- 9.2.6. Other End-user Industries
- 9.1. Market Analysis, Insights and Forecast - by Types
- 10. South America Phosphonate Market Analysis, Insights and Forecast, 2020-2032
- 10.1. Market Analysis, Insights and Forecast - by Types
- 10.1.1. ATMP
- 10.1.2. HEDP
- 10.1.3. DTPMP
- 10.1.4. Other Types
- 10.2. Market Analysis, Insights and Forecast - by End-user Industry
- 10.2.1. Detergent and Cleaning Agent
- 10.2.2. Water Treatment
- 10.2.3. Oil field chemicals
- 10.2.4. Cosmetics
- 10.2.5. Building Materials
- 10.2.6. Other End-user Industries
- 10.1. Market Analysis, Insights and Forecast - by Types
- 11. Middle East and Africa Phosphonate Market Analysis, Insights and Forecast, 2020-2032
- 11.1. Market Analysis, Insights and Forecast - by Types
- 11.1.1. ATMP
- 11.1.2. HEDP
- 11.1.3. DTPMP
- 11.1.4. Other Types
- 11.2. Market Analysis, Insights and Forecast - by End-user Industry
- 11.2.1. Detergent and Cleaning Agent
- 11.2.2. Water Treatment
- 11.2.3. Oil field chemicals
- 11.2.4. Cosmetics
- 11.2.5. Building Materials
- 11.2.6. Other End-user Industries
- 11.1. Market Analysis, Insights and Forecast - by Types
- 12. Competitive Analysis
- 12.1. Company Profiles
- 12.1.1 MKS DevO Chemicals
- 12.1.1.1. Company Overview
- 12.1.1.2. Products
- 12.1.1.3. Company Financials
- 12.1.1.4. SWOT Analysis
- 12.1.2 ZSCHIMMER & SCHWARZ CHEMIE GMBH
- 12.1.2.1. Company Overview
- 12.1.2.2. Products
- 12.1.2.3. Company Financials
- 12.1.2.4. SWOT Analysis
- 12.1.3 Zaozhuang Kerui Chemicals Co Ltd
- 12.1.3.1. Company Overview
- 12.1.3.2. Products
- 12.1.3.3. Company Financials
- 12.1.3.4. SWOT Analysis
- 12.1.4 Italmatch AWS
- 12.1.4.1. Company Overview
- 12.1.4.2. Products
- 12.1.4.3. Company Financials
- 12.1.4.4. SWOT Analysis
- 12.1.5 Protection Technology Co Ltd
- 12.1.5.1. Company Overview
- 12.1.5.2. Products
- 12.1.5.3. Company Financials
- 12.1.5.4. SWOT Analysis
- 12.1.6 Biesterfeld AG
- 12.1.6.1. Company Overview
- 12.1.6.2. Products
- 12.1.6.3. Company Financials
- 12.1.6.4. SWOT Analysis
- 12.1.7 Shandong Xintai Water Treatment Technology Co Ltd
- 12.1.7.1. Company Overview
- 12.1.7.2. Products
- 12.1.7.3. Company Financials
- 12.1.7.4. SWOT Analysis
- 12.1.8 Excel Industries
- 12.1.8.1. Company Overview
- 12.1.8.2. Products
- 12.1.8.3. Company Financials
- 12.1.8.4. SWOT Analysis
- 12.1.9 LANXESS
- 12.1.9.1. Company Overview
- 12.1.9.2. Products
- 12.1.9.3. Company Financials
- 12.1.9.4. SWOT Analysis
- 12.1.10 Henan Qingshuiyuan Technolog
- 12.1.10.1. Company Overview
- 12.1.10.2. Products
- 12.1.10.3. Company Financials
- 12.1.10.4. SWOT Analysis
- 12.1.11 Jiangsu Yuanquan Hongguang Environmental
- 12.1.11.1. Company Overview
- 12.1.11.2. Products
- 12.1.11.3. Company Financials
- 12.1.11.4. SWOT Analysis
- 12.1.12 Uniphos Chemicals
- 12.1.12.1. Company Overview
- 12.1.12.2. Products
- 12.1.12.3. Company Financials
- 12.1.12.4. SWOT Analysis
- 12.1.13 Aquapharm Chemical Pvt Ltd
- 12.1.13.1. Company Overview
- 12.1.13.2. Products
- 12.1.13.3. Company Financials
- 12.1.13.4. SWOT Analysis
- 12.1.14 Shandong Taihe Watre Treatment Technologies Co Ltd
- 12.1.14.1. Company Overview
- 12.1.14.2. Products
- 12.1.14.3. Company Financials
- 12.1.14.4. SWOT Analysis
- 12.1.15 IRO Group
- 12.1.15.1. Company Overview
- 12.1.15.2. Products
- 12.1.15.3. Company Financials
- 12.1.15.4. SWOT Analysis
- 12.1.16 Bozzetto Group
- 12.1.16.1. Company Overview
- 12.1.16.2. Products
- 12.1.16.3. Company Financials
- 12.1.16.4. SWOT Analysis
- 12.1.17 Changzhou Kewei Fine Chemicals Co Ltd
- 12.1.17.1. Company Overview
- 12.1.17.2. Products
- 12.1.17.3. Company Financials
- 12.1.17.4. SWOT Analysis
- 12.1.1 MKS DevO Chemicals
- 12.2. Market Entropy
- 12.2.1 Company's Key Areas Served
- 12.2.2 Recent Developments
- 12.3. Company Market Share Analysis 2025
- 12.3.1 Top 5 Companies Market Share Analysis
- 12.3.2 Top 3 Companies Market Share Analysis
- 12.4. List of Potential Customers
- 13. Research Methodology
List of Figures
- Figure 1: Global Phosphonate Market Revenue Breakdown (Million, %) by Region 2025 & 2033
- Figure 2: Global Phosphonate Market Volume Breakdown (K Tons, %) by Region 2025 & 2033
- Figure 3: Asia Pacific Phosphonate Market Revenue (Million), by Types 2025 & 2033
- Figure 4: Asia Pacific Phosphonate Market Volume (K Tons), by Types 2025 & 2033
- Figure 5: Asia Pacific Phosphonate Market Revenue Share (%), by Types 2025 & 2033
- Figure 6: Asia Pacific Phosphonate Market Volume Share (%), by Types 2025 & 2033
- Figure 7: Asia Pacific Phosphonate Market Revenue (Million), by End-user Industry 2025 & 2033
- Figure 8: Asia Pacific Phosphonate Market Volume (K Tons), by End-user Industry 2025 & 2033
- Figure 9: Asia Pacific Phosphonate Market Revenue Share (%), by End-user Industry 2025 & 2033
- Figure 10: Asia Pacific Phosphonate Market Volume Share (%), by End-user Industry 2025 & 2033
- Figure 11: Asia Pacific Phosphonate Market Revenue (Million), by Country 2025 & 2033
- Figure 12: Asia Pacific Phosphonate Market Volume (K Tons), by Country 2025 & 2033
- Figure 13: Asia Pacific Phosphonate Market Revenue Share (%), by Country 2025 & 2033
- Figure 14: Asia Pacific Phosphonate Market Volume Share (%), by Country 2025 & 2033
- Figure 15: North America Phosphonate Market Revenue (Million), by Types 2025 & 2033
- Figure 16: North America Phosphonate Market Volume (K Tons), by Types 2025 & 2033
- Figure 17: North America Phosphonate Market Revenue Share (%), by Types 2025 & 2033
- Figure 18: North America Phosphonate Market Volume Share (%), by Types 2025 & 2033
- Figure 19: North America Phosphonate Market Revenue (Million), by End-user Industry 2025 & 2033
- Figure 20: North America Phosphonate Market Volume (K Tons), by End-user Industry 2025 & 2033
- Figure 21: North America Phosphonate Market Revenue Share (%), by End-user Industry 2025 & 2033
- Figure 22: North America Phosphonate Market Volume Share (%), by End-user Industry 2025 & 2033
- Figure 23: North America Phosphonate Market Revenue (Million), by Country 2025 & 2033
- Figure 24: North America Phosphonate Market Volume (K Tons), by Country 2025 & 2033
- Figure 25: North America Phosphonate Market Revenue Share (%), by Country 2025 & 2033
- Figure 26: North America Phosphonate Market Volume Share (%), by Country 2025 & 2033
- Figure 27: Europe Phosphonate Market Revenue (Million), by Types 2025 & 2033
- Figure 28: Europe Phosphonate Market Volume (K Tons), by Types 2025 & 2033
- Figure 29: Europe Phosphonate Market Revenue Share (%), by Types 2025 & 2033
- Figure 30: Europe Phosphonate Market Volume Share (%), by Types 2025 & 2033
- Figure 31: Europe Phosphonate Market Revenue (Million), by End-user Industry 2025 & 2033
- Figure 32: Europe Phosphonate Market Volume (K Tons), by End-user Industry 2025 & 2033
- Figure 33: Europe Phosphonate Market Revenue Share (%), by End-user Industry 2025 & 2033
- Figure 34: Europe Phosphonate Market Volume Share (%), by End-user Industry 2025 & 2033
- Figure 35: Europe Phosphonate Market Revenue (Million), by Country 2025 & 2033
- Figure 36: Europe Phosphonate Market Volume (K Tons), by Country 2025 & 2033
- Figure 37: Europe Phosphonate Market Revenue Share (%), by Country 2025 & 2033
- Figure 38: Europe Phosphonate Market Volume Share (%), by Country 2025 & 2033
- Figure 39: South America Phosphonate Market Revenue (Million), by Types 2025 & 2033
- Figure 40: South America Phosphonate Market Volume (K Tons), by Types 2025 & 2033
- Figure 41: South America Phosphonate Market Revenue Share (%), by Types 2025 & 2033
- Figure 42: South America Phosphonate Market Volume Share (%), by Types 2025 & 2033
- Figure 43: South America Phosphonate Market Revenue (Million), by End-user Industry 2025 & 2033
- Figure 44: South America Phosphonate Market Volume (K Tons), by End-user Industry 2025 & 2033
- Figure 45: South America Phosphonate Market Revenue Share (%), by End-user Industry 2025 & 2033
- Figure 46: South America Phosphonate Market Volume Share (%), by End-user Industry 2025 & 2033
- Figure 47: South America Phosphonate Market Revenue (Million), by Country 2025 & 2033
- Figure 48: South America Phosphonate Market Volume (K Tons), by Country 2025 & 2033
- Figure 49: South America Phosphonate Market Revenue Share (%), by Country 2025 & 2033
- Figure 50: South America Phosphonate Market Volume Share (%), by Country 2025 & 2033
- Figure 51: Middle East and Africa Phosphonate Market Revenue (Million), by Types 2025 & 2033
- Figure 52: Middle East and Africa Phosphonate Market Volume (K Tons), by Types 2025 & 2033
- Figure 53: Middle East and Africa Phosphonate Market Revenue Share (%), by Types 2025 & 2033
- Figure 54: Middle East and Africa Phosphonate Market Volume Share (%), by Types 2025 & 2033
- Figure 55: Middle East and Africa Phosphonate Market Revenue (Million), by End-user Industry 2025 & 2033
- Figure 56: Middle East and Africa Phosphonate Market Volume (K Tons), by End-user Industry 2025 & 2033
- Figure 57: Middle East and Africa Phosphonate Market Revenue Share (%), by End-user Industry 2025 & 2033
- Figure 58: Middle East and Africa Phosphonate Market Volume Share (%), by End-user Industry 2025 & 2033
- Figure 59: Middle East and Africa Phosphonate Market Revenue (Million), by Country 2025 & 2033
- Figure 60: Middle East and Africa Phosphonate Market Volume (K Tons), by Country 2025 & 2033
- Figure 61: Middle East and Africa Phosphonate Market Revenue Share (%), by Country 2025 & 2033
- Figure 62: Middle East and Africa Phosphonate Market Volume Share (%), by Country 2025 & 2033
List of Tables
- Table 1: Global Phosphonate Market Revenue Million Forecast, by Types 2020 & 2033
- Table 2: Global Phosphonate Market Volume K Tons Forecast, by Types 2020 & 2033
- Table 3: Global Phosphonate Market Revenue Million Forecast, by End-user Industry 2020 & 2033
- Table 4: Global Phosphonate Market Volume K Tons Forecast, by End-user Industry 2020 & 2033
- Table 5: Global Phosphonate Market Revenue Million Forecast, by Region 2020 & 2033
- Table 6: Global Phosphonate Market Volume K Tons Forecast, by Region 2020 & 2033
- Table 7: Global Phosphonate Market Revenue Million Forecast, by Types 2020 & 2033
- Table 8: Global Phosphonate Market Volume K Tons Forecast, by Types 2020 & 2033
- Table 9: Global Phosphonate Market Revenue Million Forecast, by End-user Industry 2020 & 2033
- Table 10: Global Phosphonate Market Volume K Tons Forecast, by End-user Industry 2020 & 2033
- Table 11: Global Phosphonate Market Revenue Million Forecast, by Country 2020 & 2033
- Table 12: Global Phosphonate Market Volume K Tons Forecast, by Country 2020 & 2033
- Table 13: China Phosphonate Market Revenue (Million) Forecast, by Application 2020 & 2033
- Table 14: China Phosphonate Market Volume (K Tons) Forecast, by Application 2020 & 2033
- Table 15: India Phosphonate Market Revenue (Million) Forecast, by Application 2020 & 2033
- Table 16: India Phosphonate Market Volume (K Tons) Forecast, by Application 2020 & 2033
- Table 17: Japan Phosphonate Market Revenue (Million) Forecast, by Application 2020 & 2033
- Table 18: Japan Phosphonate Market Volume (K Tons) Forecast, by Application 2020 & 2033
- Table 19: South Korea Phosphonate Market Revenue (Million) Forecast, by Application 2020 & 2033
- Table 20: South Korea Phosphonate Market Volume (K Tons) Forecast, by Application 2020 & 2033
- Table 21: Malaysia Phosphonate Market Revenue (Million) Forecast, by Application 2020 & 2033
- Table 22: Malaysia Phosphonate Market Volume (K Tons) Forecast, by Application 2020 & 2033
- Table 23: Thailand Phosphonate Market Revenue (Million) Forecast, by Application 2020 & 2033
- Table 24: Thailand Phosphonate Market Volume (K Tons) Forecast, by Application 2020 & 2033
- Table 25: Indonesia Phosphonate Market Revenue (Million) Forecast, by Application 2020 & 2033
- Table 26: Indonesia Phosphonate Market Volume (K Tons) Forecast, by Application 2020 & 2033
- Table 27: Vietnam Phosphonate Market Revenue (Million) Forecast, by Application 2020 & 2033
- Table 28: Vietnam Phosphonate Market Volume (K Tons) Forecast, by Application 2020 & 2033
- Table 29: Rest of Asia Pacific Phosphonate Market Revenue (Million) Forecast, by Application 2020 & 2033
- Table 30: Rest of Asia Pacific Phosphonate Market Volume (K Tons) Forecast, by Application 2020 & 2033
- Table 31: Global Phosphonate Market Revenue Million Forecast, by Types 2020 & 2033
- Table 32: Global Phosphonate Market Volume K Tons Forecast, by Types 2020 & 2033
- Table 33: Global Phosphonate Market Revenue Million Forecast, by End-user Industry 2020 & 2033
- Table 34: Global Phosphonate Market Volume K Tons Forecast, by End-user Industry 2020 & 2033
- Table 35: Global Phosphonate Market Revenue Million Forecast, by Country 2020 & 2033
- Table 36: Global Phosphonate Market Volume K Tons Forecast, by Country 2020 & 2033
- Table 37: United States Phosphonate Market Revenue (Million) Forecast, by Application 2020 & 2033
- Table 38: United States Phosphonate Market Volume (K Tons) Forecast, by Application 2020 & 2033
- Table 39: Canada Phosphonate Market Revenue (Million) Forecast, by Application 2020 & 2033
- Table 40: Canada Phosphonate Market Volume (K Tons) Forecast, by Application 2020 & 2033
- Table 41: Mexico Phosphonate Market Revenue (Million) Forecast, by Application 2020 & 2033
- Table 42: Mexico Phosphonate Market Volume (K Tons) Forecast, by Application 2020 & 2033
- Table 43: Global Phosphonate Market Revenue Million Forecast, by Types 2020 & 2033
- Table 44: Global Phosphonate Market Volume K Tons Forecast, by Types 2020 & 2033
- Table 45: Global Phosphonate Market Revenue Million Forecast, by End-user Industry 2020 & 2033
- Table 46: Global Phosphonate Market Volume K Tons Forecast, by End-user Industry 2020 & 2033
- Table 47: Global Phosphonate Market Revenue Million Forecast, by Country 2020 & 2033
- Table 48: Global Phosphonate Market Volume K Tons Forecast, by Country 2020 & 2033
- Table 49: Germany Phosphonate Market Revenue (Million) Forecast, by Application 2020 & 2033
- Table 50: Germany Phosphonate Market Volume (K Tons) Forecast, by Application 2020 & 2033
- Table 51: United Kingdom Phosphonate Market Revenue (Million) Forecast, by Application 2020 & 2033
- Table 52: United Kingdom Phosphonate Market Volume (K Tons) Forecast, by Application 2020 & 2033
- Table 53: France Phosphonate Market Revenue (Million) Forecast, by Application 2020 & 2033
- Table 54: France Phosphonate Market Volume (K Tons) Forecast, by Application 2020 & 2033
- Table 55: Italy Phosphonate Market Revenue (Million) Forecast, by Application 2020 & 2033
- Table 56: Italy Phosphonate Market Volume (K Tons) Forecast, by Application 2020 & 2033
- Table 57: Spain Phosphonate Market Revenue (Million) Forecast, by Application 2020 & 2033
- Table 58: Spain Phosphonate Market Volume (K Tons) Forecast, by Application 2020 & 2033
- Table 59: NORDIC Countries Phosphonate Market Revenue (Million) Forecast, by Application 2020 & 2033
- Table 60: NORDIC Countries Phosphonate Market Volume (K Tons) Forecast, by Application 2020 & 2033
- Table 61: Turkey Phosphonate Market Revenue (Million) Forecast, by Application 2020 & 2033
- Table 62: Turkey Phosphonate Market Volume (K Tons) Forecast, by Application 2020 & 2033
- Table 63: Russia Phosphonate Market Revenue (Million) Forecast, by Application 2020 & 2033
- Table 64: Russia Phosphonate Market Volume (K Tons) Forecast, by Application 2020 & 2033
- Table 65: Rest of Europe Phosphonate Market Revenue (Million) Forecast, by Application 2020 & 2033
- Table 66: Rest of Europe Phosphonate Market Volume (K Tons) Forecast, by Application 2020 & 2033
- Table 67: Global Phosphonate Market Revenue Million Forecast, by Types 2020 & 2033
- Table 68: Global Phosphonate Market Volume K Tons Forecast, by Types 2020 & 2033
- Table 69: Global Phosphonate Market Revenue Million Forecast, by End-user Industry 2020 & 2033
- Table 70: Global Phosphonate Market Volume K Tons Forecast, by End-user Industry 2020 & 2033
- Table 71: Global Phosphonate Market Revenue Million Forecast, by Country 2020 & 2033
- Table 72: Global Phosphonate Market Volume K Tons Forecast, by Country 2020 & 2033
- Table 73: Brazil Phosphonate Market Revenue (Million) Forecast, by Application 2020 & 2033
- Table 74: Brazil Phosphonate Market Volume (K Tons) Forecast, by Application 2020 & 2033
- Table 75: Argentina Phosphonate Market Revenue (Million) Forecast, by Application 2020 & 2033
- Table 76: Argentina Phosphonate Market Volume (K Tons) Forecast, by Application 2020 & 2033
- Table 77: Colombia Phosphonate Market Revenue (Million) Forecast, by Application 2020 & 2033
- Table 78: Colombia Phosphonate Market Volume (K Tons) Forecast, by Application 2020 & 2033
- Table 79: Rest of South America Phosphonate Market Revenue (Million) Forecast, by Application 2020 & 2033
- Table 80: Rest of South America Phosphonate Market Volume (K Tons) Forecast, by Application 2020 & 2033
- Table 81: Global Phosphonate Market Revenue Million Forecast, by Types 2020 & 2033
- Table 82: Global Phosphonate Market Volume K Tons Forecast, by Types 2020 & 2033
- Table 83: Global Phosphonate Market Revenue Million Forecast, by End-user Industry 2020 & 2033
- Table 84: Global Phosphonate Market Volume K Tons Forecast, by End-user Industry 2020 & 2033
- Table 85: Global Phosphonate Market Revenue Million Forecast, by Country 2020 & 2033
- Table 86: Global Phosphonate Market Volume K Tons Forecast, by Country 2020 & 2033
- Table 87: Saudi Arabia Phosphonate Market Revenue (Million) Forecast, by Application 2020 & 2033
- Table 88: Saudi Arabia Phosphonate Market Volume (K Tons) Forecast, by Application 2020 & 2033
- Table 89: Qatar Phosphonate Market Revenue (Million) Forecast, by Application 2020 & 2033
- Table 90: Qatar Phosphonate Market Volume (K Tons) Forecast, by Application 2020 & 2033
- Table 91: United Arab Emirates Phosphonate Market Revenue (Million) Forecast, by Application 2020 & 2033
- Table 92: United Arab Emirates Phosphonate Market Volume (K Tons) Forecast, by Application 2020 & 2033
- Table 93: Nigeria Phosphonate Market Revenue (Million) Forecast, by Application 2020 & 2033
- Table 94: Nigeria Phosphonate Market Volume (K Tons) Forecast, by Application 2020 & 2033
- Table 95: Egypt Phosphonate Market Revenue (Million) Forecast, by Application 2020 & 2033
- Table 96: Egypt Phosphonate Market Volume (K Tons) Forecast, by Application 2020 & 2033
- Table 97: South Africa Phosphonate Market Revenue (Million) Forecast, by Application 2020 & 2033
- Table 98: South Africa Phosphonate Market Volume (K Tons) Forecast, by Application 2020 & 2033
- Table 99: Rest of Middle East and Africa Phosphonate Market Revenue (Million) Forecast, by Application 2020 & 2033
- Table 100: Rest of Middle East and Africa Phosphonate Market Volume (K Tons) Forecast, by Application 2020 & 2033
Frequently Asked Questions
1. What is the projected Compound Annual Growth Rate (CAGR) of the Phosphonate Market?
The projected CAGR is approximately 4.65%.
2. Which companies are prominent players in the Phosphonate Market?
Key companies in the market include MKS DevO Chemicals, ZSCHIMMER & SCHWARZ CHEMIE GMBH, Zaozhuang Kerui Chemicals Co Ltd, Italmatch AWS, Protection Technology Co Ltd, Biesterfeld AG, Shandong Xintai Water Treatment Technology Co Ltd, Excel Industries, LANXESS, Henan Qingshuiyuan Technolog, Jiangsu Yuanquan Hongguang Environmental, Uniphos Chemicals, Aquapharm Chemical Pvt Ltd, Shandong Taihe Watre Treatment Technologies Co Ltd, IRO Group, Bozzetto Group, Changzhou Kewei Fine Chemicals Co Ltd.
3. What are the main segments of the Phosphonate Market?
The market segments include Types, End-user Industry.
4. Can you provide details about the market size?
The market size is estimated to be USD 0.98 Million as of 2022.
5. What are some drivers contributing to market growth?
Wide Applications of Phosphonates in the Water Treatment Industry; Rapid Growth of the Cleaners and Detergents Industry.
6. What are the notable trends driving market growth?
Increasing Demand in the Water Treatment Industry.
7. Are there any restraints impacting market growth?
Environmental impact due to non-degradable nature.
8. Can you provide examples of recent developments in the market?
In Oct 2021, Bisterfeld AG announced the acquisition of GME Chemicals to expand its presence in Asia.
9. What pricing options are available for accessing the report?
Pricing options include single-user, multi-user, and enterprise licenses priced at USD 4750, USD 5250, and USD 8750 respectively.
10. Is the market size provided in terms of value or volume?
The market size is provided in terms of value, measured in Million and volume, measured in K Tons.
11. Are there any specific market keywords associated with the report?
Yes, the market keyword associated with the report is "Phosphonate Market," which aids in identifying and referencing the specific market segment covered.
12. How do I determine which pricing option suits my needs best?
The pricing options vary based on user requirements and access needs. Individual users may opt for single-user licenses, while businesses requiring broader access may choose multi-user or enterprise licenses for cost-effective access to the report.
13. Are there any additional resources or data provided in the Phosphonate Market report?
While the report offers comprehensive insights, it's advisable to review the specific contents or supplementary materials provided to ascertain if additional resources or data are available.
14. How can I stay updated on further developments or reports in the Phosphonate Market?
To stay informed about further developments, trends, and reports in the Phosphonate Market, consider subscribing to industry newsletters, following relevant companies and organizations, or regularly checking reputable industry news sources and publications.
Methodology
Step 1 - Identification of Relevant Samples Size from Population Database


Step 2 - Approaches for Defining Global Market Size (Value, Volume* & Price*)

Note*: In applicable scenarios
Step 3 - Data Sources
Primary Research
- Web Analytics
- Survey Reports
- Research Institute
- Latest Research Reports
- Opinion Leaders
Secondary Research
- Annual Reports
- White Paper
- Latest Press Release
- Industry Association
- Paid Database
- Investor Presentations

Step 4 - Data Triangulation
Involves using different sources of information in order to increase the validity of a study
These sources are likely to be stakeholders in a program - participants, other researchers, program staff, other community members, and so on.
Then we put all data in single framework & apply various statistical tools to find out the dynamic on the market.
During the analysis stage, feedback from the stakeholder groups would be compared to determine areas of agreement as well as areas of divergence