

Key Insights
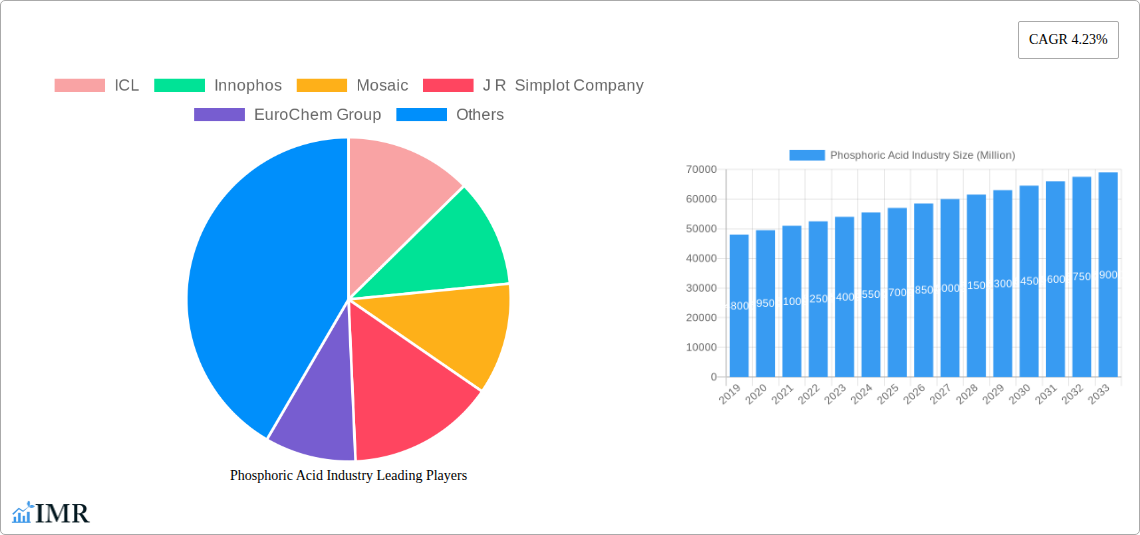
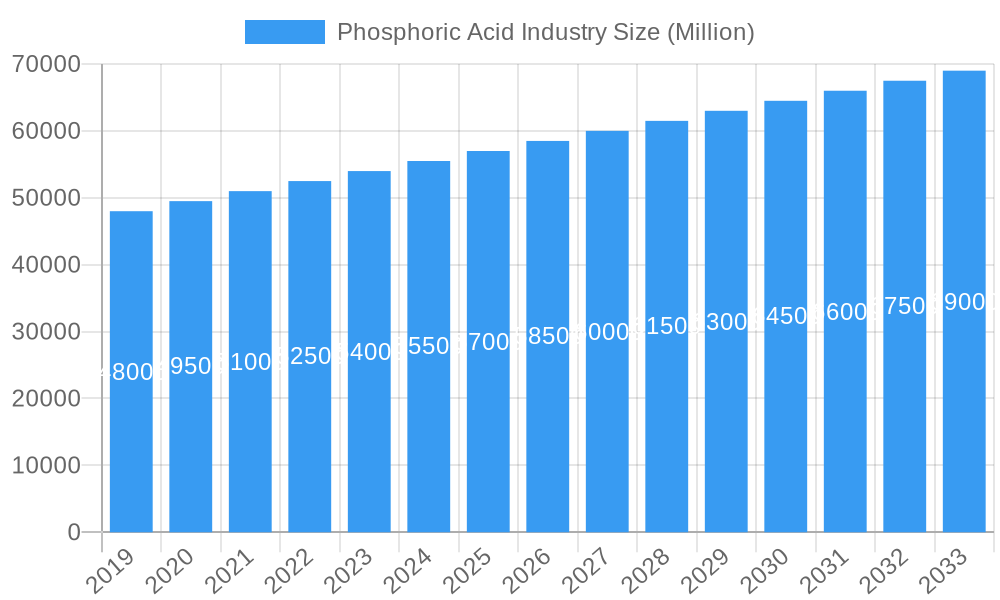
The global Phosphoric Acid market is projected to reach a substantial market size of 69.1 billion by 2025, driven by a robust Compound Annual Growth Rate (CAGR) of 5.7%. This expansion is primarily fueled by increasing demand in the fertilizer industry, vital for global food security. Emerging applications in food and beverages, pharmaceuticals, and metallurgy, alongside industrialization in the Asia Pacific region, further stimulate market growth. Innovations in high-purity phosphoric acid production also present significant opportunities.
Phosphoric Acid Industry Market Size (In Billion)
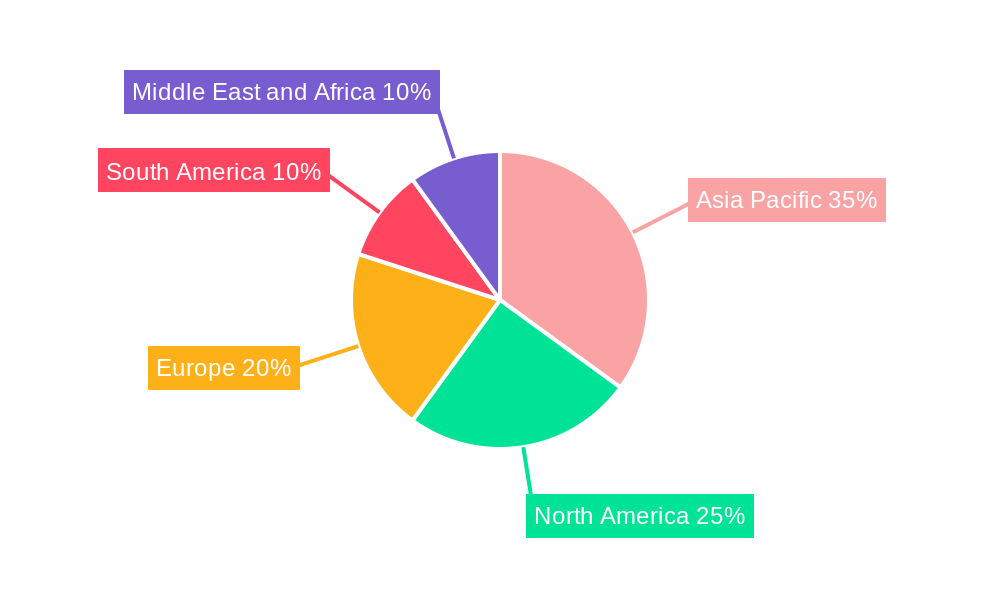
While environmental regulations and raw material price volatility pose challenges, the essential role of phosphoric acid and advancements in sustainable production are expected to counterbalance these restraints. The market is segmented by end-users, with fertilizers dominating, followed by food & beverages and chemicals. Pharmaceutical and metallurgical sectors are also experiencing growth. Geographically, the Asia Pacific region, led by China and India, is expected to be the largest and fastest-growing market, while North America and Europe remain significant with a focus on technological advancements.
Phosphoric Acid Industry Company Market Share
This report provides a comprehensive overview of the Phosphoric Acid Industry, analyzing market dynamics, growth trends, regional dominance, product landscape, key drivers, barriers, emerging opportunities, and growth accelerators. It offers critical insights for industry stakeholders, detailing major players and strategic planning for the phosphoric acid value chain. The analysis encompasses both the parent market and its key sub-markets.
Phosphoric Acid Industry Market Dynamics & Structure
The global Phosphoric Acid Industry exhibits a moderate market concentration, with a few key players dominating production and distribution. Technological innovation remains a significant driver, particularly in enhancing production efficiency, improving product purity for specialized applications like food and pharmaceuticals, and developing sustainable manufacturing processes. Regulatory frameworks, especially concerning environmental impact and product safety standards, play a crucial role in shaping market entry and operational strategies. Competitive product substitutes exist, but phosphoric acid's unique properties make it indispensable in core applications. End-user demographics are primarily driven by the agricultural sector's demand for fertilizers, followed by the food and beverage, chemicals, and medicine industries. Mergers and acquisitions (M&A) trends are indicative of consolidation efforts and strategic expansion, aiming to secure market share and diversify product portfolios.
- Market Concentration: Dominated by major global producers with significant R&D investments.
- Technological Innovation: Focus on process optimization, higher purity grades, and environmental sustainability.
- Regulatory Landscape: Stringent environmental and safety regulations impacting production and handling.
- Competitive Substitutes: Limited direct substitutes for many core applications.
- End-User Demographics: Agriculture remains the largest consumer, with growing demand from food, chemical, and pharmaceutical sectors.
- M&A Trends: Strategic acquisitions to expand geographic reach and product offerings, with deal volumes projected to increase.
Phosphoric Acid Industry Growth Trends & Insights
The Phosphoric Acid Industry is poised for substantial growth, driven by increasing global demand for food production and a burgeoning industrial sector. Market size evolution is marked by steady expansion, with a projected Compound Annual Growth Rate (CAGR) of approximately XX% from 2025 to 2033. Adoption rates for purified phosphoric acid in the food and beverage and pharmaceutical sectors are steadily increasing, reflecting a growing consumer preference for high-quality, processed goods and effective medicinal formulations. Technological disruptions, such as advancements in wet process technology and the development of more energy-efficient production methods, are contributing to improved cost-effectiveness and sustainability. Consumer behavior shifts, particularly a greater emphasis on food safety and the demand for phosphate-based additives in processed foods, are further fueling market penetration. The upstream influence of phosphate rock mining and the downstream applications in fertilizers and industrial chemicals create a robust and interconnected market ecosystem.
- Market Size Evolution: Consistent growth driven by agricultural and industrial demand.
- Adoption Rates: Increasing uptake of high-purity phosphoric acid in specialized applications.
- Technological Disruptions: Innovations in production efficiency and sustainability.
- Consumer Behavior Shifts: Growing demand for phosphate-based food additives and pharmaceuticals.
- Market Penetration: Driven by increasing end-user applications globally.
Dominant Regions, Countries, or Segments in Phosphoric Acid Industry
The Fertilizer end-user industry remains the undisputed dominant segment driving growth in the global Phosphoric Acid market. This dominance is intrinsically linked to the fundamental need for agricultural productivity to feed a growing world population. Regions with vast arable land and significant agricultural output, such as Asia-Pacific and North America, consequently exhibit the highest demand for phosphoric acid-based fertilizers.
- Asia-Pacific: Leads in fertilizer consumption due to large agricultural economies like China and India. Government initiatives supporting food security and agricultural modernization further bolster demand.
- North America: A significant market driven by advanced agricultural practices and robust food processing industries. The presence of major fertilizer producers contributes to its strong market position.
- Europe: While mature, it shows steady demand for specialized fertilizers and a growing market for food-grade and industrial phosphoric acid. Stringent environmental regulations influence production processes.
- Latin America: An emerging market with significant agricultural potential, particularly in Brazil and Argentina, driving demand for fertilizers.
Factors contributing to the dominance of the fertilizer segment include:
- Economic Policies: Government subsidies and agricultural support programs directly influence fertilizer demand.
- Infrastructure: Well-developed logistics and distribution networks are crucial for the efficient supply of fertilizers.
- Population Growth: The ever-increasing global population necessitates higher food production, directly translating to higher fertilizer consumption.
- Technological Advancements in Agriculture: The adoption of modern farming techniques often involves the increased use of nutrient-rich fertilizers.
The market share of the fertilizer segment is estimated to be over XX% of the total phosphoric acid consumption. Growth potential remains robust, driven by the ongoing need to enhance crop yields in a world facing resource constraints.
Phosphoric Acid Industry Product Landscape
The Phosphoric Acid Industry's product landscape is characterized by its versatility, with applications spanning across various critical sectors. Key innovations focus on producing higher purity grades of phosphoric acid, essential for the food and beverage industry as an acidulant, flavor enhancer, and preservative. In the pharmaceutical sector, pharmaceutical-grade phosphoric acid is vital for drug formulations and as a pH adjuster. Industrial-grade phosphoric acid finds extensive use in metal treatment, rust removal, and as a component in detergents and catalysts. The development of concentrated phosphoric acid grades and specialized derivatives continues to enhance performance metrics in diverse applications, catering to evolving industrial and consumer needs.
Key Drivers, Barriers & Challenges in Phosphoric Acid Industry
Key Drivers: The phosphoric acid market is propelled by several key drivers. The burgeoning global population and the subsequent demand for increased food production are primary catalysts, directly fueling the need for phosphate-based fertilizers. Technological advancements in agricultural practices and the growing adoption of higher-yield farming techniques further amplify this demand. Additionally, the expanding food and beverage industry, with its increasing reliance on phosphoric acid as an additive, and the pharmaceutical sector's consistent need for high-purity grades, are significant growth accelerators. Government policies promoting food security and agricultural development in emerging economies also play a pivotal role.
Key Barriers & Challenges: Despite its robust growth potential, the phosphoric acid industry faces several challenges. The primary restraint stems from the availability and price volatility of phosphate rock, the primary raw material. Environmental concerns related to phosphate mining, including land degradation and water pollution, necessitate significant investments in sustainable practices and compliance with stringent regulations, impacting production costs and potentially limiting capacity expansion. Supply chain disruptions, geopolitical factors affecting raw material sourcing, and the capital-intensive nature of production facilities also pose significant hurdles. Competitive pressures among major players and the development of alternative nutrient sources in agriculture, though currently limited, represent ongoing challenges.
Emerging Opportunities in Phosphoric Acid Industry
Emerging opportunities in the Phosphoric Acid Industry lie in the development of novel applications and the expansion into underserved markets. The growing demand for sustainable agriculture presents opportunities for enhanced fertilizer formulations that optimize nutrient uptake and minimize environmental impact. The food and beverage sector continues to offer avenues for innovation in clean-label ingredients and functional food additives. Furthermore, the expanding healthcare sector in developing economies is expected to drive demand for pharmaceutical-grade phosphoric acid. Exploring waste valorization techniques to recover phosphorus from industrial by-products also represents a significant untapped opportunity for sustainable production.
Growth Accelerators in the Phosphoric Acid Industry Industry
Several catalysts are accelerating the long-term growth of the Phosphoric Acid Industry. Technological breakthroughs in the extraction and purification of phosphoric acid are enhancing efficiency and reducing costs, making the product more accessible. Strategic partnerships and collaborations between raw material suppliers, manufacturers, and end-users are fostering market integration and driving innovation. Market expansion strategies, particularly in emerging economies with rapidly growing agricultural and industrial sectors, are crucial growth accelerators. The increasing focus on circular economy principles and the development of phosphorus recovery technologies will also contribute to sustainable growth and market resilience.
Key Players Shaping the Phosphoric Acid Industry Market
- ICL
- Innophos
- Mosaic
- J R Simplot Company
- EuroChem Group
- Sterlite Copper (A Unit of Vedanta Limited)
- Agropolychim
- Aditya Birla Chemicals
- Phosagro
- IFFCO
- Nutrien Ltd
Notable Milestones in Phosphoric Acid Industry Sector
- May 2023: The OCP Group secured a 50% ownership share in GlobalFeed SL. This strategic acquisition enabled OCP to broaden its presence in the animal nutrition industry and enhance customers' accessibility to the company's phosphoric acid products.
- July 2022: Nutrien Ltd acquired Brazilian company Casa do Adubo SA (Casa do Adubo). This acquisition included the transaction of 39 retail stores and ten distribution centers, which allows Nutrien to expand its reach to customers and is expected to generate a sales revenue of USD 400 million.
- February 2022: EuroChem Group completed the acquisition of the Serra do Salitre phosphate project and took over the advanced-stage mine and plant in Minas Gerais. This complex comprises an open-pit phosphate mine with over 350 million metric tons (MMT) of reserves and a plant with a production capacity of 1 MMT of fertilizers per year.
In-Depth Phosphoric Acid Industry Market Outlook
The Phosphoric Acid Industry market outlook is exceptionally positive, characterized by sustained growth fueled by fundamental global needs. The increasing demand for food security, coupled with advancements in agricultural efficiency, will continue to drive the dominant fertilizer segment. Innovations in higher-purity phosphoric acid for food, beverage, and pharmaceutical applications are creating niche growth opportunities. Strategic investments in sustainable production and phosphorus recovery technologies are expected to enhance market resilience and profitability. The industry's ability to adapt to evolving environmental regulations and leverage technological advancements will be key to unlocking its full future market potential and achieving strategic objectives.
Phosphoric Acid Industry Segmentation
-
1. End-user Industry
- 1.1. Fertilizer
- 1.2. Food and Beverages
- 1.3. Chemicals
- 1.4. Medicine
- 1.5. Metallurgy
- 1.6. Other End-user Industries
Phosphoric Acid Industry Segmentation By Geography
-
1. Asia Pacific
- 1.1. China
- 1.2. India
- 1.3. Japan
- 1.4. South Korea
- 1.5. Rest of Asia Pacific
-
2. North America
- 2.1. United States
- 2.2. Mexico
- 2.3. Canada
-
3. Europe
- 3.1. Germany
- 3.2. United Kingdom
- 3.3. Italy
- 3.4. France
- 3.5. Rest of Europe
-
4. South America
- 4.1. Brazil
- 4.2. Argentina
- 4.3. Rest of South America
-
5. Middle East and Africa
- 5.1. Saudi Arabia
- 5.2. South Africa
- 5.3. Rest of Middle East and Africa
Phosphoric Acid Industry Regional Market Share
Geographic Coverage of Phosphoric Acid Industry
Phosphoric Acid Industry REPORT HIGHLIGHTS
| Aspects | Details |
|---|---|
| Study Period | 2020-2034 |
| Base Year | 2025 |
| Estimated Year | 2026 |
| Forecast Period | 2026-2034 |
| Historical Period | 2020-2025 |
| Growth Rate | CAGR of 5.7% from 2020-2034 |
| Segmentation |
|
Table of Contents
- 1. Introduction
- 1.1. Research Scope
- 1.2. Market Segmentation
- 1.3. Research Objective
- 1.4. Definitions and Assumptions
- 2. Executive Summary
- 2.1. Market Snapshot
- 3. Market Dynamics
- 3.1. Market Drivers
- 3.2. Market Restrains
- 3.3. Market Trends
- 3.4. Market Opportunities
- 4. Market Factor Analysis
- 4.1. Porters Five Forces
- 4.1.1. Bargaining Power of Suppliers
- 4.1.2. Bargaining Power of Buyers
- 4.1.3. Threat of New Entrants
- 4.1.4. Threat of Substitutes
- 4.1.5. Competitive Rivalry
- 4.2. PESTEL analysis
- 4.3. BCG Analysis
- 4.3.1. Stars (High Growth, High Market Share)
- 4.3.2. Cash Cows (Low Growth, High Market Share)
- 4.3.3. Question Mark (High Growth, Low Market Share)
- 4.3.4. Dogs (Low Growth, Low Market Share)
- 4.4. Ansoff Matrix Analysis
- 4.5. Supply Chain Analysis
- 4.6. Regulatory Landscape
- 4.7. Current Market Potential and Opportunity Assessment (TAM–SAM–SOM Framework)
- 4.8. IMR Analyst Note
- 4.1. Porters Five Forces
- 5. Market Analysis, Insights and Forecast 2021-2033
- 5.1. Market Analysis, Insights and Forecast - by End-user Industry
- 5.1.1. Fertilizer
- 5.1.2. Food and Beverages
- 5.1.3. Chemicals
- 5.1.4. Medicine
- 5.1.5. Metallurgy
- 5.1.6. Other End-user Industries
- 5.2. Market Analysis, Insights and Forecast - by Region
- 5.2.1. Asia Pacific
- 5.2.2. North America
- 5.2.3. Europe
- 5.2.4. South America
- 5.2.5. Middle East and Africa
- 5.1. Market Analysis, Insights and Forecast - by End-user Industry
- 6. Global Phosphoric Acid Industry Analysis, Insights and Forecast, 2021-2033
- 6.1. Market Analysis, Insights and Forecast - by End-user Industry
- 6.1.1. Fertilizer
- 6.1.2. Food and Beverages
- 6.1.3. Chemicals
- 6.1.4. Medicine
- 6.1.5. Metallurgy
- 6.1.6. Other End-user Industries
- 6.1. Market Analysis, Insights and Forecast - by End-user Industry
- 7. Asia Pacific Phosphoric Acid Industry Analysis, Insights and Forecast, 2020-2032
- 7.1. Market Analysis, Insights and Forecast - by End-user Industry
- 7.1.1. Fertilizer
- 7.1.2. Food and Beverages
- 7.1.3. Chemicals
- 7.1.4. Medicine
- 7.1.5. Metallurgy
- 7.1.6. Other End-user Industries
- 7.1. Market Analysis, Insights and Forecast - by End-user Industry
- 8. North America Phosphoric Acid Industry Analysis, Insights and Forecast, 2020-2032
- 8.1. Market Analysis, Insights and Forecast - by End-user Industry
- 8.1.1. Fertilizer
- 8.1.2. Food and Beverages
- 8.1.3. Chemicals
- 8.1.4. Medicine
- 8.1.5. Metallurgy
- 8.1.6. Other End-user Industries
- 8.1. Market Analysis, Insights and Forecast - by End-user Industry
- 9. Europe Phosphoric Acid Industry Analysis, Insights and Forecast, 2020-2032
- 9.1. Market Analysis, Insights and Forecast - by End-user Industry
- 9.1.1. Fertilizer
- 9.1.2. Food and Beverages
- 9.1.3. Chemicals
- 9.1.4. Medicine
- 9.1.5. Metallurgy
- 9.1.6. Other End-user Industries
- 9.1. Market Analysis, Insights and Forecast - by End-user Industry
- 10. South America Phosphoric Acid Industry Analysis, Insights and Forecast, 2020-2032
- 10.1. Market Analysis, Insights and Forecast - by End-user Industry
- 10.1.1. Fertilizer
- 10.1.2. Food and Beverages
- 10.1.3. Chemicals
- 10.1.4. Medicine
- 10.1.5. Metallurgy
- 10.1.6. Other End-user Industries
- 10.1. Market Analysis, Insights and Forecast - by End-user Industry
- 11. Middle East and Africa Phosphoric Acid Industry Analysis, Insights and Forecast, 2020-2032
- 11.1. Market Analysis, Insights and Forecast - by End-user Industry
- 11.1.1. Fertilizer
- 11.1.2. Food and Beverages
- 11.1.3. Chemicals
- 11.1.4. Medicine
- 11.1.5. Metallurgy
- 11.1.6. Other End-user Industries
- 11.1. Market Analysis, Insights and Forecast - by End-user Industry
- 12. Competitive Analysis
- 12.1. Company Profiles
- 12.1.1 ICL
- 12.1.1.1. Company Overview
- 12.1.1.2. Products
- 12.1.1.3. Company Financials
- 12.1.1.4. SWOT Analysis
- 12.1.2 Innophos
- 12.1.2.1. Company Overview
- 12.1.2.2. Products
- 12.1.2.3. Company Financials
- 12.1.2.4. SWOT Analysis
- 12.1.3 Mosaic
- 12.1.3.1. Company Overview
- 12.1.3.2. Products
- 12.1.3.3. Company Financials
- 12.1.3.4. SWOT Analysis
- 12.1.4 J R Simplot Company
- 12.1.4.1. Company Overview
- 12.1.4.2. Products
- 12.1.4.3. Company Financials
- 12.1.4.4. SWOT Analysis
- 12.1.5 EuroChem Group
- 12.1.5.1. Company Overview
- 12.1.5.2. Products
- 12.1.5.3. Company Financials
- 12.1.5.4. SWOT Analysis
- 12.1.6 Sterlite Copper (A Unit of Vedanta Limited) *List Not Exhaustive
- 12.1.6.1. Company Overview
- 12.1.6.2. Products
- 12.1.6.3. Company Financials
- 12.1.6.4. SWOT Analysis
- 12.1.7 Agropolychim
- 12.1.7.1. Company Overview
- 12.1.7.2. Products
- 12.1.7.3. Company Financials
- 12.1.7.4. SWOT Analysis
- 12.1.8 Aditya Birla Chemicals
- 12.1.8.1. Company Overview
- 12.1.8.2. Products
- 12.1.8.3. Company Financials
- 12.1.8.4. SWOT Analysis
- 12.1.9 Phosagro
- 12.1.9.1. Company Overview
- 12.1.9.2. Products
- 12.1.9.3. Company Financials
- 12.1.9.4. SWOT Analysis
- 12.1.10 IFFCO
- 12.1.10.1. Company Overview
- 12.1.10.2. Products
- 12.1.10.3. Company Financials
- 12.1.10.4. SWOT Analysis
- 12.1.11 Nutrien Ltd
- 12.1.11.1. Company Overview
- 12.1.11.2. Products
- 12.1.11.3. Company Financials
- 12.1.11.4. SWOT Analysis
- 12.1.1 ICL
- 12.2. Market Entropy
- 12.2.1 Company's Key Areas Served
- 12.2.2 Recent Developments
- 12.3. Company Market Share Analysis 2025
- 12.3.1 Top 5 Companies Market Share Analysis
- 12.3.2 Top 3 Companies Market Share Analysis
- 12.4. List of Potential Customers
- 13. Research Methodology
List of Figures
- Figure 1: Global Phosphoric Acid Industry Revenue Breakdown (billion, %) by Region 2025 & 2033
- Figure 2: Global Phosphoric Acid Industry Volume Breakdown (Million, %) by Region 2025 & 2033
- Figure 3: Asia Pacific Phosphoric Acid Industry Revenue (billion), by End-user Industry 2025 & 2033
- Figure 4: Asia Pacific Phosphoric Acid Industry Volume (Million), by End-user Industry 2025 & 2033
- Figure 5: Asia Pacific Phosphoric Acid Industry Revenue Share (%), by End-user Industry 2025 & 2033
- Figure 6: Asia Pacific Phosphoric Acid Industry Volume Share (%), by End-user Industry 2025 & 2033
- Figure 7: Asia Pacific Phosphoric Acid Industry Revenue (billion), by Country 2025 & 2033
- Figure 8: Asia Pacific Phosphoric Acid Industry Volume (Million), by Country 2025 & 2033
- Figure 9: Asia Pacific Phosphoric Acid Industry Revenue Share (%), by Country 2025 & 2033
- Figure 10: Asia Pacific Phosphoric Acid Industry Volume Share (%), by Country 2025 & 2033
- Figure 11: North America Phosphoric Acid Industry Revenue (billion), by End-user Industry 2025 & 2033
- Figure 12: North America Phosphoric Acid Industry Volume (Million), by End-user Industry 2025 & 2033
- Figure 13: North America Phosphoric Acid Industry Revenue Share (%), by End-user Industry 2025 & 2033
- Figure 14: North America Phosphoric Acid Industry Volume Share (%), by End-user Industry 2025 & 2033
- Figure 15: North America Phosphoric Acid Industry Revenue (billion), by Country 2025 & 2033
- Figure 16: North America Phosphoric Acid Industry Volume (Million), by Country 2025 & 2033
- Figure 17: North America Phosphoric Acid Industry Revenue Share (%), by Country 2025 & 2033
- Figure 18: North America Phosphoric Acid Industry Volume Share (%), by Country 2025 & 2033
- Figure 19: Europe Phosphoric Acid Industry Revenue (billion), by End-user Industry 2025 & 2033
- Figure 20: Europe Phosphoric Acid Industry Volume (Million), by End-user Industry 2025 & 2033
- Figure 21: Europe Phosphoric Acid Industry Revenue Share (%), by End-user Industry 2025 & 2033
- Figure 22: Europe Phosphoric Acid Industry Volume Share (%), by End-user Industry 2025 & 2033
- Figure 23: Europe Phosphoric Acid Industry Revenue (billion), by Country 2025 & 2033
- Figure 24: Europe Phosphoric Acid Industry Volume (Million), by Country 2025 & 2033
- Figure 25: Europe Phosphoric Acid Industry Revenue Share (%), by Country 2025 & 2033
- Figure 26: Europe Phosphoric Acid Industry Volume Share (%), by Country 2025 & 2033
- Figure 27: South America Phosphoric Acid Industry Revenue (billion), by End-user Industry 2025 & 2033
- Figure 28: South America Phosphoric Acid Industry Volume (Million), by End-user Industry 2025 & 2033
- Figure 29: South America Phosphoric Acid Industry Revenue Share (%), by End-user Industry 2025 & 2033
- Figure 30: South America Phosphoric Acid Industry Volume Share (%), by End-user Industry 2025 & 2033
- Figure 31: South America Phosphoric Acid Industry Revenue (billion), by Country 2025 & 2033
- Figure 32: South America Phosphoric Acid Industry Volume (Million), by Country 2025 & 2033
- Figure 33: South America Phosphoric Acid Industry Revenue Share (%), by Country 2025 & 2033
- Figure 34: South America Phosphoric Acid Industry Volume Share (%), by Country 2025 & 2033
- Figure 35: Middle East and Africa Phosphoric Acid Industry Revenue (billion), by End-user Industry 2025 & 2033
- Figure 36: Middle East and Africa Phosphoric Acid Industry Volume (Million), by End-user Industry 2025 & 2033
- Figure 37: Middle East and Africa Phosphoric Acid Industry Revenue Share (%), by End-user Industry 2025 & 2033
- Figure 38: Middle East and Africa Phosphoric Acid Industry Volume Share (%), by End-user Industry 2025 & 2033
- Figure 39: Middle East and Africa Phosphoric Acid Industry Revenue (billion), by Country 2025 & 2033
- Figure 40: Middle East and Africa Phosphoric Acid Industry Volume (Million), by Country 2025 & 2033
- Figure 41: Middle East and Africa Phosphoric Acid Industry Revenue Share (%), by Country 2025 & 2033
- Figure 42: Middle East and Africa Phosphoric Acid Industry Volume Share (%), by Country 2025 & 2033
List of Tables
- Table 1: Global Phosphoric Acid Industry Revenue billion Forecast, by End-user Industry 2020 & 2033
- Table 2: Global Phosphoric Acid Industry Volume Million Forecast, by End-user Industry 2020 & 2033
- Table 3: Global Phosphoric Acid Industry Revenue billion Forecast, by Region 2020 & 2033
- Table 4: Global Phosphoric Acid Industry Volume Million Forecast, by Region 2020 & 2033
- Table 5: Global Phosphoric Acid Industry Revenue billion Forecast, by End-user Industry 2020 & 2033
- Table 6: Global Phosphoric Acid Industry Volume Million Forecast, by End-user Industry 2020 & 2033
- Table 7: Global Phosphoric Acid Industry Revenue billion Forecast, by Country 2020 & 2033
- Table 8: Global Phosphoric Acid Industry Volume Million Forecast, by Country 2020 & 2033
- Table 9: China Phosphoric Acid Industry Revenue (billion) Forecast, by Application 2020 & 2033
- Table 10: China Phosphoric Acid Industry Volume (Million) Forecast, by Application 2020 & 2033
- Table 11: India Phosphoric Acid Industry Revenue (billion) Forecast, by Application 2020 & 2033
- Table 12: India Phosphoric Acid Industry Volume (Million) Forecast, by Application 2020 & 2033
- Table 13: Japan Phosphoric Acid Industry Revenue (billion) Forecast, by Application 2020 & 2033
- Table 14: Japan Phosphoric Acid Industry Volume (Million) Forecast, by Application 2020 & 2033
- Table 15: South Korea Phosphoric Acid Industry Revenue (billion) Forecast, by Application 2020 & 2033
- Table 16: South Korea Phosphoric Acid Industry Volume (Million) Forecast, by Application 2020 & 2033
- Table 17: Rest of Asia Pacific Phosphoric Acid Industry Revenue (billion) Forecast, by Application 2020 & 2033
- Table 18: Rest of Asia Pacific Phosphoric Acid Industry Volume (Million) Forecast, by Application 2020 & 2033
- Table 19: Global Phosphoric Acid Industry Revenue billion Forecast, by End-user Industry 2020 & 2033
- Table 20: Global Phosphoric Acid Industry Volume Million Forecast, by End-user Industry 2020 & 2033
- Table 21: Global Phosphoric Acid Industry Revenue billion Forecast, by Country 2020 & 2033
- Table 22: Global Phosphoric Acid Industry Volume Million Forecast, by Country 2020 & 2033
- Table 23: United States Phosphoric Acid Industry Revenue (billion) Forecast, by Application 2020 & 2033
- Table 24: United States Phosphoric Acid Industry Volume (Million) Forecast, by Application 2020 & 2033
- Table 25: Mexico Phosphoric Acid Industry Revenue (billion) Forecast, by Application 2020 & 2033
- Table 26: Mexico Phosphoric Acid Industry Volume (Million) Forecast, by Application 2020 & 2033
- Table 27: Canada Phosphoric Acid Industry Revenue (billion) Forecast, by Application 2020 & 2033
- Table 28: Canada Phosphoric Acid Industry Volume (Million) Forecast, by Application 2020 & 2033
- Table 29: Global Phosphoric Acid Industry Revenue billion Forecast, by End-user Industry 2020 & 2033
- Table 30: Global Phosphoric Acid Industry Volume Million Forecast, by End-user Industry 2020 & 2033
- Table 31: Global Phosphoric Acid Industry Revenue billion Forecast, by Country 2020 & 2033
- Table 32: Global Phosphoric Acid Industry Volume Million Forecast, by Country 2020 & 2033
- Table 33: Germany Phosphoric Acid Industry Revenue (billion) Forecast, by Application 2020 & 2033
- Table 34: Germany Phosphoric Acid Industry Volume (Million) Forecast, by Application 2020 & 2033
- Table 35: United Kingdom Phosphoric Acid Industry Revenue (billion) Forecast, by Application 2020 & 2033
- Table 36: United Kingdom Phosphoric Acid Industry Volume (Million) Forecast, by Application 2020 & 2033
- Table 37: Italy Phosphoric Acid Industry Revenue (billion) Forecast, by Application 2020 & 2033
- Table 38: Italy Phosphoric Acid Industry Volume (Million) Forecast, by Application 2020 & 2033
- Table 39: France Phosphoric Acid Industry Revenue (billion) Forecast, by Application 2020 & 2033
- Table 40: France Phosphoric Acid Industry Volume (Million) Forecast, by Application 2020 & 2033
- Table 41: Rest of Europe Phosphoric Acid Industry Revenue (billion) Forecast, by Application 2020 & 2033
- Table 42: Rest of Europe Phosphoric Acid Industry Volume (Million) Forecast, by Application 2020 & 2033
- Table 43: Global Phosphoric Acid Industry Revenue billion Forecast, by End-user Industry 2020 & 2033
- Table 44: Global Phosphoric Acid Industry Volume Million Forecast, by End-user Industry 2020 & 2033
- Table 45: Global Phosphoric Acid Industry Revenue billion Forecast, by Country 2020 & 2033
- Table 46: Global Phosphoric Acid Industry Volume Million Forecast, by Country 2020 & 2033
- Table 47: Brazil Phosphoric Acid Industry Revenue (billion) Forecast, by Application 2020 & 2033
- Table 48: Brazil Phosphoric Acid Industry Volume (Million) Forecast, by Application 2020 & 2033
- Table 49: Argentina Phosphoric Acid Industry Revenue (billion) Forecast, by Application 2020 & 2033
- Table 50: Argentina Phosphoric Acid Industry Volume (Million) Forecast, by Application 2020 & 2033
- Table 51: Rest of South America Phosphoric Acid Industry Revenue (billion) Forecast, by Application 2020 & 2033
- Table 52: Rest of South America Phosphoric Acid Industry Volume (Million) Forecast, by Application 2020 & 2033
- Table 53: Global Phosphoric Acid Industry Revenue billion Forecast, by End-user Industry 2020 & 2033
- Table 54: Global Phosphoric Acid Industry Volume Million Forecast, by End-user Industry 2020 & 2033
- Table 55: Global Phosphoric Acid Industry Revenue billion Forecast, by Country 2020 & 2033
- Table 56: Global Phosphoric Acid Industry Volume Million Forecast, by Country 2020 & 2033
- Table 57: Saudi Arabia Phosphoric Acid Industry Revenue (billion) Forecast, by Application 2020 & 2033
- Table 58: Saudi Arabia Phosphoric Acid Industry Volume (Million) Forecast, by Application 2020 & 2033
- Table 59: South Africa Phosphoric Acid Industry Revenue (billion) Forecast, by Application 2020 & 2033
- Table 60: South Africa Phosphoric Acid Industry Volume (Million) Forecast, by Application 2020 & 2033
- Table 61: Rest of Middle East and Africa Phosphoric Acid Industry Revenue (billion) Forecast, by Application 2020 & 2033
- Table 62: Rest of Middle East and Africa Phosphoric Acid Industry Volume (Million) Forecast, by Application 2020 & 2033
Frequently Asked Questions
1. What is the projected Compound Annual Growth Rate (CAGR) of the Phosphoric Acid Industry?
The projected CAGR is approximately 5.7%.
2. Which companies are prominent players in the Phosphoric Acid Industry?
Key companies in the market include ICL, Innophos, Mosaic, J R Simplot Company, EuroChem Group, Sterlite Copper (A Unit of Vedanta Limited) *List Not Exhaustive, Agropolychim, Aditya Birla Chemicals, Phosagro, IFFCO, Nutrien Ltd.
3. What are the main segments of the Phosphoric Acid Industry?
The market segments include End-user Industry.
4. Can you provide details about the market size?
The market size is estimated to be USD 69.1 billion as of 2022.
5. What are some drivers contributing to market growth?
High Demand for Fertilizer Industry; Increasing Usage in the Food and Beverage Industry.
6. What are the notable trends driving market growth?
Fertilizer Industry to Dominate the Market.
7. Are there any restraints impacting market growth?
Health Hazards Caused by Phosphoric Acid.
8. Can you provide examples of recent developments in the market?
May 2023: The OCP Group secured a 50% ownership share in GlobalFeed SL. This strategic acquisition enabled OCP to broaden its presence in the animal nutrition industry and enhance customers' accessibility to the company's phosphoric acid products.
9. What pricing options are available for accessing the report?
Pricing options include single-user, multi-user, and enterprise licenses priced at USD 4750, USD 5250, and USD 8750 respectively.
10. Is the market size provided in terms of value or volume?
The market size is provided in terms of value, measured in billion and volume, measured in Million.
11. Are there any specific market keywords associated with the report?
Yes, the market keyword associated with the report is "Phosphoric Acid Industry," which aids in identifying and referencing the specific market segment covered.
12. How do I determine which pricing option suits my needs best?
The pricing options vary based on user requirements and access needs. Individual users may opt for single-user licenses, while businesses requiring broader access may choose multi-user or enterprise licenses for cost-effective access to the report.
13. Are there any additional resources or data provided in the Phosphoric Acid Industry report?
While the report offers comprehensive insights, it's advisable to review the specific contents or supplementary materials provided to ascertain if additional resources or data are available.
14. How can I stay updated on further developments or reports in the Phosphoric Acid Industry?
To stay informed about further developments, trends, and reports in the Phosphoric Acid Industry, consider subscribing to industry newsletters, following relevant companies and organizations, or regularly checking reputable industry news sources and publications.
Methodology
Step 1 - Identification of Relevant Samples Size from Population Database


Step 2 - Approaches for Defining Global Market Size (Value, Volume* & Price*)

Note*: In applicable scenarios
Step 3 - Data Sources
Primary Research
- Web Analytics
- Survey Reports
- Research Institute
- Latest Research Reports
- Opinion Leaders
Secondary Research
- Annual Reports
- White Paper
- Latest Press Release
- Industry Association
- Paid Database
- Investor Presentations

Step 4 - Data Triangulation
Involves using different sources of information in order to increase the validity of a study
These sources are likely to be stakeholders in a program - participants, other researchers, program staff, other community members, and so on.
Then we put all data in single framework & apply various statistical tools to find out the dynamic on the market.
During the analysis stage, feedback from the stakeholder groups would be compared to determine areas of agreement as well as areas of divergence