

Key Insights
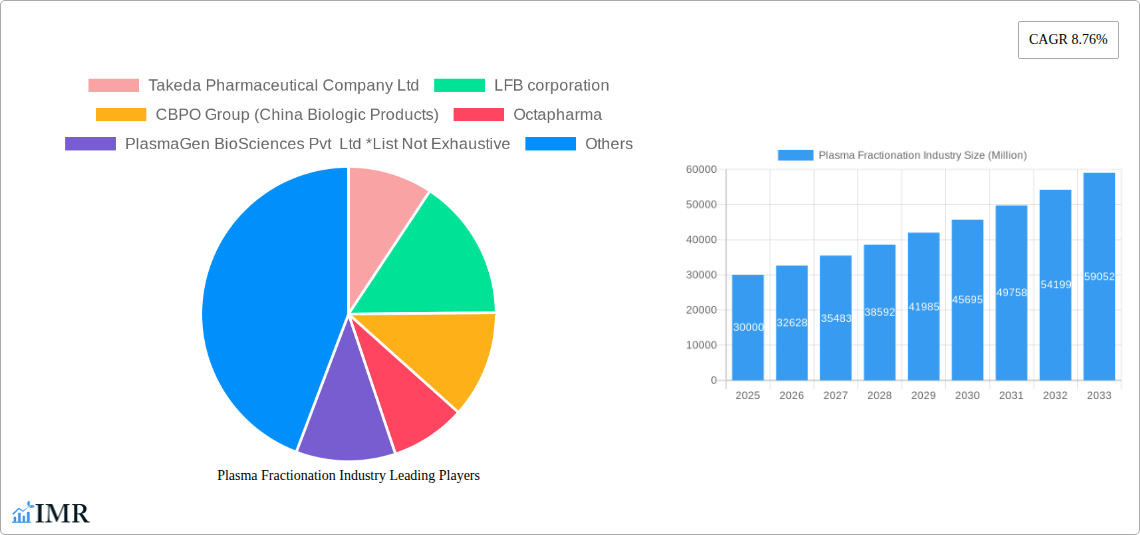
The global plasma fractionation market, estimated at $28.6 billion in the base year 2020, is projected for significant expansion. Driven by a compound annual growth rate (CAGR) of 7.2%, the market is poised to reach substantial value by 2033. This growth trajectory is primarily attributed to the increasing incidence of chronic diseases necessitating plasma-derived therapies, including immunodeficiencies and bleeding disorders. Technological innovations enhancing plasma fractionation techniques, leading to improved product purity and operational efficiency, are also key contributors. Furthermore, the growing demand for these therapies in emerging economies, supported by favorable government policies and escalating healthcare spending, is fueling market advancement. Segmentation analysis highlights immunoglobulins as the leading product category, with neurology and immunology applications dominating usage. Hospitals and clinics represent the largest end-user segment, underscoring the critical role of plasma-derived treatments in managing acute and chronic conditions. The competitive landscape is characterized by intense activity from major players such as Takeda Pharmaceutical Company Ltd and LFB corporation, who are consistently pursuing product innovation and market share expansion. Geographic growth is expected to be widespread, with North America and Europe maintaining strong market positions, while the Asia Pacific region is anticipated to experience considerable expansion due to improving healthcare infrastructure and rising disposable incomes.
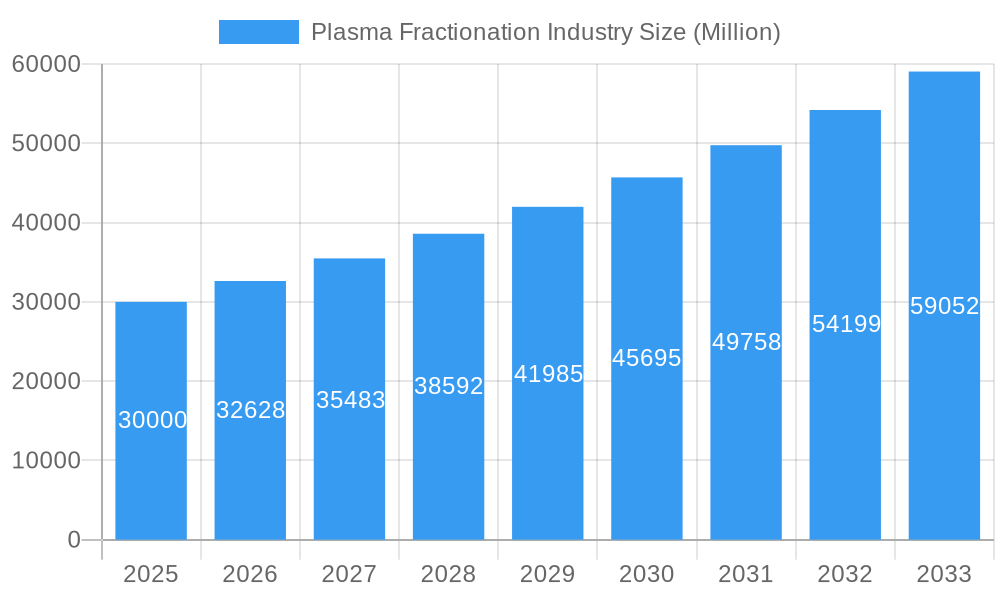
Plasma Fractionation Industry Market Size (In Billion)
Despite positive growth prospects, several factors present challenges to market expansion. These include the high production costs inherent in plasma fractionation, rigorous regulatory approval processes for new therapies, and the potential for adverse reactions linked to certain treatments. Additionally, reliance on plasma donations introduces supply chain vulnerabilities that can impact market stability. Future market expansion will depend on effectively addressing these challenges through enhanced production efficiencies, streamlined regulatory pathways, robust safety protocols, and collaborative strategies to ensure a consistent plasma supply. The ongoing development of innovative plasma-derived therapies with superior efficacy and safety profiles will remain a critical element in the market's evolution. The market is also likely to witness further consolidation through mergers and acquisitions as key companies seek to strengthen their competitive standing.
Plasma Fractionation Industry Company Market Share
Plasma Fractionation Industry Market Report: 2019-2033
This comprehensive report provides a detailed analysis of the global Plasma Fractionation industry, encompassing market dynamics, growth trends, competitive landscape, and future outlook. With a focus on key segments (By Product, By Application, By End-User) and a detailed examination of leading players like Takeda Pharmaceutical Company Ltd, LFB corporation, and Grifols S.A., this report is an invaluable resource for industry professionals, investors, and strategic decision-makers. The study period covers 2019-2033, with 2025 as the base and estimated year. The forecast period is 2025-2033, and the historical period is 2019-2024. The market size is presented in million units.
Plasma Fractionation Industry Market Dynamics & Structure
The Plasma Fractionation market is characterized by a moderately concentrated structure with a few large multinational corporations holding significant market share. Technological innovation, particularly in purification and downstream processing, is a key driver, alongside stringent regulatory frameworks governing safety and efficacy. The industry faces competition from synthetic alternatives for some products, although plasma-derived therapies remain crucial for many applications. End-user demographics, primarily focused on hospitals and clinics, are a major factor influencing market growth. Mergers and acquisitions (M&A) activity has been notable, with larger players consolidating their position.
- Market Concentration: Top 5 players account for approximately xx% of the global market (2024).
- Technological Innovation: Focus on automation, process intensification, and novel purification techniques.
- Regulatory Landscape: Stringent regulatory approvals impacting time to market and investment costs.
- Competitive Substitutes: Synthetic alternatives for some products create competitive pressure.
- M&A Activity: xx major M&A deals in the last 5 years, leading to consolidation.
- Innovation Barriers: High R&D costs, lengthy regulatory pathways, and complex manufacturing processes.
Plasma Fractionation Industry Growth Trends & Insights
The Plasma Fractionation market experienced steady growth during the historical period (2019-2024), driven by increasing prevalence of chronic diseases requiring plasma-derived therapies, expanding healthcare infrastructure in emerging economies, and technological advancements improving product efficacy and safety. The market is expected to continue its growth trajectory during the forecast period (2025-2033), with a Compound Annual Growth Rate (CAGR) estimated at xx%. This growth will be fueled by factors such as an aging global population, rising disposable incomes, and increasing awareness of plasma-derived therapies. Market penetration is expected to increase further, particularly in developing nations with growing healthcare expenditure.
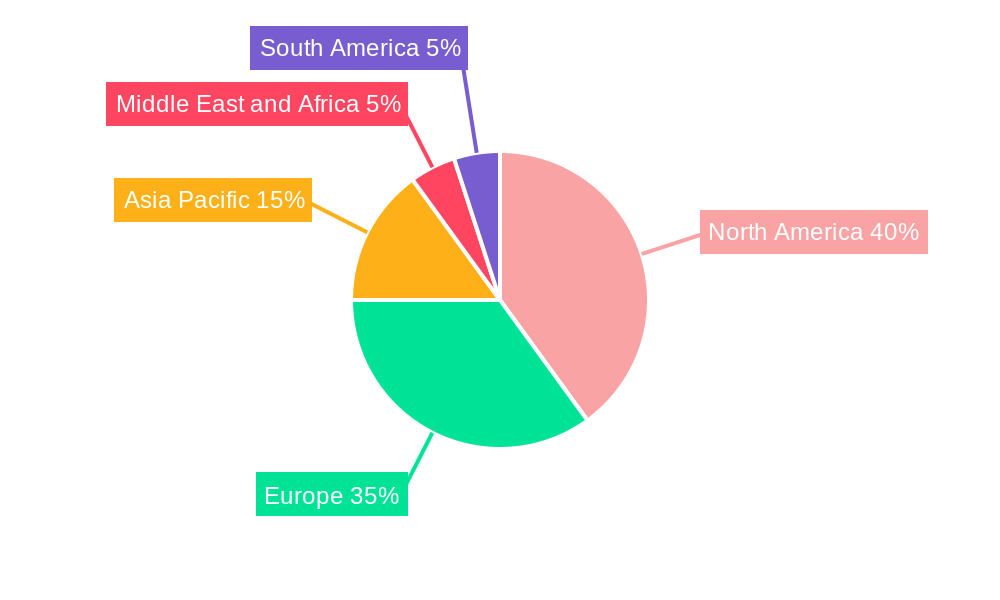
Dominant Regions, Countries, or Segments in Plasma Fractionation Industry
North America and Europe currently dominate the Plasma Fractionation market, driven by robust healthcare infrastructure, high prevalence of target diseases, and strong regulatory support. However, Asia-Pacific is expected to witness significant growth due to its expanding healthcare sector and rising disposable incomes.
By Product: Immunoglobulins represent the largest segment, followed by Albumin and Platelets and Coagulation Factor Concentrates.
- Immunoglobulins: High demand driven by the increasing prevalence of immune deficiencies.
- Albumin: Used in a variety of therapeutic applications, including trauma and shock management.
- Platelets and Coagulation Factor Concentrates: Essential for treating bleeding disorders and other hematological conditions.
- Other Products: Includes specialized products with niche applications.
By Application: Neurology and Immunology are major application areas, owing to their high prevalence and reliance on plasma-derived therapies.
- Neurology: Treatment of neurological disorders requiring plasma-derived therapies.
- Immunology: Treatment of immunodeficiencies and autoimmune diseases.
- Hematology: Use in treating bleeding disorders and other hematological conditions.
- Other Applications: Includes applications in other areas like surgery and critical care.
By End-User: Hospitals and Clinics are the primary end-users, followed by Clinical Research Laboratories.
- Hospitals and Clinics: Largest share owing to high patient volume and the clinical need for plasma therapies.
- Clinical Research Laboratories: Use in research and development of new plasma-derived therapies.
- Other End-Users: Includes blood banks and other specialized healthcare facilities.
Plasma Fractionation Industry Product Landscape
The Plasma Fractionation industry offers a wide range of products, including immunoglobulins, albumin, and coagulation factor concentrates, each tailored to specific therapeutic applications. Recent innovations have focused on improving purity, efficacy, and safety through advanced purification techniques, including chromatography and viral inactivation methods. Unique selling propositions include enhanced stability, reduced immunogenicity, and convenience of administration. Technological advancements have led to the development of novel formulations with extended shelf-life and improved patient outcomes.
Key Drivers, Barriers & Challenges in Plasma Fractionation Industry
Key Drivers: Rising prevalence of chronic diseases, growing geriatric population, technological advancements, and supportive government regulations are key drivers.
Challenges & Restraints: Stringent regulatory approvals, high R&D costs, dependence on plasma donations, and fluctuating plasma availability pose challenges. Supply chain disruptions can also impact production and market availability.
Emerging Opportunities in Plasma Fractionation Industry
Emerging markets in Asia and Africa present significant growth opportunities, driven by the rising prevalence of chronic diseases and the increasing adoption of plasma-derived therapies. Innovative applications in regenerative medicine and personalized medicine are also generating significant interest, along with the development of novel formulations with improved efficacy and safety.
Growth Accelerators in the Plasma Fractionation Industry
Strategic partnerships and collaborations between pharmaceutical companies and plasma collection centers are key growth accelerators, along with investments in automation and advanced purification technologies. Expansion into untapped markets and development of innovative products further enhance growth potential.
Key Players Shaping the Plasma Fractionation Industry Market
- Takeda Pharmaceutical Company Ltd
- LFB corporation
- CBPO Group (China Biologic Products)
- Octapharma
- PlasmaGen BioSciences Pvt Ltd
- Bio Products Laboratory
- GC Pharma
- Shanghai RAAS Blood Products
- Sanquin
- Grifols S.A
- CSL Behring
- Kedrion S.p.A
Notable Milestones in Plasma Fractionation Industry Sector
- September 2022: CSL Behring K.K. received manufacturing and marketing approval for Berinert S.C. Injection 2000 in Japan.
- October 2022: Grifols inaugurated a new albumin purification and filling plant in Dublin, Ireland.
In-Depth Plasma Fractionation Industry Market Outlook
The Plasma Fractionation market is poised for continued growth driven by technological innovation, strategic partnerships, and expanding global healthcare infrastructure. Opportunities exist in developing novel therapies, improving manufacturing efficiency, and expanding into underserved markets. Companies that invest in R&D, embrace automation, and build robust supply chains are well-positioned to capture significant market share in the coming years.
Plasma Fractionation Industry Segmentation
-
1. Product
- 1.1. Immunoglobulins
- 1.2. Platelets and Coagulation Factor Concentrates
- 1.3. Albumin
- 1.4. Other Products
-
2. Application
- 2.1. Neurology
- 2.2. Immunology
- 2.3. Hematology
- 2.4. Other Applications
-
3. End-User
- 3.1. Hospitals and Clinics
- 3.2. Clinical Research Laboratories
- 3.3. Other End-Users
Plasma Fractionation Industry Segmentation By Geography
-
1. North America
- 1.1. United States
- 1.2. Canada
- 1.3. Mexico
-
2. Europe
- 2.1. Germany
- 2.2. United Kingdom
- 2.3. France
- 2.4. Italy
- 2.5. Spain
- 2.6. Rest of Europe
-
3. Asia Pacific
- 3.1. China
- 3.2. Japan
- 3.3. India
- 3.4. Australia
- 3.5. South Korea
- 3.6. Rest of Asia Pacific
-
4. Middle East and Africa
- 4.1. GCC
- 4.2. South Africa
- 4.3. Rest of Middle East and Africa
-
5. South America
- 5.1. Brazil
- 5.2. Argentina
- 5.3. Rest of South America
Plasma Fractionation Industry Regional Market Share
Geographic Coverage of Plasma Fractionation Industry
Plasma Fractionation Industry REPORT HIGHLIGHTS
| Aspects | Details |
|---|---|
| Study Period | 2020-2034 |
| Base Year | 2025 |
| Estimated Year | 2026 |
| Forecast Period | 2026-2034 |
| Historical Period | 2020-2025 |
| Growth Rate | CAGR of 7.2% from 2020-2034 |
| Segmentation |
|
Table of Contents
- 1. Introduction
- 1.1. Research Scope
- 1.2. Market Segmentation
- 1.3. Research Objective
- 1.4. Definitions and Assumptions
- 2. Executive Summary
- 2.1. Market Snapshot
- 3. Market Dynamics
- 3.1. Market Drivers
- 3.2. Market Restrains
- 3.3. Market Trends
- 3.4. Market Opportunities
- 4. Market Factor Analysis
- 4.1. Porters Five Forces
- 4.1.1. Bargaining Power of Suppliers
- 4.1.2. Bargaining Power of Buyers
- 4.1.3. Threat of New Entrants
- 4.1.4. Threat of Substitutes
- 4.1.5. Competitive Rivalry
- 4.2. PESTEL analysis
- 4.3. BCG Analysis
- 4.3.1. Stars (High Growth, High Market Share)
- 4.3.2. Cash Cows (Low Growth, High Market Share)
- 4.3.3. Question Mark (High Growth, Low Market Share)
- 4.3.4. Dogs (Low Growth, Low Market Share)
- 4.4. Ansoff Matrix Analysis
- 4.5. Supply Chain Analysis
- 4.6. Regulatory Landscape
- 4.7. Current Market Potential and Opportunity Assessment (TAM–SAM–SOM Framework)
- 4.8. IMR Analyst Note
- 4.1. Porters Five Forces
- 5. Market Analysis, Insights and Forecast 2021-2033
- 5.1. Market Analysis, Insights and Forecast - by Product
- 5.1.1. Immunoglobulins
- 5.1.2. Platelets and Coagulation Factor Concentrates
- 5.1.3. Albumin
- 5.1.4. Other Products
- 5.2. Market Analysis, Insights and Forecast - by Application
- 5.2.1. Neurology
- 5.2.2. Immunology
- 5.2.3. Hematology
- 5.2.4. Other Applications
- 5.3. Market Analysis, Insights and Forecast - by End-User
- 5.3.1. Hospitals and Clinics
- 5.3.2. Clinical Research Laboratories
- 5.3.3. Other End-Users
- 5.4. Market Analysis, Insights and Forecast - by Region
- 5.4.1. North America
- 5.4.2. Europe
- 5.4.3. Asia Pacific
- 5.4.4. Middle East and Africa
- 5.4.5. South America
- 5.1. Market Analysis, Insights and Forecast - by Product
- 6. Global Plasma Fractionation Industry Analysis, Insights and Forecast, 2021-2033
- 6.1. Market Analysis, Insights and Forecast - by Product
- 6.1.1. Immunoglobulins
- 6.1.2. Platelets and Coagulation Factor Concentrates
- 6.1.3. Albumin
- 6.1.4. Other Products
- 6.2. Market Analysis, Insights and Forecast - by Application
- 6.2.1. Neurology
- 6.2.2. Immunology
- 6.2.3. Hematology
- 6.2.4. Other Applications
- 6.3. Market Analysis, Insights and Forecast - by End-User
- 6.3.1. Hospitals and Clinics
- 6.3.2. Clinical Research Laboratories
- 6.3.3. Other End-Users
- 6.1. Market Analysis, Insights and Forecast - by Product
- 7. North America Plasma Fractionation Industry Analysis, Insights and Forecast, 2020-2032
- 7.1. Market Analysis, Insights and Forecast - by Product
- 7.1.1. Immunoglobulins
- 7.1.2. Platelets and Coagulation Factor Concentrates
- 7.1.3. Albumin
- 7.1.4. Other Products
- 7.2. Market Analysis, Insights and Forecast - by Application
- 7.2.1. Neurology
- 7.2.2. Immunology
- 7.2.3. Hematology
- 7.2.4. Other Applications
- 7.3. Market Analysis, Insights and Forecast - by End-User
- 7.3.1. Hospitals and Clinics
- 7.3.2. Clinical Research Laboratories
- 7.3.3. Other End-Users
- 7.1. Market Analysis, Insights and Forecast - by Product
- 8. Europe Plasma Fractionation Industry Analysis, Insights and Forecast, 2020-2032
- 8.1. Market Analysis, Insights and Forecast - by Product
- 8.1.1. Immunoglobulins
- 8.1.2. Platelets and Coagulation Factor Concentrates
- 8.1.3. Albumin
- 8.1.4. Other Products
- 8.2. Market Analysis, Insights and Forecast - by Application
- 8.2.1. Neurology
- 8.2.2. Immunology
- 8.2.3. Hematology
- 8.2.4. Other Applications
- 8.3. Market Analysis, Insights and Forecast - by End-User
- 8.3.1. Hospitals and Clinics
- 8.3.2. Clinical Research Laboratories
- 8.3.3. Other End-Users
- 8.1. Market Analysis, Insights and Forecast - by Product
- 9. Asia Pacific Plasma Fractionation Industry Analysis, Insights and Forecast, 2020-2032
- 9.1. Market Analysis, Insights and Forecast - by Product
- 9.1.1. Immunoglobulins
- 9.1.2. Platelets and Coagulation Factor Concentrates
- 9.1.3. Albumin
- 9.1.4. Other Products
- 9.2. Market Analysis, Insights and Forecast - by Application
- 9.2.1. Neurology
- 9.2.2. Immunology
- 9.2.3. Hematology
- 9.2.4. Other Applications
- 9.3. Market Analysis, Insights and Forecast - by End-User
- 9.3.1. Hospitals and Clinics
- 9.3.2. Clinical Research Laboratories
- 9.3.3. Other End-Users
- 9.1. Market Analysis, Insights and Forecast - by Product
- 10. Middle East and Africa Plasma Fractionation Industry Analysis, Insights and Forecast, 2020-2032
- 10.1. Market Analysis, Insights and Forecast - by Product
- 10.1.1. Immunoglobulins
- 10.1.2. Platelets and Coagulation Factor Concentrates
- 10.1.3. Albumin
- 10.1.4. Other Products
- 10.2. Market Analysis, Insights and Forecast - by Application
- 10.2.1. Neurology
- 10.2.2. Immunology
- 10.2.3. Hematology
- 10.2.4. Other Applications
- 10.3. Market Analysis, Insights and Forecast - by End-User
- 10.3.1. Hospitals and Clinics
- 10.3.2. Clinical Research Laboratories
- 10.3.3. Other End-Users
- 10.1. Market Analysis, Insights and Forecast - by Product
- 11. South America Plasma Fractionation Industry Analysis, Insights and Forecast, 2020-2032
- 11.1. Market Analysis, Insights and Forecast - by Product
- 11.1.1. Immunoglobulins
- 11.1.2. Platelets and Coagulation Factor Concentrates
- 11.1.3. Albumin
- 11.1.4. Other Products
- 11.2. Market Analysis, Insights and Forecast - by Application
- 11.2.1. Neurology
- 11.2.2. Immunology
- 11.2.3. Hematology
- 11.2.4. Other Applications
- 11.3. Market Analysis, Insights and Forecast - by End-User
- 11.3.1. Hospitals and Clinics
- 11.3.2. Clinical Research Laboratories
- 11.3.3. Other End-Users
- 11.1. Market Analysis, Insights and Forecast - by Product
- 12. Competitive Analysis
- 12.1. Company Profiles
- 12.1.1 Takeda Pharmaceutical Company Ltd
- 12.1.1.1. Company Overview
- 12.1.1.2. Products
- 12.1.1.3. Company Financials
- 12.1.1.4. SWOT Analysis
- 12.1.2 LFB corporation
- 12.1.2.1. Company Overview
- 12.1.2.2. Products
- 12.1.2.3. Company Financials
- 12.1.2.4. SWOT Analysis
- 12.1.3 CBPO Group (China Biologic Products)
- 12.1.3.1. Company Overview
- 12.1.3.2. Products
- 12.1.3.3. Company Financials
- 12.1.3.4. SWOT Analysis
- 12.1.4 Octapharma
- 12.1.4.1. Company Overview
- 12.1.4.2. Products
- 12.1.4.3. Company Financials
- 12.1.4.4. SWOT Analysis
- 12.1.5 PlasmaGen BioSciences Pvt Ltd *List Not Exhaustive
- 12.1.5.1. Company Overview
- 12.1.5.2. Products
- 12.1.5.3. Company Financials
- 12.1.5.4. SWOT Analysis
- 12.1.6 Bio Products Laboratory
- 12.1.6.1. Company Overview
- 12.1.6.2. Products
- 12.1.6.3. Company Financials
- 12.1.6.4. SWOT Analysis
- 12.1.7 GC Pharma
- 12.1.7.1. Company Overview
- 12.1.7.2. Products
- 12.1.7.3. Company Financials
- 12.1.7.4. SWOT Analysis
- 12.1.8 Shanghai RAAS Blood Products
- 12.1.8.1. Company Overview
- 12.1.8.2. Products
- 12.1.8.3. Company Financials
- 12.1.8.4. SWOT Analysis
- 12.1.9 Sanquin
- 12.1.9.1. Company Overview
- 12.1.9.2. Products
- 12.1.9.3. Company Financials
- 12.1.9.4. SWOT Analysis
- 12.1.10 Grifols S A
- 12.1.10.1. Company Overview
- 12.1.10.2. Products
- 12.1.10.3. Company Financials
- 12.1.10.4. SWOT Analysis
- 12.1.11 CSL Behring
- 12.1.11.1. Company Overview
- 12.1.11.2. Products
- 12.1.11.3. Company Financials
- 12.1.11.4. SWOT Analysis
- 12.1.12 Kedrion S p A
- 12.1.12.1. Company Overview
- 12.1.12.2. Products
- 12.1.12.3. Company Financials
- 12.1.12.4. SWOT Analysis
- 12.1.1 Takeda Pharmaceutical Company Ltd
- 12.2. Market Entropy
- 12.2.1 Company's Key Areas Served
- 12.2.2 Recent Developments
- 12.3. Company Market Share Analysis 2025
- 12.3.1 Top 5 Companies Market Share Analysis
- 12.3.2 Top 3 Companies Market Share Analysis
- 12.4. List of Potential Customers
- 13. Research Methodology
List of Figures
- Figure 1: Global Plasma Fractionation Industry Revenue Breakdown (billion, %) by Region 2025 & 2033
- Figure 2: North America Plasma Fractionation Industry Revenue (billion), by Product 2025 & 2033
- Figure 3: North America Plasma Fractionation Industry Revenue Share (%), by Product 2025 & 2033
- Figure 4: North America Plasma Fractionation Industry Revenue (billion), by Application 2025 & 2033
- Figure 5: North America Plasma Fractionation Industry Revenue Share (%), by Application 2025 & 2033
- Figure 6: North America Plasma Fractionation Industry Revenue (billion), by End-User 2025 & 2033
- Figure 7: North America Plasma Fractionation Industry Revenue Share (%), by End-User 2025 & 2033
- Figure 8: North America Plasma Fractionation Industry Revenue (billion), by Country 2025 & 2033
- Figure 9: North America Plasma Fractionation Industry Revenue Share (%), by Country 2025 & 2033
- Figure 10: Europe Plasma Fractionation Industry Revenue (billion), by Product 2025 & 2033
- Figure 11: Europe Plasma Fractionation Industry Revenue Share (%), by Product 2025 & 2033
- Figure 12: Europe Plasma Fractionation Industry Revenue (billion), by Application 2025 & 2033
- Figure 13: Europe Plasma Fractionation Industry Revenue Share (%), by Application 2025 & 2033
- Figure 14: Europe Plasma Fractionation Industry Revenue (billion), by End-User 2025 & 2033
- Figure 15: Europe Plasma Fractionation Industry Revenue Share (%), by End-User 2025 & 2033
- Figure 16: Europe Plasma Fractionation Industry Revenue (billion), by Country 2025 & 2033
- Figure 17: Europe Plasma Fractionation Industry Revenue Share (%), by Country 2025 & 2033
- Figure 18: Asia Pacific Plasma Fractionation Industry Revenue (billion), by Product 2025 & 2033
- Figure 19: Asia Pacific Plasma Fractionation Industry Revenue Share (%), by Product 2025 & 2033
- Figure 20: Asia Pacific Plasma Fractionation Industry Revenue (billion), by Application 2025 & 2033
- Figure 21: Asia Pacific Plasma Fractionation Industry Revenue Share (%), by Application 2025 & 2033
- Figure 22: Asia Pacific Plasma Fractionation Industry Revenue (billion), by End-User 2025 & 2033
- Figure 23: Asia Pacific Plasma Fractionation Industry Revenue Share (%), by End-User 2025 & 2033
- Figure 24: Asia Pacific Plasma Fractionation Industry Revenue (billion), by Country 2025 & 2033
- Figure 25: Asia Pacific Plasma Fractionation Industry Revenue Share (%), by Country 2025 & 2033
- Figure 26: Middle East and Africa Plasma Fractionation Industry Revenue (billion), by Product 2025 & 2033
- Figure 27: Middle East and Africa Plasma Fractionation Industry Revenue Share (%), by Product 2025 & 2033
- Figure 28: Middle East and Africa Plasma Fractionation Industry Revenue (billion), by Application 2025 & 2033
- Figure 29: Middle East and Africa Plasma Fractionation Industry Revenue Share (%), by Application 2025 & 2033
- Figure 30: Middle East and Africa Plasma Fractionation Industry Revenue (billion), by End-User 2025 & 2033
- Figure 31: Middle East and Africa Plasma Fractionation Industry Revenue Share (%), by End-User 2025 & 2033
- Figure 32: Middle East and Africa Plasma Fractionation Industry Revenue (billion), by Country 2025 & 2033
- Figure 33: Middle East and Africa Plasma Fractionation Industry Revenue Share (%), by Country 2025 & 2033
- Figure 34: South America Plasma Fractionation Industry Revenue (billion), by Product 2025 & 2033
- Figure 35: South America Plasma Fractionation Industry Revenue Share (%), by Product 2025 & 2033
- Figure 36: South America Plasma Fractionation Industry Revenue (billion), by Application 2025 & 2033
- Figure 37: South America Plasma Fractionation Industry Revenue Share (%), by Application 2025 & 2033
- Figure 38: South America Plasma Fractionation Industry Revenue (billion), by End-User 2025 & 2033
- Figure 39: South America Plasma Fractionation Industry Revenue Share (%), by End-User 2025 & 2033
- Figure 40: South America Plasma Fractionation Industry Revenue (billion), by Country 2025 & 2033
- Figure 41: South America Plasma Fractionation Industry Revenue Share (%), by Country 2025 & 2033
List of Tables
- Table 1: Global Plasma Fractionation Industry Revenue billion Forecast, by Product 2020 & 2033
- Table 2: Global Plasma Fractionation Industry Revenue billion Forecast, by Application 2020 & 2033
- Table 3: Global Plasma Fractionation Industry Revenue billion Forecast, by End-User 2020 & 2033
- Table 4: Global Plasma Fractionation Industry Revenue billion Forecast, by Region 2020 & 2033
- Table 5: Global Plasma Fractionation Industry Revenue billion Forecast, by Product 2020 & 2033
- Table 6: Global Plasma Fractionation Industry Revenue billion Forecast, by Application 2020 & 2033
- Table 7: Global Plasma Fractionation Industry Revenue billion Forecast, by End-User 2020 & 2033
- Table 8: Global Plasma Fractionation Industry Revenue billion Forecast, by Country 2020 & 2033
- Table 9: United States Plasma Fractionation Industry Revenue (billion) Forecast, by Application 2020 & 2033
- Table 10: Canada Plasma Fractionation Industry Revenue (billion) Forecast, by Application 2020 & 2033
- Table 11: Mexico Plasma Fractionation Industry Revenue (billion) Forecast, by Application 2020 & 2033
- Table 12: Global Plasma Fractionation Industry Revenue billion Forecast, by Product 2020 & 2033
- Table 13: Global Plasma Fractionation Industry Revenue billion Forecast, by Application 2020 & 2033
- Table 14: Global Plasma Fractionation Industry Revenue billion Forecast, by End-User 2020 & 2033
- Table 15: Global Plasma Fractionation Industry Revenue billion Forecast, by Country 2020 & 2033
- Table 16: Germany Plasma Fractionation Industry Revenue (billion) Forecast, by Application 2020 & 2033
- Table 17: United Kingdom Plasma Fractionation Industry Revenue (billion) Forecast, by Application 2020 & 2033
- Table 18: France Plasma Fractionation Industry Revenue (billion) Forecast, by Application 2020 & 2033
- Table 19: Italy Plasma Fractionation Industry Revenue (billion) Forecast, by Application 2020 & 2033
- Table 20: Spain Plasma Fractionation Industry Revenue (billion) Forecast, by Application 2020 & 2033
- Table 21: Rest of Europe Plasma Fractionation Industry Revenue (billion) Forecast, by Application 2020 & 2033
- Table 22: Global Plasma Fractionation Industry Revenue billion Forecast, by Product 2020 & 2033
- Table 23: Global Plasma Fractionation Industry Revenue billion Forecast, by Application 2020 & 2033
- Table 24: Global Plasma Fractionation Industry Revenue billion Forecast, by End-User 2020 & 2033
- Table 25: Global Plasma Fractionation Industry Revenue billion Forecast, by Country 2020 & 2033
- Table 26: China Plasma Fractionation Industry Revenue (billion) Forecast, by Application 2020 & 2033
- Table 27: Japan Plasma Fractionation Industry Revenue (billion) Forecast, by Application 2020 & 2033
- Table 28: India Plasma Fractionation Industry Revenue (billion) Forecast, by Application 2020 & 2033
- Table 29: Australia Plasma Fractionation Industry Revenue (billion) Forecast, by Application 2020 & 2033
- Table 30: South Korea Plasma Fractionation Industry Revenue (billion) Forecast, by Application 2020 & 2033
- Table 31: Rest of Asia Pacific Plasma Fractionation Industry Revenue (billion) Forecast, by Application 2020 & 2033
- Table 32: Global Plasma Fractionation Industry Revenue billion Forecast, by Product 2020 & 2033
- Table 33: Global Plasma Fractionation Industry Revenue billion Forecast, by Application 2020 & 2033
- Table 34: Global Plasma Fractionation Industry Revenue billion Forecast, by End-User 2020 & 2033
- Table 35: Global Plasma Fractionation Industry Revenue billion Forecast, by Country 2020 & 2033
- Table 36: GCC Plasma Fractionation Industry Revenue (billion) Forecast, by Application 2020 & 2033
- Table 37: South Africa Plasma Fractionation Industry Revenue (billion) Forecast, by Application 2020 & 2033
- Table 38: Rest of Middle East and Africa Plasma Fractionation Industry Revenue (billion) Forecast, by Application 2020 & 2033
- Table 39: Global Plasma Fractionation Industry Revenue billion Forecast, by Product 2020 & 2033
- Table 40: Global Plasma Fractionation Industry Revenue billion Forecast, by Application 2020 & 2033
- Table 41: Global Plasma Fractionation Industry Revenue billion Forecast, by End-User 2020 & 2033
- Table 42: Global Plasma Fractionation Industry Revenue billion Forecast, by Country 2020 & 2033
- Table 43: Brazil Plasma Fractionation Industry Revenue (billion) Forecast, by Application 2020 & 2033
- Table 44: Argentina Plasma Fractionation Industry Revenue (billion) Forecast, by Application 2020 & 2033
- Table 45: Rest of South America Plasma Fractionation Industry Revenue (billion) Forecast, by Application 2020 & 2033
Frequently Asked Questions
1. What is the projected Compound Annual Growth Rate (CAGR) of the Plasma Fractionation Industry?
The projected CAGR is approximately 7.2%.
2. Which companies are prominent players in the Plasma Fractionation Industry?
Key companies in the market include Takeda Pharmaceutical Company Ltd, LFB corporation, CBPO Group (China Biologic Products), Octapharma, PlasmaGen BioSciences Pvt Ltd *List Not Exhaustive, Bio Products Laboratory, GC Pharma, Shanghai RAAS Blood Products, Sanquin, Grifols S A, CSL Behring, Kedrion S p A.
3. What are the main segments of the Plasma Fractionation Industry?
The market segments include Product, Application, End-User.
4. Can you provide details about the market size?
The market size is estimated to be USD 28.6 billion as of 2022.
5. What are some drivers contributing to market growth?
Growing Use of Immunoglobulins in Various Therapeutic Areas; Rising Geriatric Population coupled with Rise in Prevalence of Rare Diseases; Increasing Number of Plasma Collection Centers across the Globe.
6. What are the notable trends driving market growth?
Immunoglobulin Shows Lucrative Growth Opportunity in the Plasma Fractionation Market Over The Forecast Period.
7. Are there any restraints impacting market growth?
Strict Regulations For the Handling of Plasma Protein Products; Emergence of Recombinant Alternatives; High Cost and Limited Reimbursement.
8. Can you provide examples of recent developments in the market?
October 2022- Grifols inaugurated a new albumin purification and filling plant at its global manufacturing and supply hub in Dublin, Ireland.
9. What pricing options are available for accessing the report?
Pricing options include single-user, multi-user, and enterprise licenses priced at USD 4750, USD 5250, and USD 8750 respectively.
10. Is the market size provided in terms of value or volume?
The market size is provided in terms of value, measured in billion.
11. Are there any specific market keywords associated with the report?
Yes, the market keyword associated with the report is "Plasma Fractionation Industry," which aids in identifying and referencing the specific market segment covered.
12. How do I determine which pricing option suits my needs best?
The pricing options vary based on user requirements and access needs. Individual users may opt for single-user licenses, while businesses requiring broader access may choose multi-user or enterprise licenses for cost-effective access to the report.
13. Are there any additional resources or data provided in the Plasma Fractionation Industry report?
While the report offers comprehensive insights, it's advisable to review the specific contents or supplementary materials provided to ascertain if additional resources or data are available.
14. How can I stay updated on further developments or reports in the Plasma Fractionation Industry?
To stay informed about further developments, trends, and reports in the Plasma Fractionation Industry, consider subscribing to industry newsletters, following relevant companies and organizations, or regularly checking reputable industry news sources and publications.
Methodology
Step 1 - Identification of Relevant Samples Size from Population Database


Step 2 - Approaches for Defining Global Market Size (Value, Volume* & Price*)

Note*: In applicable scenarios
Step 3 - Data Sources
Primary Research
- Web Analytics
- Survey Reports
- Research Institute
- Latest Research Reports
- Opinion Leaders
Secondary Research
- Annual Reports
- White Paper
- Latest Press Release
- Industry Association
- Paid Database
- Investor Presentations

Step 4 - Data Triangulation
Involves using different sources of information in order to increase the validity of a study
These sources are likely to be stakeholders in a program - participants, other researchers, program staff, other community members, and so on.
Then we put all data in single framework & apply various statistical tools to find out the dynamic on the market.
During the analysis stage, feedback from the stakeholder groups would be compared to determine areas of agreement as well as areas of divergence