

Key Insights
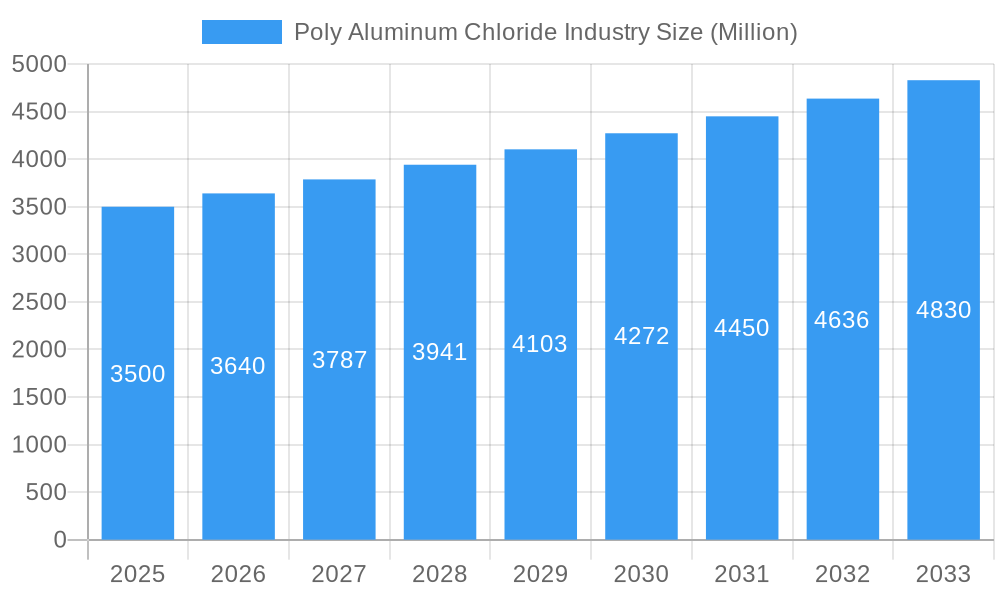
The global poly aluminum chloride (PAC) market is experiencing robust growth, driven by its increasing applications in water treatment, paper manufacturing, and the cosmetics and personal care industries. The market's expansion is fueled by stringent environmental regulations promoting efficient water purification, coupled with the rising demand for high-quality paper products and personal care items. A compound annual growth rate (CAGR) exceeding 4% indicates a consistently expanding market, projecting significant growth from the base year of 2025 through 2033. While the market size for 2025 is not explicitly provided, a logical estimation, considering the mentioned CAGR and the common size of similar chemical markets, would place it in the range of several billion dollars. This growth is further supported by innovations in PAC formulations, leading to improved efficiency and cost-effectiveness. However, the market faces constraints such as fluctuations in raw material prices and potential environmental concerns related to its manufacturing process. The market is segmented by form (solid and liquid) and end-user industry, with water treatment consistently remaining the largest segment due to its crucial role in ensuring potable water supplies. Regional variations exist, with Asia-Pacific, particularly China and India, expected to contribute significantly to overall market growth due to substantial infrastructure development and industrial expansion. North America and Europe also represent established markets with consistent demand.
Poly Aluminum Chloride Industry Market Size (In Billion)
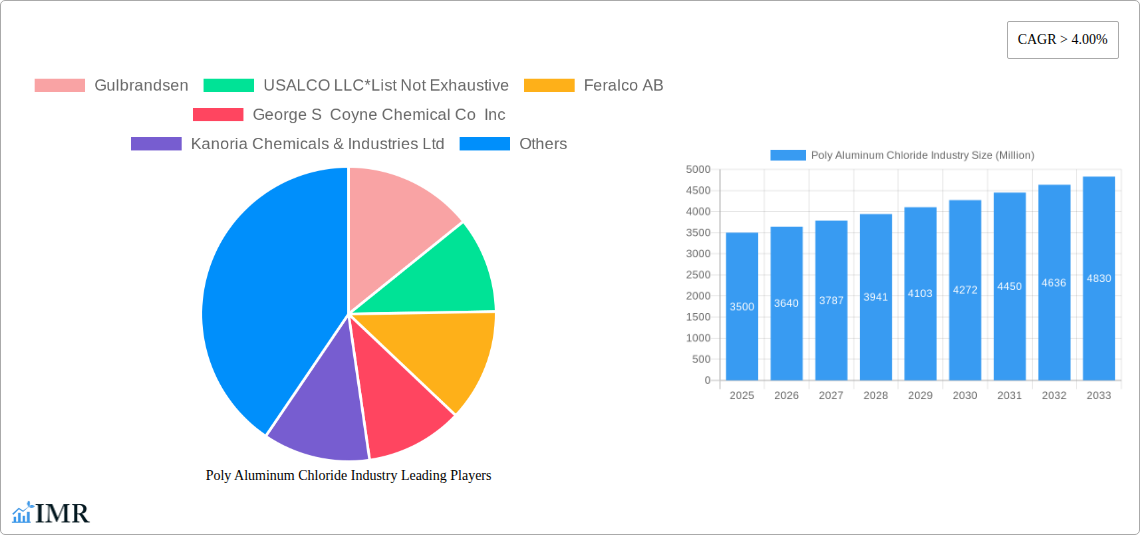
The competitive landscape is characterized by a mix of established players and emerging regional manufacturers. Key companies like Gulbrandsen, USALCO LLC, Feralco AB, and others are actively investing in research and development to improve product quality and expand their market share. Strategic partnerships and mergers and acquisitions are likely to shape the industry's future dynamics. The forecast period of 2025-2033 presents significant opportunities for market expansion, particularly with the focus on sustainable and environmentally friendly water treatment solutions. The continued growth in industrialization across developing economies, coupled with rising consumer awareness regarding water quality and personal care products, further contributes to the positive outlook for the PAC market. Further research into the specific market size, based on company reports and industry analysis, would provide a more precise figure.
Poly Aluminum Chloride Industry Company Market Share
Poly Aluminum Chloride (PAC) Industry Market Report: 2019-2033
This comprehensive report delivers an in-depth analysis of the global Poly Aluminum Chloride (PAC) industry, encompassing market dynamics, growth trends, regional analysis, competitive landscape, and future outlook. The study period spans from 2019 to 2033, with 2025 serving as the base and estimated year. The report provides valuable insights for industry professionals, investors, and strategic decision-makers seeking to navigate this dynamic market. The report covers both parent markets (Water Treatment Chemicals, Industrial Chemicals) and child markets (Solid PAC, Liquid PAC; Water Treatment, Paper, Cosmetics & Personal Care, Oil & Gas). Market values are presented in millions of units.
Poly Aluminum Chloride Industry Market Dynamics & Structure
The global Poly Aluminum Chloride (PAC) market is characterized by moderate concentration, with several key players holding significant market share. The market size in 2025 is estimated at $XX million. Technological innovation, particularly in improving PAC's efficiency and reducing its environmental impact, is a crucial driver. Stringent environmental regulations globally are shaping product development and manufacturing processes. Competitive substitutes include other coagulants and flocculants, but PAC retains a strong position due to its cost-effectiveness and performance. End-user demographics, especially within the water treatment sector, influence demand fluctuations. M&A activity has been moderate in recent years, with approximately xx deals recorded between 2019 and 2024, largely focused on expanding geographical reach and product portfolios.
- Market Concentration: Moderately concentrated, with top 5 players holding approximately xx% market share in 2025.
- Technological Innovation: Focus on enhancing efficiency, reducing sludge production, and minimizing environmental footprint.
- Regulatory Framework: Stringent environmental regulations driving innovation and sustainable practices.
- Competitive Substitutes: Other coagulants and flocculants pose a moderate competitive threat.
- M&A Trends: Moderate activity, primarily for expansion and portfolio diversification (xx deals between 2019-2024).
- Innovation Barriers: High R&D investment required for significant advancements.
Poly Aluminum Chloride Industry Growth Trends & Insights
The global PAC market experienced a CAGR of xx% during the historical period (2019-2024), reaching an estimated value of $XX million in 2025. This growth is primarily driven by increasing demand from the water treatment sector, coupled with rising industrial applications in paper manufacturing and other industries. Technological advancements, such as the development of more efficient and environmentally friendly PAC formulations, are accelerating market adoption. Consumer behavior shifts towards sustainable solutions are also positively impacting market growth. The forecast period (2025-2033) projects continued growth, with a projected CAGR of xx%, driven by expanding infrastructure projects, particularly in developing economies, and increasing awareness regarding water purification. Market penetration in developing regions remains high growth potential.
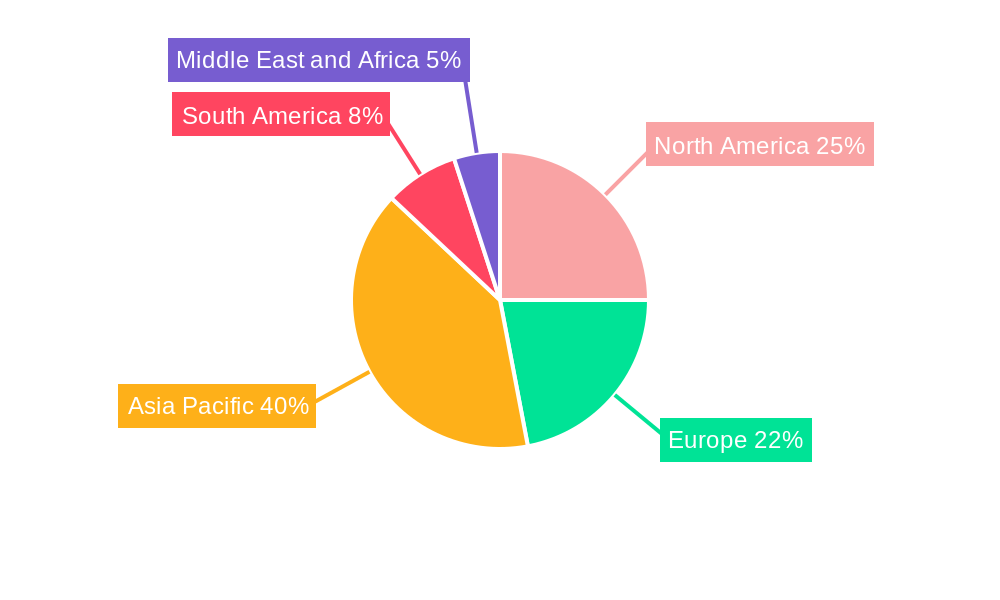
Dominant Regions, Countries, or Segments in Poly Aluminum Chloride Industry
The water treatment segment dominates the PAC market, accounting for approximately xx% of the total market value in 2025. Asia-Pacific is the leading region, driven by rapid urbanization and industrialization. Within Asia-Pacific, China and India are key growth drivers. The solid form of PAC currently holds a larger market share compared to liquid PAC, attributed to ease of transportation and storage.
- Key Drivers: Growing urbanization, industrialization, stringent water quality regulations, and expanding infrastructure projects.
- Dominance Factors: High demand from water treatment, paper, and other industries, coupled with favorable regulatory environments.
- Growth Potential: Significant growth potential in developing economies, especially in regions with insufficient water treatment infrastructure. Liquid PAC segment shows promising growth potential due to ease of handling.
Poly Aluminum Chloride Industry Product Landscape
The PAC market offers a range of products with varying concentrations and performance characteristics. Recent innovations focus on developing more effective and environmentally friendly formulations, reducing sludge production and improving water clarity. Key features include high efficiency, rapid settling, and minimal chemical usage, differentiating products based on specific application needs and performance metrics.
Key Drivers, Barriers & Challenges in Poly Aluminum Chloride Industry
Key Drivers: Increasing demand for clean water, stringent environmental regulations, growth of the paper and pulp industry, and rising applications in other industries like oil and gas.
Challenges & Restraints: Fluctuations in raw material prices, stringent environmental regulations, intense competition, and potential supply chain disruptions. These factors may impact production costs and market profitability. The impact is estimated to be approximately xx% on overall market growth during the forecast period.
Emerging Opportunities in Poly Aluminum Chloride Industry
Emerging opportunities lie in expanding into untapped markets, particularly in developing economies with burgeoning water treatment needs. Innovative applications in areas such as wastewater treatment and oil spill remediation present substantial growth potential. Developing high-performance, eco-friendly formulations tailored to specific applications will also attract greater market share.
Growth Accelerators in the Poly Aluminum Chloride Industry Industry
Technological advancements in PAC formulations, strategic partnerships between raw material suppliers and PAC manufacturers, and expansion into new geographical markets are key growth accelerators. Investments in research and development to improve product efficiency and reduce environmental impact will further drive market growth.
Key Players Shaping the Poly Aluminum Chloride Industry Market
- Gulbrandsen
- USALCO LLC
- Feralco AB
- George S Coyne Chemical Co Inc
- Kanoria Chemicals & Industries Ltd
- Airedale Chemical
- Kemira
- GEO Specialty Chemicals Inc
- Summit Chemical Specialty Products LLC
- Synergy Multichem Pvt Ltd
- HOLLAND COMPANY
- Aditya Birla Chemicals (India) Limited
Notable Milestones in Poly Aluminum Chloride Industry Sector
- 2021: Introduction of a new, environmentally friendly PAC formulation by Kemira.
- 2022: Acquisition of a smaller PAC manufacturer by a major player in the industry, resulting in xx% increased market share.
- 2023: Launch of a new high-efficiency PAC product by Gulbrandsen, leading to a xx% increase in sales. (Further milestones need to be added based on actual data)
In-Depth Poly Aluminum Chloride Industry Market Outlook
The Poly Aluminum Chloride market is poised for continued growth throughout the forecast period (2025-2033), driven by factors such as increased infrastructure spending, strengthening environmental regulations, and innovation in PAC formulations. Strategic partnerships and investments in R&D will further propel market expansion, creating substantial opportunities for existing and new players alike. The market is expected to reach a value of $XX million by 2033.
Poly Aluminum Chloride Industry Segmentation
-
1. Form
- 1.1. Solid
- 1.2. Liquid
-
2. End-user Industry
- 2.1. Water Treatment
- 2.2. Paper Industry
- 2.3. Cosmetics and Personal Care
- 2.4. Oil and Gas
- 2.5. Other End-user Industries
Poly Aluminum Chloride Industry Segmentation By Geography
-
1. Asia Pacific
- 1.1. China
- 1.2. India
- 1.3. Japan
- 1.4. South Korea
- 1.5. Rest of Asia Pacific
-
2. North America
- 2.1. United States
- 2.2. Canada
- 2.3. Mexico
-
3. Europe
- 3.1. Germany
- 3.2. United Kingdom
- 3.3. France
- 3.4. Italy
- 3.5. Rest of Europe
-
4. South America
- 4.1. Brazil
- 4.2. Argentina
- 4.3. Rest of South America
-
5. Middle East and Africa
- 5.1. Saudi Arabia
- 5.2. South Africa
- 5.3. Rest of Middle East and Africa
Poly Aluminum Chloride Industry Regional Market Share
Geographic Coverage of Poly Aluminum Chloride Industry
Poly Aluminum Chloride Industry REPORT HIGHLIGHTS
| Aspects | Details |
|---|---|
| Study Period | 2020-2034 |
| Base Year | 2025 |
| Estimated Year | 2026 |
| Forecast Period | 2026-2034 |
| Historical Period | 2020-2025 |
| Growth Rate | CAGR of 5.82% from 2020-2034 |
| Segmentation |
|
Table of Contents
- 1. Introduction
- 1.1. Research Scope
- 1.2. Market Segmentation
- 1.3. Research Objective
- 1.4. Definitions and Assumptions
- 2. Executive Summary
- 2.1. Market Snapshot
- 3. Market Dynamics
- 3.1. Market Drivers
- 3.2. Market Restrains
- 3.3. Market Trends
- 3.4. Market Opportunities
- 4. Market Factor Analysis
- 4.1. Porters Five Forces
- 4.1.1. Bargaining Power of Suppliers
- 4.1.2. Bargaining Power of Buyers
- 4.1.3. Threat of New Entrants
- 4.1.4. Threat of Substitutes
- 4.1.5. Competitive Rivalry
- 4.2. PESTEL analysis
- 4.3. BCG Analysis
- 4.3.1. Stars (High Growth, High Market Share)
- 4.3.2. Cash Cows (Low Growth, High Market Share)
- 4.3.3. Question Mark (High Growth, Low Market Share)
- 4.3.4. Dogs (Low Growth, Low Market Share)
- 4.4. Ansoff Matrix Analysis
- 4.5. Supply Chain Analysis
- 4.6. Regulatory Landscape
- 4.7. Current Market Potential and Opportunity Assessment (TAM–SAM–SOM Framework)
- 4.8. IMR Analyst Note
- 4.1. Porters Five Forces
- 5. Market Analysis, Insights and Forecast 2021-2033
- 5.1. Market Analysis, Insights and Forecast - by Form
- 5.1.1. Solid
- 5.1.2. Liquid
- 5.2. Market Analysis, Insights and Forecast - by End-user Industry
- 5.2.1. Water Treatment
- 5.2.2. Paper Industry
- 5.2.3. Cosmetics and Personal Care
- 5.2.4. Oil and Gas
- 5.2.5. Other End-user Industries
- 5.3. Market Analysis, Insights and Forecast - by Region
- 5.3.1. Asia Pacific
- 5.3.2. North America
- 5.3.3. Europe
- 5.3.4. South America
- 5.3.5. Middle East and Africa
- 5.1. Market Analysis, Insights and Forecast - by Form
- 6. Global Poly Aluminum Chloride Industry Analysis, Insights and Forecast, 2021-2033
- 6.1. Market Analysis, Insights and Forecast - by Form
- 6.1.1. Solid
- 6.1.2. Liquid
- 6.2. Market Analysis, Insights and Forecast - by End-user Industry
- 6.2.1. Water Treatment
- 6.2.2. Paper Industry
- 6.2.3. Cosmetics and Personal Care
- 6.2.4. Oil and Gas
- 6.2.5. Other End-user Industries
- 6.1. Market Analysis, Insights and Forecast - by Form
- 7. Asia Pacific Poly Aluminum Chloride Industry Analysis, Insights and Forecast, 2020-2032
- 7.1. Market Analysis, Insights and Forecast - by Form
- 7.1.1. Solid
- 7.1.2. Liquid
- 7.2. Market Analysis, Insights and Forecast - by End-user Industry
- 7.2.1. Water Treatment
- 7.2.2. Paper Industry
- 7.2.3. Cosmetics and Personal Care
- 7.2.4. Oil and Gas
- 7.2.5. Other End-user Industries
- 7.1. Market Analysis, Insights and Forecast - by Form
- 8. North America Poly Aluminum Chloride Industry Analysis, Insights and Forecast, 2020-2032
- 8.1. Market Analysis, Insights and Forecast - by Form
- 8.1.1. Solid
- 8.1.2. Liquid
- 8.2. Market Analysis, Insights and Forecast - by End-user Industry
- 8.2.1. Water Treatment
- 8.2.2. Paper Industry
- 8.2.3. Cosmetics and Personal Care
- 8.2.4. Oil and Gas
- 8.2.5. Other End-user Industries
- 8.1. Market Analysis, Insights and Forecast - by Form
- 9. Europe Poly Aluminum Chloride Industry Analysis, Insights and Forecast, 2020-2032
- 9.1. Market Analysis, Insights and Forecast - by Form
- 9.1.1. Solid
- 9.1.2. Liquid
- 9.2. Market Analysis, Insights and Forecast - by End-user Industry
- 9.2.1. Water Treatment
- 9.2.2. Paper Industry
- 9.2.3. Cosmetics and Personal Care
- 9.2.4. Oil and Gas
- 9.2.5. Other End-user Industries
- 9.1. Market Analysis, Insights and Forecast - by Form
- 10. South America Poly Aluminum Chloride Industry Analysis, Insights and Forecast, 2020-2032
- 10.1. Market Analysis, Insights and Forecast - by Form
- 10.1.1. Solid
- 10.1.2. Liquid
- 10.2. Market Analysis, Insights and Forecast - by End-user Industry
- 10.2.1. Water Treatment
- 10.2.2. Paper Industry
- 10.2.3. Cosmetics and Personal Care
- 10.2.4. Oil and Gas
- 10.2.5. Other End-user Industries
- 10.1. Market Analysis, Insights and Forecast - by Form
- 11. Middle East and Africa Poly Aluminum Chloride Industry Analysis, Insights and Forecast, 2020-2032
- 11.1. Market Analysis, Insights and Forecast - by Form
- 11.1.1. Solid
- 11.1.2. Liquid
- 11.2. Market Analysis, Insights and Forecast - by End-user Industry
- 11.2.1. Water Treatment
- 11.2.2. Paper Industry
- 11.2.3. Cosmetics and Personal Care
- 11.2.4. Oil and Gas
- 11.2.5. Other End-user Industries
- 11.1. Market Analysis, Insights and Forecast - by Form
- 12. Competitive Analysis
- 12.1. Company Profiles
- 12.1.1 Gulbrandsen
- 12.1.1.1. Company Overview
- 12.1.1.2. Products
- 12.1.1.3. Company Financials
- 12.1.1.4. SWOT Analysis
- 12.1.2 USALCO LLC*List Not Exhaustive
- 12.1.2.1. Company Overview
- 12.1.2.2. Products
- 12.1.2.3. Company Financials
- 12.1.2.4. SWOT Analysis
- 12.1.3 Feralco AB
- 12.1.3.1. Company Overview
- 12.1.3.2. Products
- 12.1.3.3. Company Financials
- 12.1.3.4. SWOT Analysis
- 12.1.4 George S Coyne Chemical Co Inc
- 12.1.4.1. Company Overview
- 12.1.4.2. Products
- 12.1.4.3. Company Financials
- 12.1.4.4. SWOT Analysis
- 12.1.5 Kanoria Chemicals & Industries Ltd
- 12.1.5.1. Company Overview
- 12.1.5.2. Products
- 12.1.5.3. Company Financials
- 12.1.5.4. SWOT Analysis
- 12.1.6 Airedale Chemical
- 12.1.6.1. Company Overview
- 12.1.6.2. Products
- 12.1.6.3. Company Financials
- 12.1.6.4. SWOT Analysis
- 12.1.7 Kemira
- 12.1.7.1. Company Overview
- 12.1.7.2. Products
- 12.1.7.3. Company Financials
- 12.1.7.4. SWOT Analysis
- 12.1.8 GEO Specialty Chemicals Inc
- 12.1.8.1. Company Overview
- 12.1.8.2. Products
- 12.1.8.3. Company Financials
- 12.1.8.4. SWOT Analysis
- 12.1.9 Summit Chemical Specialty Products LLC
- 12.1.9.1. Company Overview
- 12.1.9.2. Products
- 12.1.9.3. Company Financials
- 12.1.9.4. SWOT Analysis
- 12.1.10 Synergy Multichem Pvt Ltd
- 12.1.10.1. Company Overview
- 12.1.10.2. Products
- 12.1.10.3. Company Financials
- 12.1.10.4. SWOT Analysis
- 12.1.11 HOLLAND COMPANY
- 12.1.11.1. Company Overview
- 12.1.11.2. Products
- 12.1.11.3. Company Financials
- 12.1.11.4. SWOT Analysis
- 12.1.12 Aditya Birla Chemicals (India) Limited
- 12.1.12.1. Company Overview
- 12.1.12.2. Products
- 12.1.12.3. Company Financials
- 12.1.12.4. SWOT Analysis
- 12.1.1 Gulbrandsen
- 12.2. Market Entropy
- 12.2.1 Company's Key Areas Served
- 12.2.2 Recent Developments
- 12.3. Company Market Share Analysis 2025
- 12.3.1 Top 5 Companies Market Share Analysis
- 12.3.2 Top 3 Companies Market Share Analysis
- 12.4. List of Potential Customers
- 13. Research Methodology
List of Figures
- Figure 1: Global Poly Aluminum Chloride Industry Revenue Breakdown (million, %) by Region 2025 & 2033
- Figure 2: Asia Pacific Poly Aluminum Chloride Industry Revenue (million), by Form 2025 & 2033
- Figure 3: Asia Pacific Poly Aluminum Chloride Industry Revenue Share (%), by Form 2025 & 2033
- Figure 4: Asia Pacific Poly Aluminum Chloride Industry Revenue (million), by End-user Industry 2025 & 2033
- Figure 5: Asia Pacific Poly Aluminum Chloride Industry Revenue Share (%), by End-user Industry 2025 & 2033
- Figure 6: Asia Pacific Poly Aluminum Chloride Industry Revenue (million), by Country 2025 & 2033
- Figure 7: Asia Pacific Poly Aluminum Chloride Industry Revenue Share (%), by Country 2025 & 2033
- Figure 8: North America Poly Aluminum Chloride Industry Revenue (million), by Form 2025 & 2033
- Figure 9: North America Poly Aluminum Chloride Industry Revenue Share (%), by Form 2025 & 2033
- Figure 10: North America Poly Aluminum Chloride Industry Revenue (million), by End-user Industry 2025 & 2033
- Figure 11: North America Poly Aluminum Chloride Industry Revenue Share (%), by End-user Industry 2025 & 2033
- Figure 12: North America Poly Aluminum Chloride Industry Revenue (million), by Country 2025 & 2033
- Figure 13: North America Poly Aluminum Chloride Industry Revenue Share (%), by Country 2025 & 2033
- Figure 14: Europe Poly Aluminum Chloride Industry Revenue (million), by Form 2025 & 2033
- Figure 15: Europe Poly Aluminum Chloride Industry Revenue Share (%), by Form 2025 & 2033
- Figure 16: Europe Poly Aluminum Chloride Industry Revenue (million), by End-user Industry 2025 & 2033
- Figure 17: Europe Poly Aluminum Chloride Industry Revenue Share (%), by End-user Industry 2025 & 2033
- Figure 18: Europe Poly Aluminum Chloride Industry Revenue (million), by Country 2025 & 2033
- Figure 19: Europe Poly Aluminum Chloride Industry Revenue Share (%), by Country 2025 & 2033
- Figure 20: South America Poly Aluminum Chloride Industry Revenue (million), by Form 2025 & 2033
- Figure 21: South America Poly Aluminum Chloride Industry Revenue Share (%), by Form 2025 & 2033
- Figure 22: South America Poly Aluminum Chloride Industry Revenue (million), by End-user Industry 2025 & 2033
- Figure 23: South America Poly Aluminum Chloride Industry Revenue Share (%), by End-user Industry 2025 & 2033
- Figure 24: South America Poly Aluminum Chloride Industry Revenue (million), by Country 2025 & 2033
- Figure 25: South America Poly Aluminum Chloride Industry Revenue Share (%), by Country 2025 & 2033
- Figure 26: Middle East and Africa Poly Aluminum Chloride Industry Revenue (million), by Form 2025 & 2033
- Figure 27: Middle East and Africa Poly Aluminum Chloride Industry Revenue Share (%), by Form 2025 & 2033
- Figure 28: Middle East and Africa Poly Aluminum Chloride Industry Revenue (million), by End-user Industry 2025 & 2033
- Figure 29: Middle East and Africa Poly Aluminum Chloride Industry Revenue Share (%), by End-user Industry 2025 & 2033
- Figure 30: Middle East and Africa Poly Aluminum Chloride Industry Revenue (million), by Country 2025 & 2033
- Figure 31: Middle East and Africa Poly Aluminum Chloride Industry Revenue Share (%), by Country 2025 & 2033
List of Tables
- Table 1: Global Poly Aluminum Chloride Industry Revenue million Forecast, by Form 2020 & 2033
- Table 2: Global Poly Aluminum Chloride Industry Revenue million Forecast, by End-user Industry 2020 & 2033
- Table 3: Global Poly Aluminum Chloride Industry Revenue million Forecast, by Region 2020 & 2033
- Table 4: Global Poly Aluminum Chloride Industry Revenue million Forecast, by Form 2020 & 2033
- Table 5: Global Poly Aluminum Chloride Industry Revenue million Forecast, by End-user Industry 2020 & 2033
- Table 6: Global Poly Aluminum Chloride Industry Revenue million Forecast, by Country 2020 & 2033
- Table 7: China Poly Aluminum Chloride Industry Revenue (million) Forecast, by Application 2020 & 2033
- Table 8: India Poly Aluminum Chloride Industry Revenue (million) Forecast, by Application 2020 & 2033
- Table 9: Japan Poly Aluminum Chloride Industry Revenue (million) Forecast, by Application 2020 & 2033
- Table 10: South Korea Poly Aluminum Chloride Industry Revenue (million) Forecast, by Application 2020 & 2033
- Table 11: Rest of Asia Pacific Poly Aluminum Chloride Industry Revenue (million) Forecast, by Application 2020 & 2033
- Table 12: Global Poly Aluminum Chloride Industry Revenue million Forecast, by Form 2020 & 2033
- Table 13: Global Poly Aluminum Chloride Industry Revenue million Forecast, by End-user Industry 2020 & 2033
- Table 14: Global Poly Aluminum Chloride Industry Revenue million Forecast, by Country 2020 & 2033
- Table 15: United States Poly Aluminum Chloride Industry Revenue (million) Forecast, by Application 2020 & 2033
- Table 16: Canada Poly Aluminum Chloride Industry Revenue (million) Forecast, by Application 2020 & 2033
- Table 17: Mexico Poly Aluminum Chloride Industry Revenue (million) Forecast, by Application 2020 & 2033
- Table 18: Global Poly Aluminum Chloride Industry Revenue million Forecast, by Form 2020 & 2033
- Table 19: Global Poly Aluminum Chloride Industry Revenue million Forecast, by End-user Industry 2020 & 2033
- Table 20: Global Poly Aluminum Chloride Industry Revenue million Forecast, by Country 2020 & 2033
- Table 21: Germany Poly Aluminum Chloride Industry Revenue (million) Forecast, by Application 2020 & 2033
- Table 22: United Kingdom Poly Aluminum Chloride Industry Revenue (million) Forecast, by Application 2020 & 2033
- Table 23: France Poly Aluminum Chloride Industry Revenue (million) Forecast, by Application 2020 & 2033
- Table 24: Italy Poly Aluminum Chloride Industry Revenue (million) Forecast, by Application 2020 & 2033
- Table 25: Rest of Europe Poly Aluminum Chloride Industry Revenue (million) Forecast, by Application 2020 & 2033
- Table 26: Global Poly Aluminum Chloride Industry Revenue million Forecast, by Form 2020 & 2033
- Table 27: Global Poly Aluminum Chloride Industry Revenue million Forecast, by End-user Industry 2020 & 2033
- Table 28: Global Poly Aluminum Chloride Industry Revenue million Forecast, by Country 2020 & 2033
- Table 29: Brazil Poly Aluminum Chloride Industry Revenue (million) Forecast, by Application 2020 & 2033
- Table 30: Argentina Poly Aluminum Chloride Industry Revenue (million) Forecast, by Application 2020 & 2033
- Table 31: Rest of South America Poly Aluminum Chloride Industry Revenue (million) Forecast, by Application 2020 & 2033
- Table 32: Global Poly Aluminum Chloride Industry Revenue million Forecast, by Form 2020 & 2033
- Table 33: Global Poly Aluminum Chloride Industry Revenue million Forecast, by End-user Industry 2020 & 2033
- Table 34: Global Poly Aluminum Chloride Industry Revenue million Forecast, by Country 2020 & 2033
- Table 35: Saudi Arabia Poly Aluminum Chloride Industry Revenue (million) Forecast, by Application 2020 & 2033
- Table 36: South Africa Poly Aluminum Chloride Industry Revenue (million) Forecast, by Application 2020 & 2033
- Table 37: Rest of Middle East and Africa Poly Aluminum Chloride Industry Revenue (million) Forecast, by Application 2020 & 2033
Frequently Asked Questions
1. What is the projected Compound Annual Growth Rate (CAGR) of the Poly Aluminum Chloride Industry?
The projected CAGR is approximately 5.82%.
2. Which companies are prominent players in the Poly Aluminum Chloride Industry?
Key companies in the market include Gulbrandsen, USALCO LLC*List Not Exhaustive, Feralco AB, George S Coyne Chemical Co Inc, Kanoria Chemicals & Industries Ltd, Airedale Chemical, Kemira, GEO Specialty Chemicals Inc, Summit Chemical Specialty Products LLC, Synergy Multichem Pvt Ltd, HOLLAND COMPANY, Aditya Birla Chemicals (India) Limited.
3. What are the main segments of the Poly Aluminum Chloride Industry?
The market segments include Form, End-user Industry.
4. Can you provide details about the market size?
The market size is estimated to be USD 1942 million as of 2022.
5. What are some drivers contributing to market growth?
; Increasing Demand from Large-scale Water Treatment Industries; Increasing Demand in Paper and Pulp Industry.
6. What are the notable trends driving market growth?
Large Scale Water Treatment to Boost Poly Aluminum Chloride Market.
7. Are there any restraints impacting market growth?
; Unfavorable Conditions Arising Due to COVID-19; Other Restraints.
8. Can you provide examples of recent developments in the market?
N/A
9. What pricing options are available for accessing the report?
Pricing options include single-user, multi-user, and enterprise licenses priced at USD 4750, USD 5250, and USD 8750 respectively.
10. Is the market size provided in terms of value or volume?
The market size is provided in terms of value, measured in million.
11. Are there any specific market keywords associated with the report?
Yes, the market keyword associated with the report is "Poly Aluminum Chloride Industry," which aids in identifying and referencing the specific market segment covered.
12. How do I determine which pricing option suits my needs best?
The pricing options vary based on user requirements and access needs. Individual users may opt for single-user licenses, while businesses requiring broader access may choose multi-user or enterprise licenses for cost-effective access to the report.
13. Are there any additional resources or data provided in the Poly Aluminum Chloride Industry report?
While the report offers comprehensive insights, it's advisable to review the specific contents or supplementary materials provided to ascertain if additional resources or data are available.
14. How can I stay updated on further developments or reports in the Poly Aluminum Chloride Industry?
To stay informed about further developments, trends, and reports in the Poly Aluminum Chloride Industry, consider subscribing to industry newsletters, following relevant companies and organizations, or regularly checking reputable industry news sources and publications.
Methodology
Step 1 - Identification of Relevant Samples Size from Population Database


Step 2 - Approaches for Defining Global Market Size (Value, Volume* & Price*)

Note*: In applicable scenarios
Step 3 - Data Sources
Primary Research
- Web Analytics
- Survey Reports
- Research Institute
- Latest Research Reports
- Opinion Leaders
Secondary Research
- Annual Reports
- White Paper
- Latest Press Release
- Industry Association
- Paid Database
- Investor Presentations

Step 4 - Data Triangulation
Involves using different sources of information in order to increase the validity of a study
These sources are likely to be stakeholders in a program - participants, other researchers, program staff, other community members, and so on.
Then we put all data in single framework & apply various statistical tools to find out the dynamic on the market.
During the analysis stage, feedback from the stakeholder groups would be compared to determine areas of agreement as well as areas of divergence