

Key Insights
The global polyether polyols market is poised for significant expansion, driven by escalating demand across key industries. The market is projected to reach $30 billion by 2025, with a Compound Annual Growth Rate (CAGR) of over 5% from 2025 to 2033. Key growth drivers include the thriving furniture and bedding sector, increased construction activity requiring advanced insulation, and the automotive industry's focus on lightweight materials. Advancements in polyether polyol formulations, enhancing properties like flame retardancy and biodegradability, are further accelerating market growth. Despite challenges from raw material price volatility and environmental considerations, the market exhibits strong potential, particularly in Asia-Pacific and South America. Segmentation by product type (flexible, rigid) and end-use industries (furniture & bedding, construction, automotive, electrical & electronics) facilitates targeted innovation and market penetration. The competitive landscape features established global leaders and emerging regional players.
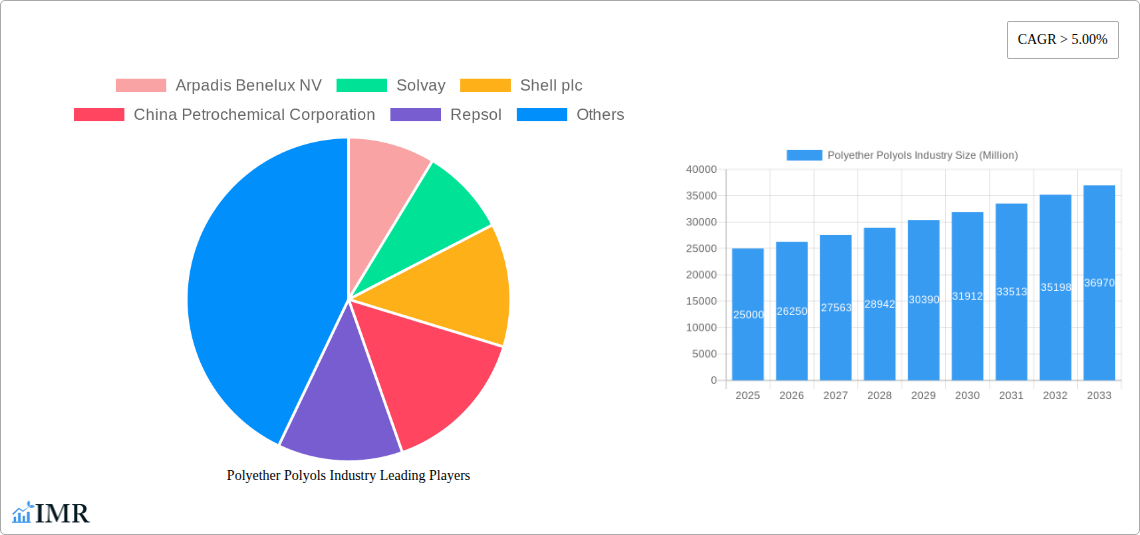
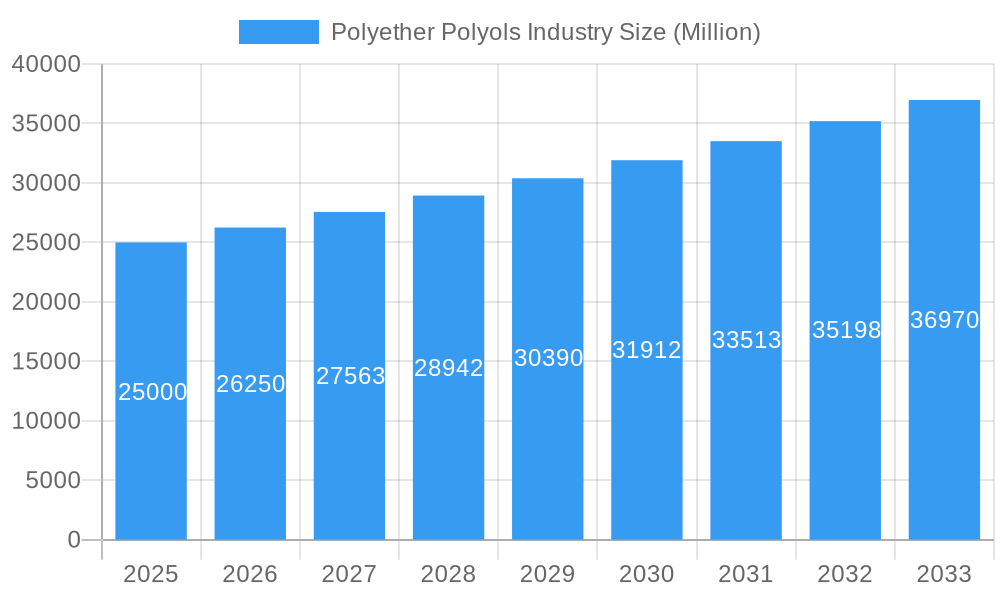
Polyether Polyols Industry Market Size (In Billion)
The flexible polyether polyols segment currently leads the market, primarily serving the furniture and bedding sectors. However, the rigid segment is anticipated to experience robust growth, driven by the construction industry's demand for superior insulation solutions. While North America and Europe currently hold substantial market shares, the Asia-Pacific region is expected to emerge as the fastest-growing market due to rapid industrialization and urbanization. Strategic collaborations, mergers, acquisitions, and sustained R&D investments will shape the future competitive landscape. Manufacturers are prioritizing the development of high-performance, eco-friendly polyether polyol solutions to meet evolving market demands and regulatory standards, fostering continuous innovation and market development.
Polyether Polyols Industry Company Market Share
Polyether Polyols Industry Market Report: 2019-2033
This comprehensive report provides an in-depth analysis of the Polyether Polyols industry, encompassing market dynamics, growth trends, regional dominance, product landscape, key players, and future outlook. The study period covers 2019-2033, with 2025 serving as the base and estimated year. This report is invaluable for industry professionals, investors, and strategic decision-makers seeking a clear understanding of this dynamic market. The report is structured to offer concise insights and actionable intelligence.
Polyether Polyols Industry Market Dynamics & Structure
This section analyzes the competitive landscape, technological advancements, regulatory influences, and market trends within the Polyether Polyols industry. We delve into market concentration, exploring the market share held by key players like BASF SE, Dow, and Huntsman International LLC. The report also examines the impact of mergers and acquisitions (M&A) activity, including the xx million USD in deals recorded between 2019-2024. Technological innovation, specifically advancements in biodegradable polyols, is also assessed. Regulatory frameworks impacting production and sustainability are analyzed, alongside the presence of competitive product substitutes and their market penetration. End-user demographic shifts and their influence on demand are considered.
- Market Concentration: Highly consolidated market with top 5 players holding xx% market share.
- Technological Innovation: Focus on biodegradable and high-performance polyols.
- Regulatory Landscape: Emphasis on environmental regulations and sustainability standards.
- M&A Activity: xx deals recorded between 2019-2024, totaling xx million USD.
- Competitive Substitutes: Growing competition from bio-based alternatives.
- End-User Demographics: Shifting demand patterns across automotive, construction, and furniture sectors.
Polyether Polyols Industry Growth Trends & Insights
This section provides a detailed analysis of the Polyether Polyols market's growth trajectory from 2019 to 2033. We examine market size evolution, revealing a CAGR of xx% during the historical period (2019-2024) and projecting a CAGR of xx% for the forecast period (2025-2033). The report analyzes adoption rates across various end-user industries, highlighting the impact of technological disruptions, such as the emergence of more sustainable production methods and the increasing use of bio-based materials. It also explores shifts in consumer behavior driving market demand. Specific insights are provided on market penetration rates in key regions and segments. The total market size is estimated at xx million USD in 2025, expected to reach xx million USD by 2033.
Dominant Regions, Countries, or Segments in Polyether Polyols Industry
This section identifies the leading regions, countries, and segments within the Polyether Polyols market. Analysis focuses on market share and growth potential of Flexible, Rigid, and Other Types of Polyether Polyols across key end-user industries: Furniture and Bedding, Construction, Automotive, Electrical and Electronics, and Other End-user Industries. Asia-Pacific is identified as the leading region, driven by robust construction and automotive sectors. Specific countries within this region contributing significantly to market growth are highlighted. Key drivers like government policies, infrastructural developments, and economic growth are examined for each dominant segment.
- Leading Region: Asia-Pacific (xx% market share in 2025)
- Dominant Segment (Type): Flexible Polyether Polyols (xx% market share in 2025)
- Key End-User Industry: Construction (xx% market share in 2025)
- Growth Drivers: Rapid urbanization, infrastructure investments, and automotive production expansion.
Polyether Polyols Industry Product Landscape
The Polyether Polyols market offers a diverse range of products, categorized by type (flexible, rigid, other) and tailored for specific end-user applications. Recent innovations include biodegradable polyols, which meet growing sustainability concerns. Performance metrics such as thermal stability, flexibility, and durability are driving product differentiation. Unique selling propositions emphasize improved sustainability and performance characteristics, attracting consumers seeking eco-friendly and high-performing materials. Technological advancements continuously push the boundaries of product capabilities, enabling greater flexibility and wider applications.
Key Drivers, Barriers & Challenges in Polyether Polyols Industry
Key Drivers: Increasing demand from the construction, automotive, and furniture industries; rising focus on sustainable materials; technological advancements leading to enhanced product performance.
Challenges and Restraints: Fluctuations in raw material prices, stringent environmental regulations, and intense competition from alternative materials. Supply chain disruptions can also impact production and costs, potentially reducing profitability by xx% in extreme cases.
Emerging Opportunities in Polyether Polyols Industry
Emerging opportunities lie in expanding into untapped markets, particularly in developing economies with growing infrastructure needs. Innovative applications in areas like 3D printing and flexible electronics are also expected to boost market growth. Evolving consumer preferences for sustainable and eco-friendly products present a significant opportunity for manufacturers to develop and promote biodegradable polyols and other sustainable solutions.
Growth Accelerators in the Polyether Polyols Industry
Long-term growth is expected to be fueled by technological advancements, such as the development of high-performance and biodegradable polyols. Strategic partnerships and collaborations between manufacturers and end-users will play a vital role in driving market expansion. Furthermore, aggressive market expansion strategies targeting new regions and applications will accelerate growth.
Key Players Shaping the Polyether Polyols Industry Market
- Arpadis Benelux NV
- Solvay
- Shell plc
- China Petrochemical Corporation
- Repsol
- BASF SE
- Huntsman International LLC
- Dow
- Covestro AG
- PCC Group
- Purinova Sp z o o
Notable Milestones in Polyether Polyols Industry Sector
- December 2021: PCC Group expands production capacity and product range, including biodegradable products.
- February 2021: Repsol licenses agreement to build propylene oxide (PO), styrene monomer (SM), and polyol plants in China (125,000 tonnes/year capacity).
- January 2021: Stepan Company acquires INVISTA's aromatic polyester polyol business.
In-Depth Polyether Polyols Industry Market Outlook
The Polyether Polyols market is poised for significant growth driven by rising demand from key end-user industries and the increasing adoption of sustainable materials. Strategic investments in research and development, coupled with strategic partnerships, are expected to further propel market expansion. Opportunities in emerging markets and innovative applications promise to unlock substantial future potential. The market is projected to experience strong growth over the forecast period, making it an attractive investment opportunity.
Polyether Polyols Industry Segmentation
-
1. Type
- 1.1. Flexible
- 1.2. Rigid
- 1.3. Other Types
-
2. End-user Industry
- 2.1. Furniture and Bedding
- 2.2. Construction
- 2.3. Automotive
- 2.4. Electrical and Electronics
- 2.5. Other End-user Industries
Polyether Polyols Industry Segmentation By Geography
-
1. Asia Pacific
- 1.1. China
- 1.2. India
- 1.3. Japan
- 1.4. South Korea
- 1.5. Rest of Asia Pacific
-
2. North America
- 2.1. United States
- 2.2. Canada
- 2.3. Mexico
-
3. Europe
- 3.1. Germany
- 3.2. United Kingdom
- 3.3. Italy
- 3.4. France
- 3.5. Rest of Europe
-
4. South America
- 4.1. Brazil
- 4.2. Argentina
- 4.3. Rest of South America
-
5. Middle East and Africa
- 5.1. Saudi Arabia
- 5.2. South Africa
- 5.3. Rest of Middle East and Africa
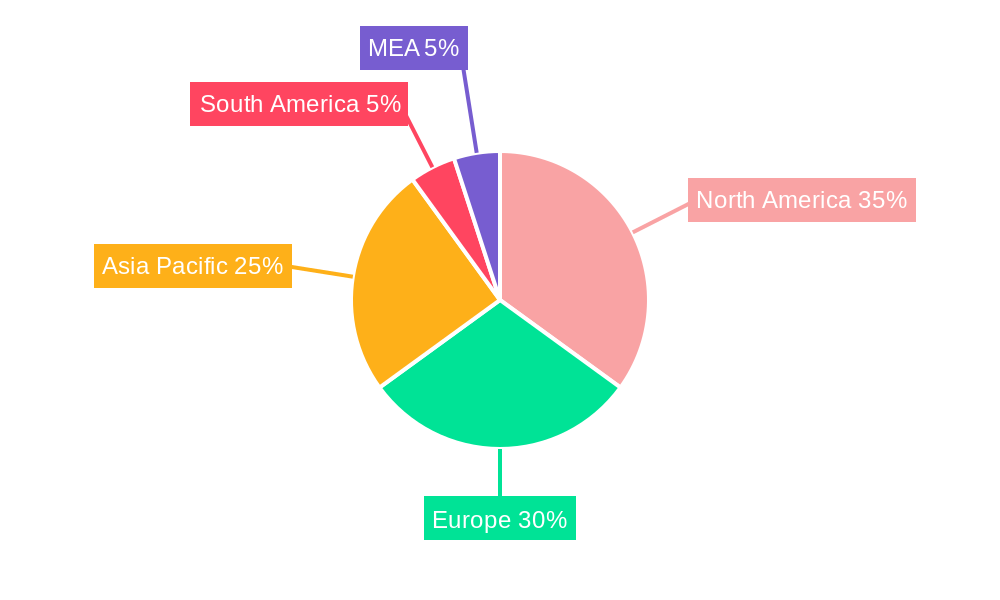
Polyether Polyols Industry Regional Market Share
Geographic Coverage of Polyether Polyols Industry
Polyether Polyols Industry REPORT HIGHLIGHTS
| Aspects | Details |
|---|---|
| Study Period | 2020-2034 |
| Base Year | 2025 |
| Estimated Year | 2026 |
| Forecast Period | 2026-2034 |
| Historical Period | 2020-2025 |
| Growth Rate | CAGR of 5% from 2020-2034 |
| Segmentation |
|
Table of Contents
- 1. Introduction
- 1.1. Research Scope
- 1.2. Market Segmentation
- 1.3. Research Methodology
- 1.4. Definitions and Assumptions
- 2. Executive Summary
- 2.1. Introduction
- 3. Market Dynamics
- 3.1. Introduction
- 3.2. Market Drivers
- 3.2.1. Rising Demand for Flexible and Rigid Polyurethane Foam; Growth of Automotive Industry; Rising Demand from Construction Industry
- 3.3. Market Restrains
- 3.3.1. Volatile Prices of Raw Materials; Stringent Government Regulations on Polyurethane Foam Manufacturing
- 3.4. Market Trends
- 3.4.1. Rising Demand from Construction Industry
- 4. Market Factor Analysis
- 4.1. Porters Five Forces
- 4.2. Supply/Value Chain
- 4.3. PESTEL analysis
- 4.4. Market Entropy
- 4.5. Patent/Trademark Analysis
- 5. Global Polyether Polyols Industry Analysis, Insights and Forecast, 2020-2032
- 5.1. Market Analysis, Insights and Forecast - by Type
- 5.1.1. Flexible
- 5.1.2. Rigid
- 5.1.3. Other Types
- 5.2. Market Analysis, Insights and Forecast - by End-user Industry
- 5.2.1. Furniture and Bedding
- 5.2.2. Construction
- 5.2.3. Automotive
- 5.2.4. Electrical and Electronics
- 5.2.5. Other End-user Industries
- 5.3. Market Analysis, Insights and Forecast - by Region
- 5.3.1. Asia Pacific
- 5.3.2. North America
- 5.3.3. Europe
- 5.3.4. South America
- 5.3.5. Middle East and Africa
- 5.1. Market Analysis, Insights and Forecast - by Type
- 6. Asia Pacific Polyether Polyols Industry Analysis, Insights and Forecast, 2020-2032
- 6.1. Market Analysis, Insights and Forecast - by Type
- 6.1.1. Flexible
- 6.1.2. Rigid
- 6.1.3. Other Types
- 6.2. Market Analysis, Insights and Forecast - by End-user Industry
- 6.2.1. Furniture and Bedding
- 6.2.2. Construction
- 6.2.3. Automotive
- 6.2.4. Electrical and Electronics
- 6.2.5. Other End-user Industries
- 6.1. Market Analysis, Insights and Forecast - by Type
- 7. North America Polyether Polyols Industry Analysis, Insights and Forecast, 2020-2032
- 7.1. Market Analysis, Insights and Forecast - by Type
- 7.1.1. Flexible
- 7.1.2. Rigid
- 7.1.3. Other Types
- 7.2. Market Analysis, Insights and Forecast - by End-user Industry
- 7.2.1. Furniture and Bedding
- 7.2.2. Construction
- 7.2.3. Automotive
- 7.2.4. Electrical and Electronics
- 7.2.5. Other End-user Industries
- 7.1. Market Analysis, Insights and Forecast - by Type
- 8. Europe Polyether Polyols Industry Analysis, Insights and Forecast, 2020-2032
- 8.1. Market Analysis, Insights and Forecast - by Type
- 8.1.1. Flexible
- 8.1.2. Rigid
- 8.1.3. Other Types
- 8.2. Market Analysis, Insights and Forecast - by End-user Industry
- 8.2.1. Furniture and Bedding
- 8.2.2. Construction
- 8.2.3. Automotive
- 8.2.4. Electrical and Electronics
- 8.2.5. Other End-user Industries
- 8.1. Market Analysis, Insights and Forecast - by Type
- 9. South America Polyether Polyols Industry Analysis, Insights and Forecast, 2020-2032
- 9.1. Market Analysis, Insights and Forecast - by Type
- 9.1.1. Flexible
- 9.1.2. Rigid
- 9.1.3. Other Types
- 9.2. Market Analysis, Insights and Forecast - by End-user Industry
- 9.2.1. Furniture and Bedding
- 9.2.2. Construction
- 9.2.3. Automotive
- 9.2.4. Electrical and Electronics
- 9.2.5. Other End-user Industries
- 9.1. Market Analysis, Insights and Forecast - by Type
- 10. Middle East and Africa Polyether Polyols Industry Analysis, Insights and Forecast, 2020-2032
- 10.1. Market Analysis, Insights and Forecast - by Type
- 10.1.1. Flexible
- 10.1.2. Rigid
- 10.1.3. Other Types
- 10.2. Market Analysis, Insights and Forecast - by End-user Industry
- 10.2.1. Furniture and Bedding
- 10.2.2. Construction
- 10.2.3. Automotive
- 10.2.4. Electrical and Electronics
- 10.2.5. Other End-user Industries
- 10.1. Market Analysis, Insights and Forecast - by Type
- 11. Competitive Analysis
- 11.1. Global Market Share Analysis 2025
- 11.2. Company Profiles
- 11.2.1 Arpadis Benelux NV
- 11.2.1.1. Overview
- 11.2.1.2. Products
- 11.2.1.3. SWOT Analysis
- 11.2.1.4. Recent Developments
- 11.2.1.5. Financials (Based on Availability)
- 11.2.2 Solvay
- 11.2.2.1. Overview
- 11.2.2.2. Products
- 11.2.2.3. SWOT Analysis
- 11.2.2.4. Recent Developments
- 11.2.2.5. Financials (Based on Availability)
- 11.2.3 Shell plc
- 11.2.3.1. Overview
- 11.2.3.2. Products
- 11.2.3.3. SWOT Analysis
- 11.2.3.4. Recent Developments
- 11.2.3.5. Financials (Based on Availability)
- 11.2.4 China Petrochemical Corporation
- 11.2.4.1. Overview
- 11.2.4.2. Products
- 11.2.4.3. SWOT Analysis
- 11.2.4.4. Recent Developments
- 11.2.4.5. Financials (Based on Availability)
- 11.2.5 Repsol
- 11.2.5.1. Overview
- 11.2.5.2. Products
- 11.2.5.3. SWOT Analysis
- 11.2.5.4. Recent Developments
- 11.2.5.5. Financials (Based on Availability)
- 11.2.6 BASF SE
- 11.2.6.1. Overview
- 11.2.6.2. Products
- 11.2.6.3. SWOT Analysis
- 11.2.6.4. Recent Developments
- 11.2.6.5. Financials (Based on Availability)
- 11.2.7 Huntsman International LLC
- 11.2.7.1. Overview
- 11.2.7.2. Products
- 11.2.7.3. SWOT Analysis
- 11.2.7.4. Recent Developments
- 11.2.7.5. Financials (Based on Availability)
- 11.2.8 Dow
- 11.2.8.1. Overview
- 11.2.8.2. Products
- 11.2.8.3. SWOT Analysis
- 11.2.8.4. Recent Developments
- 11.2.8.5. Financials (Based on Availability)
- 11.2.9 Covestro AG
- 11.2.9.1. Overview
- 11.2.9.2. Products
- 11.2.9.3. SWOT Analysis
- 11.2.9.4. Recent Developments
- 11.2.9.5. Financials (Based on Availability)
- 11.2.10 PCC Group
- 11.2.10.1. Overview
- 11.2.10.2. Products
- 11.2.10.3. SWOT Analysis
- 11.2.10.4. Recent Developments
- 11.2.10.5. Financials (Based on Availability)
- 11.2.11 Purinova Sp z o o
- 11.2.11.1. Overview
- 11.2.11.2. Products
- 11.2.11.3. SWOT Analysis
- 11.2.11.4. Recent Developments
- 11.2.11.5. Financials (Based on Availability)
- 11.2.1 Arpadis Benelux NV
List of Figures
- Figure 1: Global Polyether Polyols Industry Revenue Breakdown (billion, %) by Region 2025 & 2033
- Figure 2: Global Polyether Polyols Industry Volume Breakdown (K Tons, %) by Region 2025 & 2033
- Figure 3: Asia Pacific Polyether Polyols Industry Revenue (billion), by Type 2025 & 2033
- Figure 4: Asia Pacific Polyether Polyols Industry Volume (K Tons), by Type 2025 & 2033
- Figure 5: Asia Pacific Polyether Polyols Industry Revenue Share (%), by Type 2025 & 2033
- Figure 6: Asia Pacific Polyether Polyols Industry Volume Share (%), by Type 2025 & 2033
- Figure 7: Asia Pacific Polyether Polyols Industry Revenue (billion), by End-user Industry 2025 & 2033
- Figure 8: Asia Pacific Polyether Polyols Industry Volume (K Tons), by End-user Industry 2025 & 2033
- Figure 9: Asia Pacific Polyether Polyols Industry Revenue Share (%), by End-user Industry 2025 & 2033
- Figure 10: Asia Pacific Polyether Polyols Industry Volume Share (%), by End-user Industry 2025 & 2033
- Figure 11: Asia Pacific Polyether Polyols Industry Revenue (billion), by Country 2025 & 2033
- Figure 12: Asia Pacific Polyether Polyols Industry Volume (K Tons), by Country 2025 & 2033
- Figure 13: Asia Pacific Polyether Polyols Industry Revenue Share (%), by Country 2025 & 2033
- Figure 14: Asia Pacific Polyether Polyols Industry Volume Share (%), by Country 2025 & 2033
- Figure 15: North America Polyether Polyols Industry Revenue (billion), by Type 2025 & 2033
- Figure 16: North America Polyether Polyols Industry Volume (K Tons), by Type 2025 & 2033
- Figure 17: North America Polyether Polyols Industry Revenue Share (%), by Type 2025 & 2033
- Figure 18: North America Polyether Polyols Industry Volume Share (%), by Type 2025 & 2033
- Figure 19: North America Polyether Polyols Industry Revenue (billion), by End-user Industry 2025 & 2033
- Figure 20: North America Polyether Polyols Industry Volume (K Tons), by End-user Industry 2025 & 2033
- Figure 21: North America Polyether Polyols Industry Revenue Share (%), by End-user Industry 2025 & 2033
- Figure 22: North America Polyether Polyols Industry Volume Share (%), by End-user Industry 2025 & 2033
- Figure 23: North America Polyether Polyols Industry Revenue (billion), by Country 2025 & 2033
- Figure 24: North America Polyether Polyols Industry Volume (K Tons), by Country 2025 & 2033
- Figure 25: North America Polyether Polyols Industry Revenue Share (%), by Country 2025 & 2033
- Figure 26: North America Polyether Polyols Industry Volume Share (%), by Country 2025 & 2033
- Figure 27: Europe Polyether Polyols Industry Revenue (billion), by Type 2025 & 2033
- Figure 28: Europe Polyether Polyols Industry Volume (K Tons), by Type 2025 & 2033
- Figure 29: Europe Polyether Polyols Industry Revenue Share (%), by Type 2025 & 2033
- Figure 30: Europe Polyether Polyols Industry Volume Share (%), by Type 2025 & 2033
- Figure 31: Europe Polyether Polyols Industry Revenue (billion), by End-user Industry 2025 & 2033
- Figure 32: Europe Polyether Polyols Industry Volume (K Tons), by End-user Industry 2025 & 2033
- Figure 33: Europe Polyether Polyols Industry Revenue Share (%), by End-user Industry 2025 & 2033
- Figure 34: Europe Polyether Polyols Industry Volume Share (%), by End-user Industry 2025 & 2033
- Figure 35: Europe Polyether Polyols Industry Revenue (billion), by Country 2025 & 2033
- Figure 36: Europe Polyether Polyols Industry Volume (K Tons), by Country 2025 & 2033
- Figure 37: Europe Polyether Polyols Industry Revenue Share (%), by Country 2025 & 2033
- Figure 38: Europe Polyether Polyols Industry Volume Share (%), by Country 2025 & 2033
- Figure 39: South America Polyether Polyols Industry Revenue (billion), by Type 2025 & 2033
- Figure 40: South America Polyether Polyols Industry Volume (K Tons), by Type 2025 & 2033
- Figure 41: South America Polyether Polyols Industry Revenue Share (%), by Type 2025 & 2033
- Figure 42: South America Polyether Polyols Industry Volume Share (%), by Type 2025 & 2033
- Figure 43: South America Polyether Polyols Industry Revenue (billion), by End-user Industry 2025 & 2033
- Figure 44: South America Polyether Polyols Industry Volume (K Tons), by End-user Industry 2025 & 2033
- Figure 45: South America Polyether Polyols Industry Revenue Share (%), by End-user Industry 2025 & 2033
- Figure 46: South America Polyether Polyols Industry Volume Share (%), by End-user Industry 2025 & 2033
- Figure 47: South America Polyether Polyols Industry Revenue (billion), by Country 2025 & 2033
- Figure 48: South America Polyether Polyols Industry Volume (K Tons), by Country 2025 & 2033
- Figure 49: South America Polyether Polyols Industry Revenue Share (%), by Country 2025 & 2033
- Figure 50: South America Polyether Polyols Industry Volume Share (%), by Country 2025 & 2033
- Figure 51: Middle East and Africa Polyether Polyols Industry Revenue (billion), by Type 2025 & 2033
- Figure 52: Middle East and Africa Polyether Polyols Industry Volume (K Tons), by Type 2025 & 2033
- Figure 53: Middle East and Africa Polyether Polyols Industry Revenue Share (%), by Type 2025 & 2033
- Figure 54: Middle East and Africa Polyether Polyols Industry Volume Share (%), by Type 2025 & 2033
- Figure 55: Middle East and Africa Polyether Polyols Industry Revenue (billion), by End-user Industry 2025 & 2033
- Figure 56: Middle East and Africa Polyether Polyols Industry Volume (K Tons), by End-user Industry 2025 & 2033
- Figure 57: Middle East and Africa Polyether Polyols Industry Revenue Share (%), by End-user Industry 2025 & 2033
- Figure 58: Middle East and Africa Polyether Polyols Industry Volume Share (%), by End-user Industry 2025 & 2033
- Figure 59: Middle East and Africa Polyether Polyols Industry Revenue (billion), by Country 2025 & 2033
- Figure 60: Middle East and Africa Polyether Polyols Industry Volume (K Tons), by Country 2025 & 2033
- Figure 61: Middle East and Africa Polyether Polyols Industry Revenue Share (%), by Country 2025 & 2033
- Figure 62: Middle East and Africa Polyether Polyols Industry Volume Share (%), by Country 2025 & 2033
List of Tables
- Table 1: Global Polyether Polyols Industry Revenue billion Forecast, by Type 2020 & 2033
- Table 2: Global Polyether Polyols Industry Volume K Tons Forecast, by Type 2020 & 2033
- Table 3: Global Polyether Polyols Industry Revenue billion Forecast, by End-user Industry 2020 & 2033
- Table 4: Global Polyether Polyols Industry Volume K Tons Forecast, by End-user Industry 2020 & 2033
- Table 5: Global Polyether Polyols Industry Revenue billion Forecast, by Region 2020 & 2033
- Table 6: Global Polyether Polyols Industry Volume K Tons Forecast, by Region 2020 & 2033
- Table 7: Global Polyether Polyols Industry Revenue billion Forecast, by Type 2020 & 2033
- Table 8: Global Polyether Polyols Industry Volume K Tons Forecast, by Type 2020 & 2033
- Table 9: Global Polyether Polyols Industry Revenue billion Forecast, by End-user Industry 2020 & 2033
- Table 10: Global Polyether Polyols Industry Volume K Tons Forecast, by End-user Industry 2020 & 2033
- Table 11: Global Polyether Polyols Industry Revenue billion Forecast, by Country 2020 & 2033
- Table 12: Global Polyether Polyols Industry Volume K Tons Forecast, by Country 2020 & 2033
- Table 13: China Polyether Polyols Industry Revenue (billion) Forecast, by Application 2020 & 2033
- Table 14: China Polyether Polyols Industry Volume (K Tons) Forecast, by Application 2020 & 2033
- Table 15: India Polyether Polyols Industry Revenue (billion) Forecast, by Application 2020 & 2033
- Table 16: India Polyether Polyols Industry Volume (K Tons) Forecast, by Application 2020 & 2033
- Table 17: Japan Polyether Polyols Industry Revenue (billion) Forecast, by Application 2020 & 2033
- Table 18: Japan Polyether Polyols Industry Volume (K Tons) Forecast, by Application 2020 & 2033
- Table 19: South Korea Polyether Polyols Industry Revenue (billion) Forecast, by Application 2020 & 2033
- Table 20: South Korea Polyether Polyols Industry Volume (K Tons) Forecast, by Application 2020 & 2033
- Table 21: Rest of Asia Pacific Polyether Polyols Industry Revenue (billion) Forecast, by Application 2020 & 2033
- Table 22: Rest of Asia Pacific Polyether Polyols Industry Volume (K Tons) Forecast, by Application 2020 & 2033
- Table 23: Global Polyether Polyols Industry Revenue billion Forecast, by Type 2020 & 2033
- Table 24: Global Polyether Polyols Industry Volume K Tons Forecast, by Type 2020 & 2033
- Table 25: Global Polyether Polyols Industry Revenue billion Forecast, by End-user Industry 2020 & 2033
- Table 26: Global Polyether Polyols Industry Volume K Tons Forecast, by End-user Industry 2020 & 2033
- Table 27: Global Polyether Polyols Industry Revenue billion Forecast, by Country 2020 & 2033
- Table 28: Global Polyether Polyols Industry Volume K Tons Forecast, by Country 2020 & 2033
- Table 29: United States Polyether Polyols Industry Revenue (billion) Forecast, by Application 2020 & 2033
- Table 30: United States Polyether Polyols Industry Volume (K Tons) Forecast, by Application 2020 & 2033
- Table 31: Canada Polyether Polyols Industry Revenue (billion) Forecast, by Application 2020 & 2033
- Table 32: Canada Polyether Polyols Industry Volume (K Tons) Forecast, by Application 2020 & 2033
- Table 33: Mexico Polyether Polyols Industry Revenue (billion) Forecast, by Application 2020 & 2033
- Table 34: Mexico Polyether Polyols Industry Volume (K Tons) Forecast, by Application 2020 & 2033
- Table 35: Global Polyether Polyols Industry Revenue billion Forecast, by Type 2020 & 2033
- Table 36: Global Polyether Polyols Industry Volume K Tons Forecast, by Type 2020 & 2033
- Table 37: Global Polyether Polyols Industry Revenue billion Forecast, by End-user Industry 2020 & 2033
- Table 38: Global Polyether Polyols Industry Volume K Tons Forecast, by End-user Industry 2020 & 2033
- Table 39: Global Polyether Polyols Industry Revenue billion Forecast, by Country 2020 & 2033
- Table 40: Global Polyether Polyols Industry Volume K Tons Forecast, by Country 2020 & 2033
- Table 41: Germany Polyether Polyols Industry Revenue (billion) Forecast, by Application 2020 & 2033
- Table 42: Germany Polyether Polyols Industry Volume (K Tons) Forecast, by Application 2020 & 2033
- Table 43: United Kingdom Polyether Polyols Industry Revenue (billion) Forecast, by Application 2020 & 2033
- Table 44: United Kingdom Polyether Polyols Industry Volume (K Tons) Forecast, by Application 2020 & 2033
- Table 45: Italy Polyether Polyols Industry Revenue (billion) Forecast, by Application 2020 & 2033
- Table 46: Italy Polyether Polyols Industry Volume (K Tons) Forecast, by Application 2020 & 2033
- Table 47: France Polyether Polyols Industry Revenue (billion) Forecast, by Application 2020 & 2033
- Table 48: France Polyether Polyols Industry Volume (K Tons) Forecast, by Application 2020 & 2033
- Table 49: Rest of Europe Polyether Polyols Industry Revenue (billion) Forecast, by Application 2020 & 2033
- Table 50: Rest of Europe Polyether Polyols Industry Volume (K Tons) Forecast, by Application 2020 & 2033
- Table 51: Global Polyether Polyols Industry Revenue billion Forecast, by Type 2020 & 2033
- Table 52: Global Polyether Polyols Industry Volume K Tons Forecast, by Type 2020 & 2033
- Table 53: Global Polyether Polyols Industry Revenue billion Forecast, by End-user Industry 2020 & 2033
- Table 54: Global Polyether Polyols Industry Volume K Tons Forecast, by End-user Industry 2020 & 2033
- Table 55: Global Polyether Polyols Industry Revenue billion Forecast, by Country 2020 & 2033
- Table 56: Global Polyether Polyols Industry Volume K Tons Forecast, by Country 2020 & 2033
- Table 57: Brazil Polyether Polyols Industry Revenue (billion) Forecast, by Application 2020 & 2033
- Table 58: Brazil Polyether Polyols Industry Volume (K Tons) Forecast, by Application 2020 & 2033
- Table 59: Argentina Polyether Polyols Industry Revenue (billion) Forecast, by Application 2020 & 2033
- Table 60: Argentina Polyether Polyols Industry Volume (K Tons) Forecast, by Application 2020 & 2033
- Table 61: Rest of South America Polyether Polyols Industry Revenue (billion) Forecast, by Application 2020 & 2033
- Table 62: Rest of South America Polyether Polyols Industry Volume (K Tons) Forecast, by Application 2020 & 2033
- Table 63: Global Polyether Polyols Industry Revenue billion Forecast, by Type 2020 & 2033
- Table 64: Global Polyether Polyols Industry Volume K Tons Forecast, by Type 2020 & 2033
- Table 65: Global Polyether Polyols Industry Revenue billion Forecast, by End-user Industry 2020 & 2033
- Table 66: Global Polyether Polyols Industry Volume K Tons Forecast, by End-user Industry 2020 & 2033
- Table 67: Global Polyether Polyols Industry Revenue billion Forecast, by Country 2020 & 2033
- Table 68: Global Polyether Polyols Industry Volume K Tons Forecast, by Country 2020 & 2033
- Table 69: Saudi Arabia Polyether Polyols Industry Revenue (billion) Forecast, by Application 2020 & 2033
- Table 70: Saudi Arabia Polyether Polyols Industry Volume (K Tons) Forecast, by Application 2020 & 2033
- Table 71: South Africa Polyether Polyols Industry Revenue (billion) Forecast, by Application 2020 & 2033
- Table 72: South Africa Polyether Polyols Industry Volume (K Tons) Forecast, by Application 2020 & 2033
- Table 73: Rest of Middle East and Africa Polyether Polyols Industry Revenue (billion) Forecast, by Application 2020 & 2033
- Table 74: Rest of Middle East and Africa Polyether Polyols Industry Volume (K Tons) Forecast, by Application 2020 & 2033
Frequently Asked Questions
1. What is the projected Compound Annual Growth Rate (CAGR) of the Polyether Polyols Industry?
The projected CAGR is approximately 5%.
2. Which companies are prominent players in the Polyether Polyols Industry?
Key companies in the market include Arpadis Benelux NV, Solvay, Shell plc, China Petrochemical Corporation, Repsol, BASF SE, Huntsman International LLC, Dow, Covestro AG, PCC Group, Purinova Sp z o o.
3. What are the main segments of the Polyether Polyols Industry?
The market segments include Type, End-user Industry.
4. Can you provide details about the market size?
The market size is estimated to be USD 30 billion as of 2022.
5. What are some drivers contributing to market growth?
Rising Demand for Flexible and Rigid Polyurethane Foam; Growth of Automotive Industry; Rising Demand from Construction Industry.
6. What are the notable trends driving market growth?
Rising Demand from Construction Industry.
7. Are there any restraints impacting market growth?
Volatile Prices of Raw Materials; Stringent Government Regulations on Polyurethane Foam Manufacturing.
8. Can you provide examples of recent developments in the market?
In December 2021, PCC Group has expanded its production capacity and the range of manufactured products. The installation is to produce a range of ethoxylates, polyether polyols, and other ethoxylated products, including biodegradable products.
9. What pricing options are available for accessing the report?
Pricing options include single-user, multi-user, and enterprise licenses priced at USD 4750, USD 5250, and USD 8750 respectively.
10. Is the market size provided in terms of value or volume?
The market size is provided in terms of value, measured in billion and volume, measured in K Tons.
11. Are there any specific market keywords associated with the report?
Yes, the market keyword associated with the report is "Polyether Polyols Industry," which aids in identifying and referencing the specific market segment covered.
12. How do I determine which pricing option suits my needs best?
The pricing options vary based on user requirements and access needs. Individual users may opt for single-user licenses, while businesses requiring broader access may choose multi-user or enterprise licenses for cost-effective access to the report.
13. Are there any additional resources or data provided in the Polyether Polyols Industry report?
While the report offers comprehensive insights, it's advisable to review the specific contents or supplementary materials provided to ascertain if additional resources or data are available.
14. How can I stay updated on further developments or reports in the Polyether Polyols Industry?
To stay informed about further developments, trends, and reports in the Polyether Polyols Industry, consider subscribing to industry newsletters, following relevant companies and organizations, or regularly checking reputable industry news sources and publications.
Methodology
Step 1 - Identification of Relevant Samples Size from Population Database


Step 2 - Approaches for Defining Global Market Size (Value, Volume* & Price*)

Note*: In applicable scenarios
Step 3 - Data Sources
Primary Research
- Web Analytics
- Survey Reports
- Research Institute
- Latest Research Reports
- Opinion Leaders
Secondary Research
- Annual Reports
- White Paper
- Latest Press Release
- Industry Association
- Paid Database
- Investor Presentations

Step 4 - Data Triangulation
Involves using different sources of information in order to increase the validity of a study
These sources are likely to be stakeholders in a program - participants, other researchers, program staff, other community members, and so on.
Then we put all data in single framework & apply various statistical tools to find out the dynamic on the market.
During the analysis stage, feedback from the stakeholder groups would be compared to determine areas of agreement as well as areas of divergence