

Key Insights
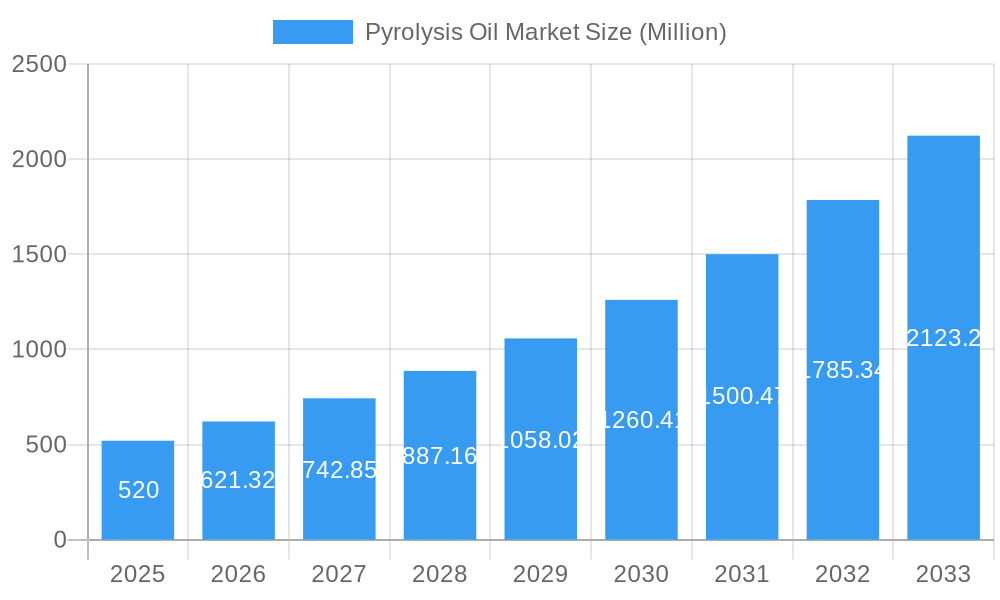
The global pyrolysis oil market, valued at $520 million in 2025, is projected to experience robust growth, driven by increasing environmental concerns and the urgent need for sustainable waste management solutions. A Compound Annual Growth Rate (CAGR) of 19.71% from 2025 to 2033 indicates a significant expansion, reaching an estimated market value exceeding $2.5 billion by 2033. This growth is fueled by several key factors. The rising demand for renewable energy sources and stricter regulations on plastic waste disposal are compelling industries to adopt pyrolysis technology as a viable alternative to traditional fossil fuels. Furthermore, advancements in pyrolysis technology, leading to higher efficiency and lower production costs, are contributing to market expansion. The increasing availability of waste plastic, rubber, and other feedstocks further supports this growth trajectory. The application of pyrolysis oil in the production of fuels and chemicals presents a diverse and expanding market opportunity. While challenges such as high initial investment costs and inconsistent oil quality remain, ongoing technological innovations and supportive government policies are mitigating these restraints. The market is segmented by raw material (waste plastic, waste rubber, wood, oil sludge, and others) and application (fuels and chemicals), offering diverse investment and growth opportunities across the value chain. Leading companies like Green Fuel Nordic Oy, Nexus Circular, and Plastic Energy are actively driving innovation and market penetration.
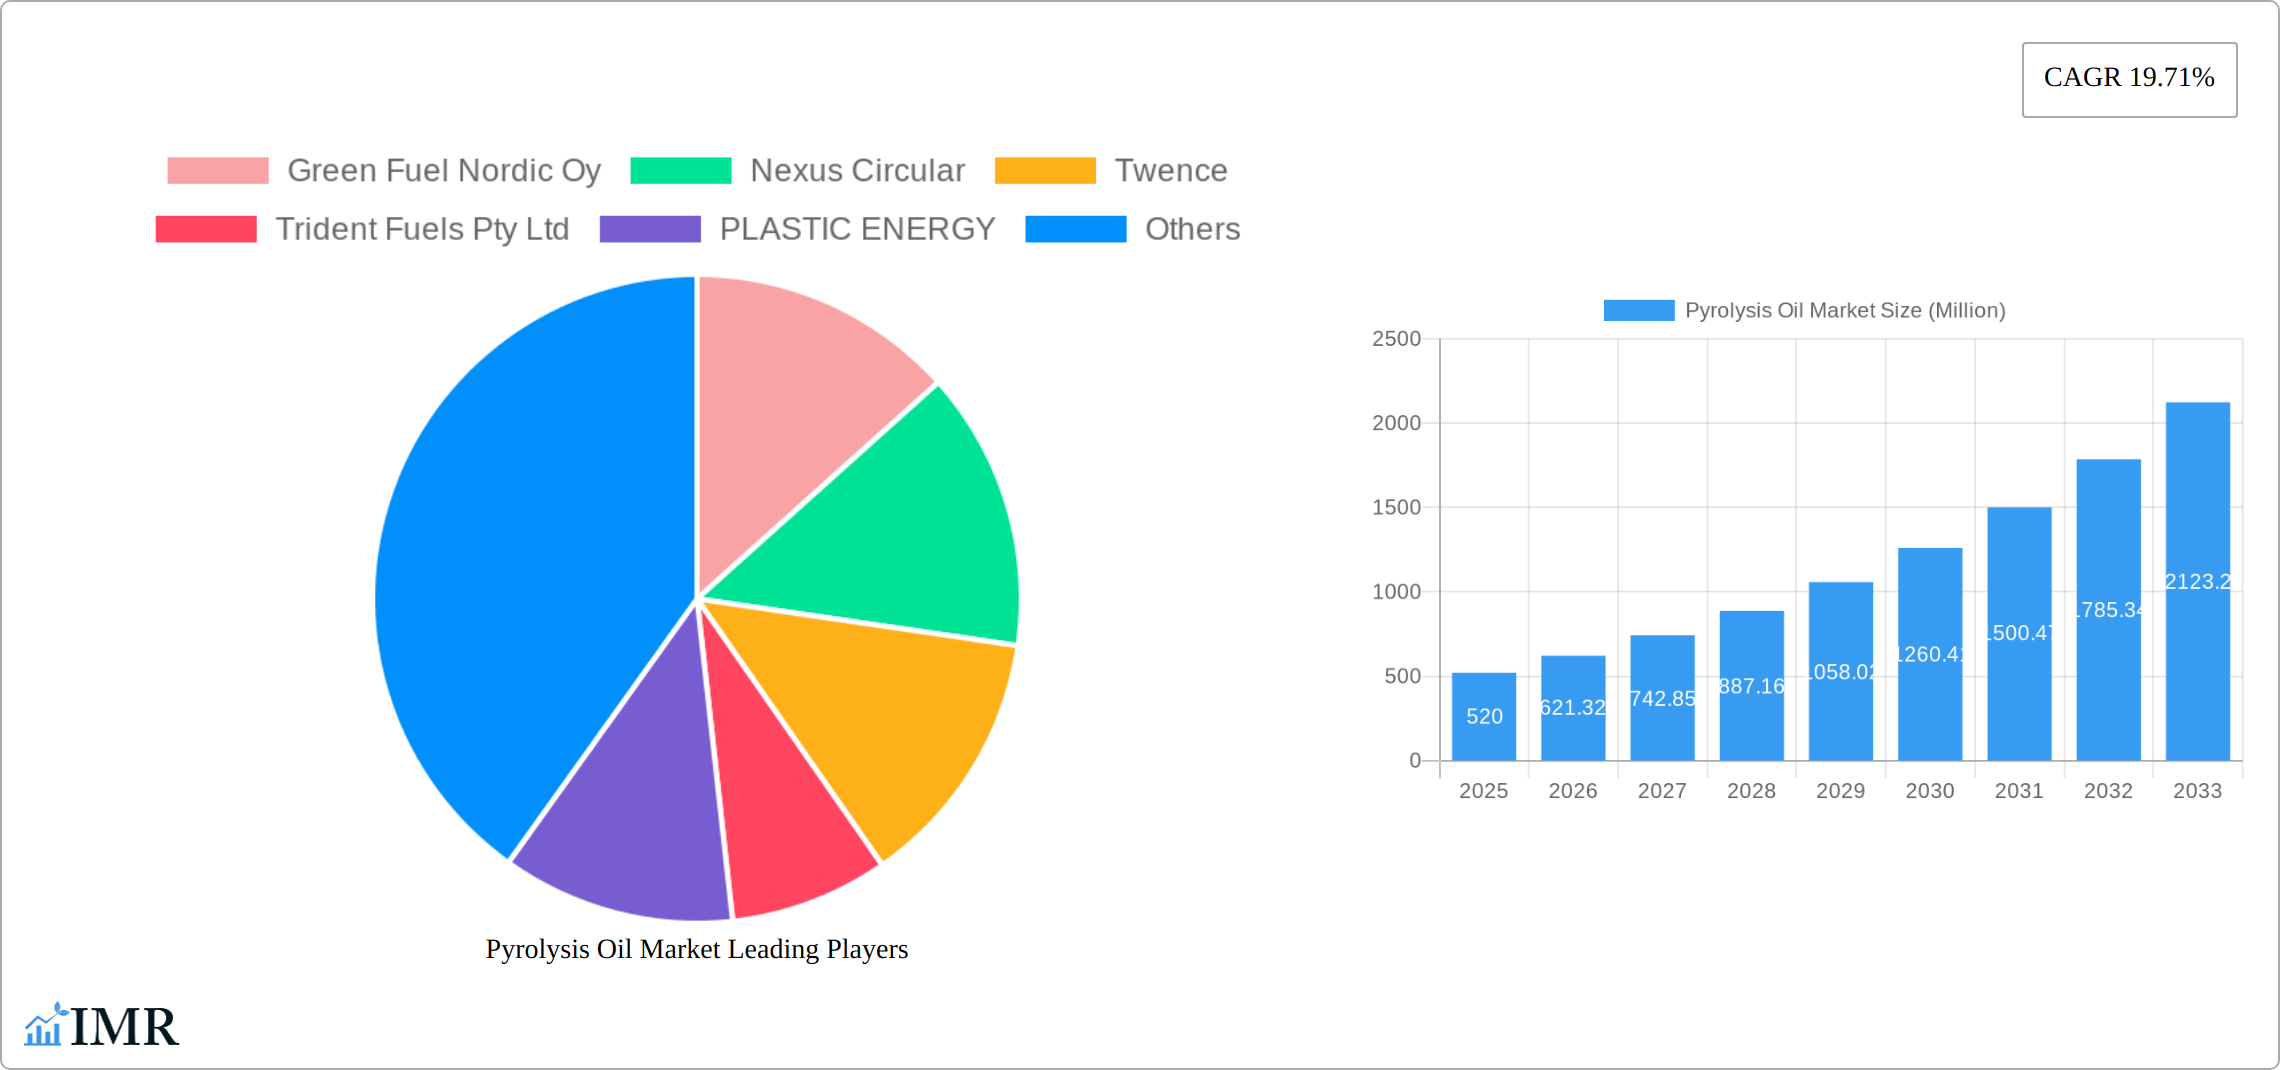
Pyrolysis Oil Market Market Size (In Million)
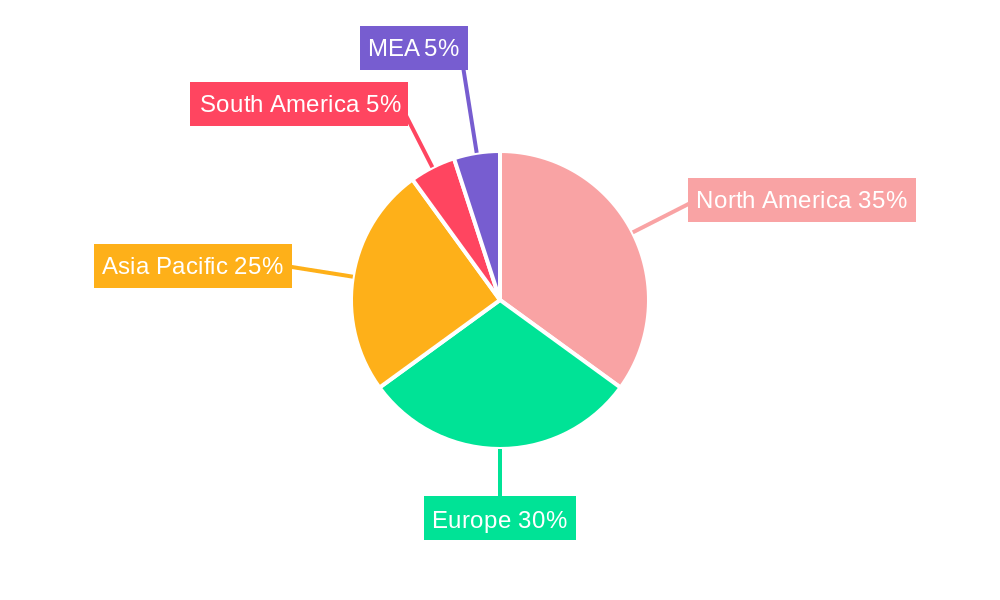
Geographical distribution shows a diversified market, with North America, Europe, and Asia-Pacific emerging as key regions, reflecting variations in waste management practices, environmental regulations, and economic factors. North America's mature recycling infrastructure and stringent environmental policies are driving strong adoption rates. Europe's emphasis on circular economy initiatives fuels demand, while Asia-Pacific's vast population and burgeoning industrial sector create significant growth potential. However, variations in regional regulations and the availability of feedstock will shape the growth trajectories in these regions. Future growth will hinge on continued technological advancements to improve the quality and consistency of pyrolysis oil, coupled with further policy support for renewable energy and sustainable waste management strategies. The increasing focus on circular economy principles and the reduction of carbon emissions will continue to significantly bolster the growth of the pyrolysis oil market.
Pyrolysis Oil Market Company Market Share
Pyrolysis Oil Market: A Comprehensive Report (2019-2033)
This comprehensive report provides a detailed analysis of the Pyrolysis Oil Market, encompassing market dynamics, growth trends, regional dominance, product landscape, key players, and future outlook. With a study period spanning 2019-2033, a base year of 2025, and a forecast period of 2025-2033, this report offers invaluable insights for industry professionals, investors, and stakeholders seeking to understand and capitalize on the opportunities within this rapidly evolving market. The report segments the market by raw material (Waste Plastic, Waste Rubber, Wood, Oil Sludge, Other Raw Materials) and application (Fuels, Chemicals), providing a granular view of market performance across various segments. The market size is estimated to be xx Million in 2025.
Pyrolysis Oil Market Dynamics & Structure
The pyrolysis oil market is characterized by a moderately concentrated structure, with key players such as Green Fuel Nordic Oy, Nexus Circular, and Plastic Energy holding significant market share. However, the market is experiencing an influx of new entrants, driven by increasing demand for sustainable alternatives and technological advancements. Technological innovation, particularly in improving process efficiency and product quality, plays a crucial role in market expansion. Stringent environmental regulations globally are further propelling market growth, while the availability of cost-effective feedstocks, such as waste plastics and rubber, influences market dynamics. Competitive product substitutes, primarily traditional fossil fuels, pose a challenge, but the increasing focus on circular economy principles is gradually shifting the balance in favor of pyrolysis oil. The parent market is the broader biofuel market and this child market benefits from the growing investments in renewable energy and sustainable practices.
- Market Concentration: Moderately concentrated, with top players holding xx% market share in 2025.
- Technological Innovation: Focus on improving yield, reducing energy consumption, and enhancing product quality.
- Regulatory Framework: Stringent environmental regulations driving adoption and investment.
- Competitive Substitutes: Traditional fossil fuels, posing a competitive challenge.
- M&A Trends: Increasing M&A activity, reflecting market consolidation and technological integration. xx deals were recorded between 2019 and 2024.
- End-User Demographics: Primarily focused on the chemical and energy sectors.
Pyrolysis Oil Market Growth Trends & Insights
The pyrolysis oil market is experiencing robust growth, fueled by a confluence of factors. The escalating global demand for sustainable alternatives to fossil fuels and chemicals, coupled with intensifying concerns regarding plastic waste management, is significantly driving market expansion. Technological advancements have yielded more efficient and cost-effective pyrolysis processes, making it a compelling alternative to traditional energy sources. A growing consumer preference for eco-friendly products further bolsters this trend. The market is projected to achieve a CAGR of [Insert CAGR Percentage]% during the forecast period (2025-2033), according to [Insert Specific Data Source, e.g., Grand View Research, Market Research Future]. Market penetration in the chemical sector stands at [Insert Percentage]% in 2025, with projections indicating an increase to [Insert Percentage]% by 2033. Further accelerating growth are technological breakthroughs such as advanced pyrolysis reactor designs and refined product separation techniques. Analysis from [Insert Specific Data Source] demonstrates a strong positive correlation between R&D investment and market expansion. This indicates a robust and dynamic future for the industry.
Dominant Regions, Countries, or Segments in Pyrolysis Oil Market
North America and Europe currently lead the pyrolysis oil market, propelled by stringent environmental regulations and substantial investments in renewable energy infrastructure. Within raw materials, the Waste Plastic segment commands the largest market share, followed by Waste Rubber. While the Fuels segment currently dominates applications, the Chemicals segment exhibits significantly higher growth potential, driven by the surging demand for bio-based chemicals. This shift towards bio-based alternatives reflects a broader move towards sustainability within the chemical industry.
- Key Drivers (North America): Stringent environmental policies, escalating plastic waste generation, and considerable investment in renewable energy initiatives.
- Key Drivers (Europe): The EU's circular economy initiatives, government support for renewable energy technologies, and a strong emphasis on effective waste management strategies.
- Key Drivers (Asia Pacific): Rapid industrialization, a growing demand for sustainable solutions, and supportive government policies (although currently exhibiting slower growth compared to North America and Europe).
- Market Share (Waste Plastic): [Insert Percentage]% in 2025.
- Growth Potential (Chemicals): Projected at a CAGR of [Insert CAGR Percentage]% from 2025 to 2033, exceeding the growth rate of the Fuels segment.
Pyrolysis Oil Market Product Landscape
The pyrolysis oil product landscape is constantly evolving, with ongoing advancements focused on enhancing product quality and expanding application possibilities. Recent innovations include refined oil purification methods that result in higher yields of valuable chemicals and improved fuel characteristics. The key advantage of pyrolysis oil lies in its sustainable nature and its potential to replace fossil fuel-derived products across numerous applications. Technological advancements, such as catalytic and microwave-assisted pyrolysis, are contributing to improved process efficiency and superior product quality, making the technology more attractive for a wider range of industries.
Key Drivers, Barriers & Challenges in Pyrolysis Oil Market
Key Drivers:
- Increasing demand for sustainable fuels and chemicals.
- Stringent environmental regulations and policies promoting waste recycling.
- Technological advancements leading to improved efficiency and cost-effectiveness.
- Growing focus on circular economy principles.
Challenges:
- High capital costs associated with establishing pyrolysis facilities.
- Fluctuations in feedstock availability and quality.
- Competition from traditional fossil fuels.
- Regulatory uncertainties and inconsistencies across different regions.
- Scalability challenges to meet large scale industrial needs. The current market capacity falls short of the demand, impacting prices.
Emerging Opportunities in Pyrolysis Oil Market
Significant emerging opportunities include the development of cutting-edge pyrolysis technologies, exploration of novel feedstock sources, expansion into untapped global markets, and a focus on high-value chemical applications. The increasing interest in carbon capture and utilization (CCU) technologies presents further opportunities for integrating pyrolysis within carbon-negative solutions, thereby addressing climate change concerns. The rising demand for bio-based plastics creates a substantial market opportunity for pyrolysis oil as a sustainable feedstock, further driving growth and innovation in the sector. This convergence of factors indicates a highly promising future for the pyrolysis oil market.
Growth Accelerators in the Pyrolysis Oil Market Industry
Long-term growth will be driven by technological breakthroughs in pyrolysis reactor design and process optimization. Strategic partnerships between waste management companies and chemical producers will play a vital role in expanding market adoption. The continuous expansion into new geographic markets and diversification of feedstock sources will further contribute to long-term growth and market stability. The development of tailored pyrolysis oil products for specific applications will also boost market expansion.
Key Players Shaping the Pyrolysis Oil Market Market
- Green Fuel Nordic Oy
- Nexus Circular
- Twence
- Trident Fuels Pty Ltd
- PLASTIC ENERGY
- Ensyn
- Bioenergy Ae Cote-Nord
- Alterra Energy LLC
- New Energy Kft
- Mk Aromatics Limited
- New Hope Energy
- Quantafuel ASA
- Plastic Advanced Recycling Corp
- Setra Group
Notable Milestones in Pyrolysis Oil Market Sector
- May 2022: ArcelorMittal Mining Canada and BioÉnergie AE Côte-Nord Canada signed a three-year agreement to supply 16 million liters of pyrolytic oil annually to an ArcelorMittal plant. This highlights the growing demand for pyrolysis oil in industrial applications.
- May 2022: New Hope Energy and TotalEnergies partnered to build an advanced recycling plant in Texas, signifying significant investment in the sector and its potential for producing virgin-quality polymers.
- February 2023: Alterra Energy, LLC secured a license agreement to process 192,000 metric tons of plastic waste annually using its pyrolysis technology, demonstrating the scalability and market viability of the technology.
- June 2023: Audi Hungaria’s collaboration with New Energy Kft. to recycle tire waste via pyrolysis underscores the growing adoption of this technology across various industries and waste streams.
In-Depth Pyrolysis Oil Market Market Outlook
The future of the pyrolysis oil market is bright, driven by increasing environmental concerns, technological advancements, and supportive government policies. The market is poised for significant expansion, with opportunities for innovation and diversification across various applications. Strategic partnerships and investments will continue to shape the market landscape, leading to greater efficiency, cost-effectiveness, and widespread adoption of pyrolysis technology. The focus on circular economy principles will further reinforce the long-term growth potential of the pyrolysis oil market. The market is expected to witness a substantial increase in production capacity and market penetration across various regions in the coming years.
Pyrolysis Oil Market Segmentation
-
1. Raw Material
- 1.1. Waste Plastic
- 1.2. Waste Rubber
- 1.3. Wood
- 1.4. Oil Sludge
- 1.5. Other Raw Materials
-
2. Application
- 2.1. Fuels
- 2.2. Chemicals
Pyrolysis Oil Market Segmentation By Geography
-
1. Asia Pacific
- 1.1. China
- 1.2. India
- 1.3. Japan
- 1.4. Thailand
- 1.5. Vietnam
- 1.6. Malaysia
- 1.7. Indonesia
- 1.8. South Korea
- 1.9. Rest of Asia Pacific
-
2. North America
- 2.1. United States
- 2.2. Canada
- 2.3. Mexico
-
3. Europe
- 3.1. Germany
- 3.2. France
- 3.3. United Kingdom
- 3.4. Italy
- 3.5. NORDIC
- 3.6. Spain
- 3.7. Turkey
- 3.8. Russia
- 3.9. Rest of Europe
-
4. South America
- 4.1. Brazil
- 4.2. Argentina
- 4.3. Colombia
- 4.4. Rest of South America
-
5. Middle East and Africa
- 5.1. Saudi Arabia
- 5.2. South Africa
- 5.3. Morocco
- 5.4. Qatar
- 5.5. Egypt
- 5.6. United Arab Emirates
- 5.7. Nigeria
- 5.8. Rest of Middle East and Africa
Pyrolysis Oil Market Regional Market Share
Geographic Coverage of Pyrolysis Oil Market
Pyrolysis Oil Market REPORT HIGHLIGHTS
| Aspects | Details |
|---|---|
| Study Period | 2020-2034 |
| Base Year | 2025 |
| Estimated Year | 2026 |
| Forecast Period | 2026-2034 |
| Historical Period | 2020-2025 |
| Growth Rate | CAGR of 19.71% from 2020-2034 |
| Segmentation |
|
Table of Contents
- 1. Introduction
- 1.1. Research Scope
- 1.2. Market Segmentation
- 1.3. Research Objective
- 1.4. Definitions and Assumptions
- 2. Executive Summary
- 2.1. Market Snapshot
- 3. Market Dynamics
- 3.1. Market Drivers
- 3.2. Market Restrains
- 3.3. Market Trends
- 3.4. Market Opportunities
- 4. Market Factor Analysis
- 4.1. Porters Five Forces
- 4.1.1. Bargaining Power of Suppliers
- 4.1.2. Bargaining Power of Buyers
- 4.1.3. Threat of New Entrants
- 4.1.4. Threat of Substitutes
- 4.1.5. Competitive Rivalry
- 4.2. PESTEL analysis
- 4.3. BCG Analysis
- 4.3.1. Stars (High Growth, High Market Share)
- 4.3.2. Cash Cows (Low Growth, High Market Share)
- 4.3.3. Question Mark (High Growth, Low Market Share)
- 4.3.4. Dogs (Low Growth, Low Market Share)
- 4.4. Ansoff Matrix Analysis
- 4.5. Supply Chain Analysis
- 4.6. Regulatory Landscape
- 4.7. Current Market Potential and Opportunity Assessment (TAM–SAM–SOM Framework)
- 4.8. IMR Analyst Note
- 4.1. Porters Five Forces
- 5. Market Analysis, Insights and Forecast 2021-2033
- 5.1. Market Analysis, Insights and Forecast - by Raw Material
- 5.1.1. Waste Plastic
- 5.1.2. Waste Rubber
- 5.1.3. Wood
- 5.1.4. Oil Sludge
- 5.1.5. Other Raw Materials
- 5.2. Market Analysis, Insights and Forecast - by Application
- 5.2.1. Fuels
- 5.2.2. Chemicals
- 5.3. Market Analysis, Insights and Forecast - by Region
- 5.3.1. Asia Pacific
- 5.3.2. North America
- 5.3.3. Europe
- 5.3.4. South America
- 5.3.5. Middle East and Africa
- 5.1. Market Analysis, Insights and Forecast - by Raw Material
- 6. Global Pyrolysis Oil Market Analysis, Insights and Forecast, 2021-2033
- 6.1. Market Analysis, Insights and Forecast - by Raw Material
- 6.1.1. Waste Plastic
- 6.1.2. Waste Rubber
- 6.1.3. Wood
- 6.1.4. Oil Sludge
- 6.1.5. Other Raw Materials
- 6.2. Market Analysis, Insights and Forecast - by Application
- 6.2.1. Fuels
- 6.2.2. Chemicals
- 6.1. Market Analysis, Insights and Forecast - by Raw Material
- 7. Asia Pacific Pyrolysis Oil Market Analysis, Insights and Forecast, 2020-2032
- 7.1. Market Analysis, Insights and Forecast - by Raw Material
- 7.1.1. Waste Plastic
- 7.1.2. Waste Rubber
- 7.1.3. Wood
- 7.1.4. Oil Sludge
- 7.1.5. Other Raw Materials
- 7.2. Market Analysis, Insights and Forecast - by Application
- 7.2.1. Fuels
- 7.2.2. Chemicals
- 7.1. Market Analysis, Insights and Forecast - by Raw Material
- 8. North America Pyrolysis Oil Market Analysis, Insights and Forecast, 2020-2032
- 8.1. Market Analysis, Insights and Forecast - by Raw Material
- 8.1.1. Waste Plastic
- 8.1.2. Waste Rubber
- 8.1.3. Wood
- 8.1.4. Oil Sludge
- 8.1.5. Other Raw Materials
- 8.2. Market Analysis, Insights and Forecast - by Application
- 8.2.1. Fuels
- 8.2.2. Chemicals
- 8.1. Market Analysis, Insights and Forecast - by Raw Material
- 9. Europe Pyrolysis Oil Market Analysis, Insights and Forecast, 2020-2032
- 9.1. Market Analysis, Insights and Forecast - by Raw Material
- 9.1.1. Waste Plastic
- 9.1.2. Waste Rubber
- 9.1.3. Wood
- 9.1.4. Oil Sludge
- 9.1.5. Other Raw Materials
- 9.2. Market Analysis, Insights and Forecast - by Application
- 9.2.1. Fuels
- 9.2.2. Chemicals
- 9.1. Market Analysis, Insights and Forecast - by Raw Material
- 10. South America Pyrolysis Oil Market Analysis, Insights and Forecast, 2020-2032
- 10.1. Market Analysis, Insights and Forecast - by Raw Material
- 10.1.1. Waste Plastic
- 10.1.2. Waste Rubber
- 10.1.3. Wood
- 10.1.4. Oil Sludge
- 10.1.5. Other Raw Materials
- 10.2. Market Analysis, Insights and Forecast - by Application
- 10.2.1. Fuels
- 10.2.2. Chemicals
- 10.1. Market Analysis, Insights and Forecast - by Raw Material
- 11. Middle East and Africa Pyrolysis Oil Market Analysis, Insights and Forecast, 2020-2032
- 11.1. Market Analysis, Insights and Forecast - by Raw Material
- 11.1.1. Waste Plastic
- 11.1.2. Waste Rubber
- 11.1.3. Wood
- 11.1.4. Oil Sludge
- 11.1.5. Other Raw Materials
- 11.2. Market Analysis, Insights and Forecast - by Application
- 11.2.1. Fuels
- 11.2.2. Chemicals
- 11.1. Market Analysis, Insights and Forecast - by Raw Material
- 12. Competitive Analysis
- 12.1. Company Profiles
- 12.1.1 Green Fuel Nordic Oy
- 12.1.1.1. Company Overview
- 12.1.1.2. Products
- 12.1.1.3. Company Financials
- 12.1.1.4. SWOT Analysis
- 12.1.2 Nexus Circular
- 12.1.2.1. Company Overview
- 12.1.2.2. Products
- 12.1.2.3. Company Financials
- 12.1.2.4. SWOT Analysis
- 12.1.3 Twence
- 12.1.3.1. Company Overview
- 12.1.3.2. Products
- 12.1.3.3. Company Financials
- 12.1.3.4. SWOT Analysis
- 12.1.4 Trident Fuels Pty Ltd
- 12.1.4.1. Company Overview
- 12.1.4.2. Products
- 12.1.4.3. Company Financials
- 12.1.4.4. SWOT Analysis
- 12.1.5 PLASTIC ENERGY
- 12.1.5.1. Company Overview
- 12.1.5.2. Products
- 12.1.5.3. Company Financials
- 12.1.5.4. SWOT Analysis
- 12.1.6 Ensyn
- 12.1.6.1. Company Overview
- 12.1.6.2. Products
- 12.1.6.3. Company Financials
- 12.1.6.4. SWOT Analysis
- 12.1.7 Bioenergy Ae Cote-Nord
- 12.1.7.1. Company Overview
- 12.1.7.2. Products
- 12.1.7.3. Company Financials
- 12.1.7.4. SWOT Analysis
- 12.1.8 Alterra Energy LLC
- 12.1.8.1. Company Overview
- 12.1.8.2. Products
- 12.1.8.3. Company Financials
- 12.1.8.4. SWOT Analysis
- 12.1.9 New Energy Kft
- 12.1.9.1. Company Overview
- 12.1.9.2. Products
- 12.1.9.3. Company Financials
- 12.1.9.4. SWOT Analysis
- 12.1.10 Mk Aromatics Limited
- 12.1.10.1. Company Overview
- 12.1.10.2. Products
- 12.1.10.3. Company Financials
- 12.1.10.4. SWOT Analysis
- 12.1.11 New Hope Energy
- 12.1.11.1. Company Overview
- 12.1.11.2. Products
- 12.1.11.3. Company Financials
- 12.1.11.4. SWOT Analysis
- 12.1.12 Quantafuel ASA
- 12.1.12.1. Company Overview
- 12.1.12.2. Products
- 12.1.12.3. Company Financials
- 12.1.12.4. SWOT Analysis
- 12.1.13 Plastic Advanced Recycling Corp
- 12.1.13.1. Company Overview
- 12.1.13.2. Products
- 12.1.13.3. Company Financials
- 12.1.13.4. SWOT Analysis
- 12.1.14 Setra Group
- 12.1.14.1. Company Overview
- 12.1.14.2. Products
- 12.1.14.3. Company Financials
- 12.1.14.4. SWOT Analysis
- 12.1.1 Green Fuel Nordic Oy
- 12.2. Market Entropy
- 12.2.1 Company's Key Areas Served
- 12.2.2 Recent Developments
- 12.3. Company Market Share Analysis 2025
- 12.3.1 Top 5 Companies Market Share Analysis
- 12.3.2 Top 3 Companies Market Share Analysis
- 12.4. List of Potential Customers
- 13. Research Methodology
List of Figures
- Figure 1: Global Pyrolysis Oil Market Revenue Breakdown (Million, %) by Region 2025 & 2033
- Figure 2: Global Pyrolysis Oil Market Volume Breakdown (K Tons, %) by Region 2025 & 2033
- Figure 3: Asia Pacific Pyrolysis Oil Market Revenue (Million), by Raw Material 2025 & 2033
- Figure 4: Asia Pacific Pyrolysis Oil Market Volume (K Tons), by Raw Material 2025 & 2033
- Figure 5: Asia Pacific Pyrolysis Oil Market Revenue Share (%), by Raw Material 2025 & 2033
- Figure 6: Asia Pacific Pyrolysis Oil Market Volume Share (%), by Raw Material 2025 & 2033
- Figure 7: Asia Pacific Pyrolysis Oil Market Revenue (Million), by Application 2025 & 2033
- Figure 8: Asia Pacific Pyrolysis Oil Market Volume (K Tons), by Application 2025 & 2033
- Figure 9: Asia Pacific Pyrolysis Oil Market Revenue Share (%), by Application 2025 & 2033
- Figure 10: Asia Pacific Pyrolysis Oil Market Volume Share (%), by Application 2025 & 2033
- Figure 11: Asia Pacific Pyrolysis Oil Market Revenue (Million), by Country 2025 & 2033
- Figure 12: Asia Pacific Pyrolysis Oil Market Volume (K Tons), by Country 2025 & 2033
- Figure 13: Asia Pacific Pyrolysis Oil Market Revenue Share (%), by Country 2025 & 2033
- Figure 14: Asia Pacific Pyrolysis Oil Market Volume Share (%), by Country 2025 & 2033
- Figure 15: North America Pyrolysis Oil Market Revenue (Million), by Raw Material 2025 & 2033
- Figure 16: North America Pyrolysis Oil Market Volume (K Tons), by Raw Material 2025 & 2033
- Figure 17: North America Pyrolysis Oil Market Revenue Share (%), by Raw Material 2025 & 2033
- Figure 18: North America Pyrolysis Oil Market Volume Share (%), by Raw Material 2025 & 2033
- Figure 19: North America Pyrolysis Oil Market Revenue (Million), by Application 2025 & 2033
- Figure 20: North America Pyrolysis Oil Market Volume (K Tons), by Application 2025 & 2033
- Figure 21: North America Pyrolysis Oil Market Revenue Share (%), by Application 2025 & 2033
- Figure 22: North America Pyrolysis Oil Market Volume Share (%), by Application 2025 & 2033
- Figure 23: North America Pyrolysis Oil Market Revenue (Million), by Country 2025 & 2033
- Figure 24: North America Pyrolysis Oil Market Volume (K Tons), by Country 2025 & 2033
- Figure 25: North America Pyrolysis Oil Market Revenue Share (%), by Country 2025 & 2033
- Figure 26: North America Pyrolysis Oil Market Volume Share (%), by Country 2025 & 2033
- Figure 27: Europe Pyrolysis Oil Market Revenue (Million), by Raw Material 2025 & 2033
- Figure 28: Europe Pyrolysis Oil Market Volume (K Tons), by Raw Material 2025 & 2033
- Figure 29: Europe Pyrolysis Oil Market Revenue Share (%), by Raw Material 2025 & 2033
- Figure 30: Europe Pyrolysis Oil Market Volume Share (%), by Raw Material 2025 & 2033
- Figure 31: Europe Pyrolysis Oil Market Revenue (Million), by Application 2025 & 2033
- Figure 32: Europe Pyrolysis Oil Market Volume (K Tons), by Application 2025 & 2033
- Figure 33: Europe Pyrolysis Oil Market Revenue Share (%), by Application 2025 & 2033
- Figure 34: Europe Pyrolysis Oil Market Volume Share (%), by Application 2025 & 2033
- Figure 35: Europe Pyrolysis Oil Market Revenue (Million), by Country 2025 & 2033
- Figure 36: Europe Pyrolysis Oil Market Volume (K Tons), by Country 2025 & 2033
- Figure 37: Europe Pyrolysis Oil Market Revenue Share (%), by Country 2025 & 2033
- Figure 38: Europe Pyrolysis Oil Market Volume Share (%), by Country 2025 & 2033
- Figure 39: South America Pyrolysis Oil Market Revenue (Million), by Raw Material 2025 & 2033
- Figure 40: South America Pyrolysis Oil Market Volume (K Tons), by Raw Material 2025 & 2033
- Figure 41: South America Pyrolysis Oil Market Revenue Share (%), by Raw Material 2025 & 2033
- Figure 42: South America Pyrolysis Oil Market Volume Share (%), by Raw Material 2025 & 2033
- Figure 43: South America Pyrolysis Oil Market Revenue (Million), by Application 2025 & 2033
- Figure 44: South America Pyrolysis Oil Market Volume (K Tons), by Application 2025 & 2033
- Figure 45: South America Pyrolysis Oil Market Revenue Share (%), by Application 2025 & 2033
- Figure 46: South America Pyrolysis Oil Market Volume Share (%), by Application 2025 & 2033
- Figure 47: South America Pyrolysis Oil Market Revenue (Million), by Country 2025 & 2033
- Figure 48: South America Pyrolysis Oil Market Volume (K Tons), by Country 2025 & 2033
- Figure 49: South America Pyrolysis Oil Market Revenue Share (%), by Country 2025 & 2033
- Figure 50: South America Pyrolysis Oil Market Volume Share (%), by Country 2025 & 2033
- Figure 51: Middle East and Africa Pyrolysis Oil Market Revenue (Million), by Raw Material 2025 & 2033
- Figure 52: Middle East and Africa Pyrolysis Oil Market Volume (K Tons), by Raw Material 2025 & 2033
- Figure 53: Middle East and Africa Pyrolysis Oil Market Revenue Share (%), by Raw Material 2025 & 2033
- Figure 54: Middle East and Africa Pyrolysis Oil Market Volume Share (%), by Raw Material 2025 & 2033
- Figure 55: Middle East and Africa Pyrolysis Oil Market Revenue (Million), by Application 2025 & 2033
- Figure 56: Middle East and Africa Pyrolysis Oil Market Volume (K Tons), by Application 2025 & 2033
- Figure 57: Middle East and Africa Pyrolysis Oil Market Revenue Share (%), by Application 2025 & 2033
- Figure 58: Middle East and Africa Pyrolysis Oil Market Volume Share (%), by Application 2025 & 2033
- Figure 59: Middle East and Africa Pyrolysis Oil Market Revenue (Million), by Country 2025 & 2033
- Figure 60: Middle East and Africa Pyrolysis Oil Market Volume (K Tons), by Country 2025 & 2033
- Figure 61: Middle East and Africa Pyrolysis Oil Market Revenue Share (%), by Country 2025 & 2033
- Figure 62: Middle East and Africa Pyrolysis Oil Market Volume Share (%), by Country 2025 & 2033
List of Tables
- Table 1: Global Pyrolysis Oil Market Revenue Million Forecast, by Raw Material 2020 & 2033
- Table 2: Global Pyrolysis Oil Market Volume K Tons Forecast, by Raw Material 2020 & 2033
- Table 3: Global Pyrolysis Oil Market Revenue Million Forecast, by Application 2020 & 2033
- Table 4: Global Pyrolysis Oil Market Volume K Tons Forecast, by Application 2020 & 2033
- Table 5: Global Pyrolysis Oil Market Revenue Million Forecast, by Region 2020 & 2033
- Table 6: Global Pyrolysis Oil Market Volume K Tons Forecast, by Region 2020 & 2033
- Table 7: Global Pyrolysis Oil Market Revenue Million Forecast, by Raw Material 2020 & 2033
- Table 8: Global Pyrolysis Oil Market Volume K Tons Forecast, by Raw Material 2020 & 2033
- Table 9: Global Pyrolysis Oil Market Revenue Million Forecast, by Application 2020 & 2033
- Table 10: Global Pyrolysis Oil Market Volume K Tons Forecast, by Application 2020 & 2033
- Table 11: Global Pyrolysis Oil Market Revenue Million Forecast, by Country 2020 & 2033
- Table 12: Global Pyrolysis Oil Market Volume K Tons Forecast, by Country 2020 & 2033
- Table 13: China Pyrolysis Oil Market Revenue (Million) Forecast, by Application 2020 & 2033
- Table 14: China Pyrolysis Oil Market Volume (K Tons) Forecast, by Application 2020 & 2033
- Table 15: India Pyrolysis Oil Market Revenue (Million) Forecast, by Application 2020 & 2033
- Table 16: India Pyrolysis Oil Market Volume (K Tons) Forecast, by Application 2020 & 2033
- Table 17: Japan Pyrolysis Oil Market Revenue (Million) Forecast, by Application 2020 & 2033
- Table 18: Japan Pyrolysis Oil Market Volume (K Tons) Forecast, by Application 2020 & 2033
- Table 19: Thailand Pyrolysis Oil Market Revenue (Million) Forecast, by Application 2020 & 2033
- Table 20: Thailand Pyrolysis Oil Market Volume (K Tons) Forecast, by Application 2020 & 2033
- Table 21: Vietnam Pyrolysis Oil Market Revenue (Million) Forecast, by Application 2020 & 2033
- Table 22: Vietnam Pyrolysis Oil Market Volume (K Tons) Forecast, by Application 2020 & 2033
- Table 23: Malaysia Pyrolysis Oil Market Revenue (Million) Forecast, by Application 2020 & 2033
- Table 24: Malaysia Pyrolysis Oil Market Volume (K Tons) Forecast, by Application 2020 & 2033
- Table 25: Indonesia Pyrolysis Oil Market Revenue (Million) Forecast, by Application 2020 & 2033
- Table 26: Indonesia Pyrolysis Oil Market Volume (K Tons) Forecast, by Application 2020 & 2033
- Table 27: South Korea Pyrolysis Oil Market Revenue (Million) Forecast, by Application 2020 & 2033
- Table 28: South Korea Pyrolysis Oil Market Volume (K Tons) Forecast, by Application 2020 & 2033
- Table 29: Rest of Asia Pacific Pyrolysis Oil Market Revenue (Million) Forecast, by Application 2020 & 2033
- Table 30: Rest of Asia Pacific Pyrolysis Oil Market Volume (K Tons) Forecast, by Application 2020 & 2033
- Table 31: Global Pyrolysis Oil Market Revenue Million Forecast, by Raw Material 2020 & 2033
- Table 32: Global Pyrolysis Oil Market Volume K Tons Forecast, by Raw Material 2020 & 2033
- Table 33: Global Pyrolysis Oil Market Revenue Million Forecast, by Application 2020 & 2033
- Table 34: Global Pyrolysis Oil Market Volume K Tons Forecast, by Application 2020 & 2033
- Table 35: Global Pyrolysis Oil Market Revenue Million Forecast, by Country 2020 & 2033
- Table 36: Global Pyrolysis Oil Market Volume K Tons Forecast, by Country 2020 & 2033
- Table 37: United States Pyrolysis Oil Market Revenue (Million) Forecast, by Application 2020 & 2033
- Table 38: United States Pyrolysis Oil Market Volume (K Tons) Forecast, by Application 2020 & 2033
- Table 39: Canada Pyrolysis Oil Market Revenue (Million) Forecast, by Application 2020 & 2033
- Table 40: Canada Pyrolysis Oil Market Volume (K Tons) Forecast, by Application 2020 & 2033
- Table 41: Mexico Pyrolysis Oil Market Revenue (Million) Forecast, by Application 2020 & 2033
- Table 42: Mexico Pyrolysis Oil Market Volume (K Tons) Forecast, by Application 2020 & 2033
- Table 43: Global Pyrolysis Oil Market Revenue Million Forecast, by Raw Material 2020 & 2033
- Table 44: Global Pyrolysis Oil Market Volume K Tons Forecast, by Raw Material 2020 & 2033
- Table 45: Global Pyrolysis Oil Market Revenue Million Forecast, by Application 2020 & 2033
- Table 46: Global Pyrolysis Oil Market Volume K Tons Forecast, by Application 2020 & 2033
- Table 47: Global Pyrolysis Oil Market Revenue Million Forecast, by Country 2020 & 2033
- Table 48: Global Pyrolysis Oil Market Volume K Tons Forecast, by Country 2020 & 2033
- Table 49: Germany Pyrolysis Oil Market Revenue (Million) Forecast, by Application 2020 & 2033
- Table 50: Germany Pyrolysis Oil Market Volume (K Tons) Forecast, by Application 2020 & 2033
- Table 51: France Pyrolysis Oil Market Revenue (Million) Forecast, by Application 2020 & 2033
- Table 52: France Pyrolysis Oil Market Volume (K Tons) Forecast, by Application 2020 & 2033
- Table 53: United Kingdom Pyrolysis Oil Market Revenue (Million) Forecast, by Application 2020 & 2033
- Table 54: United Kingdom Pyrolysis Oil Market Volume (K Tons) Forecast, by Application 2020 & 2033
- Table 55: Italy Pyrolysis Oil Market Revenue (Million) Forecast, by Application 2020 & 2033
- Table 56: Italy Pyrolysis Oil Market Volume (K Tons) Forecast, by Application 2020 & 2033
- Table 57: NORDIC Pyrolysis Oil Market Revenue (Million) Forecast, by Application 2020 & 2033
- Table 58: NORDIC Pyrolysis Oil Market Volume (K Tons) Forecast, by Application 2020 & 2033
- Table 59: Spain Pyrolysis Oil Market Revenue (Million) Forecast, by Application 2020 & 2033
- Table 60: Spain Pyrolysis Oil Market Volume (K Tons) Forecast, by Application 2020 & 2033
- Table 61: Turkey Pyrolysis Oil Market Revenue (Million) Forecast, by Application 2020 & 2033
- Table 62: Turkey Pyrolysis Oil Market Volume (K Tons) Forecast, by Application 2020 & 2033
- Table 63: Russia Pyrolysis Oil Market Revenue (Million) Forecast, by Application 2020 & 2033
- Table 64: Russia Pyrolysis Oil Market Volume (K Tons) Forecast, by Application 2020 & 2033
- Table 65: Rest of Europe Pyrolysis Oil Market Revenue (Million) Forecast, by Application 2020 & 2033
- Table 66: Rest of Europe Pyrolysis Oil Market Volume (K Tons) Forecast, by Application 2020 & 2033
- Table 67: Global Pyrolysis Oil Market Revenue Million Forecast, by Raw Material 2020 & 2033
- Table 68: Global Pyrolysis Oil Market Volume K Tons Forecast, by Raw Material 2020 & 2033
- Table 69: Global Pyrolysis Oil Market Revenue Million Forecast, by Application 2020 & 2033
- Table 70: Global Pyrolysis Oil Market Volume K Tons Forecast, by Application 2020 & 2033
- Table 71: Global Pyrolysis Oil Market Revenue Million Forecast, by Country 2020 & 2033
- Table 72: Global Pyrolysis Oil Market Volume K Tons Forecast, by Country 2020 & 2033
- Table 73: Brazil Pyrolysis Oil Market Revenue (Million) Forecast, by Application 2020 & 2033
- Table 74: Brazil Pyrolysis Oil Market Volume (K Tons) Forecast, by Application 2020 & 2033
- Table 75: Argentina Pyrolysis Oil Market Revenue (Million) Forecast, by Application 2020 & 2033
- Table 76: Argentina Pyrolysis Oil Market Volume (K Tons) Forecast, by Application 2020 & 2033
- Table 77: Colombia Pyrolysis Oil Market Revenue (Million) Forecast, by Application 2020 & 2033
- Table 78: Colombia Pyrolysis Oil Market Volume (K Tons) Forecast, by Application 2020 & 2033
- Table 79: Rest of South America Pyrolysis Oil Market Revenue (Million) Forecast, by Application 2020 & 2033
- Table 80: Rest of South America Pyrolysis Oil Market Volume (K Tons) Forecast, by Application 2020 & 2033
- Table 81: Global Pyrolysis Oil Market Revenue Million Forecast, by Raw Material 2020 & 2033
- Table 82: Global Pyrolysis Oil Market Volume K Tons Forecast, by Raw Material 2020 & 2033
- Table 83: Global Pyrolysis Oil Market Revenue Million Forecast, by Application 2020 & 2033
- Table 84: Global Pyrolysis Oil Market Volume K Tons Forecast, by Application 2020 & 2033
- Table 85: Global Pyrolysis Oil Market Revenue Million Forecast, by Country 2020 & 2033
- Table 86: Global Pyrolysis Oil Market Volume K Tons Forecast, by Country 2020 & 2033
- Table 87: Saudi Arabia Pyrolysis Oil Market Revenue (Million) Forecast, by Application 2020 & 2033
- Table 88: Saudi Arabia Pyrolysis Oil Market Volume (K Tons) Forecast, by Application 2020 & 2033
- Table 89: South Africa Pyrolysis Oil Market Revenue (Million) Forecast, by Application 2020 & 2033
- Table 90: South Africa Pyrolysis Oil Market Volume (K Tons) Forecast, by Application 2020 & 2033
- Table 91: Morocco Pyrolysis Oil Market Revenue (Million) Forecast, by Application 2020 & 2033
- Table 92: Morocco Pyrolysis Oil Market Volume (K Tons) Forecast, by Application 2020 & 2033
- Table 93: Qatar Pyrolysis Oil Market Revenue (Million) Forecast, by Application 2020 & 2033
- Table 94: Qatar Pyrolysis Oil Market Volume (K Tons) Forecast, by Application 2020 & 2033
- Table 95: Egypt Pyrolysis Oil Market Revenue (Million) Forecast, by Application 2020 & 2033
- Table 96: Egypt Pyrolysis Oil Market Volume (K Tons) Forecast, by Application 2020 & 2033
- Table 97: United Arab Emirates Pyrolysis Oil Market Revenue (Million) Forecast, by Application 2020 & 2033
- Table 98: United Arab Emirates Pyrolysis Oil Market Volume (K Tons) Forecast, by Application 2020 & 2033
- Table 99: Nigeria Pyrolysis Oil Market Revenue (Million) Forecast, by Application 2020 & 2033
- Table 100: Nigeria Pyrolysis Oil Market Volume (K Tons) Forecast, by Application 2020 & 2033
- Table 101: Rest of Middle East and Africa Pyrolysis Oil Market Revenue (Million) Forecast, by Application 2020 & 2033
- Table 102: Rest of Middle East and Africa Pyrolysis Oil Market Volume (K Tons) Forecast, by Application 2020 & 2033
Frequently Asked Questions
1. What is the projected Compound Annual Growth Rate (CAGR) of the Pyrolysis Oil Market?
The projected CAGR is approximately 19.71%.
2. Which companies are prominent players in the Pyrolysis Oil Market?
Key companies in the market include Green Fuel Nordic Oy, Nexus Circular, Twence, Trident Fuels Pty Ltd, PLASTIC ENERGY, Ensyn, Bioenergy Ae Cote-Nord, Alterra Energy LLC, New Energy Kft, Mk Aromatics Limited, New Hope Energy, Quantafuel ASA, Plastic Advanced Recycling Corp, Setra Group.
3. What are the main segments of the Pyrolysis Oil Market?
The market segments include Raw Material, Application.
4. Can you provide details about the market size?
The market size is estimated to be USD 0.52 Million as of 2022.
5. What are some drivers contributing to market growth?
Rising Demand For Environment-friendly Fuel and Raw Material Alternatives; Increasing Demand From Heat and Power Generation Sectors.
6. What are the notable trends driving market growth?
Increasing Demand for Fuel Application.
7. Are there any restraints impacting market growth?
Problems Associated With Storage. Transportation. and Application of Pyrolysis Oil.
8. Can you provide examples of recent developments in the market?
June 2023: Audi Hungaria announced its cooperation with New Energy Kft. to deal with tire waste generated at Audi’s Gyor plant. The process for recycling tire waste was pyrolysis, in which tire waste is chemically converted into oil that petrochemical companies can use to produce new plastics, while the resulting recovered carbon black is utilized in tire production.
9. What pricing options are available for accessing the report?
Pricing options include single-user, multi-user, and enterprise licenses priced at USD 4750, USD 5250, and USD 8750 respectively.
10. Is the market size provided in terms of value or volume?
The market size is provided in terms of value, measured in Million and volume, measured in K Tons.
11. Are there any specific market keywords associated with the report?
Yes, the market keyword associated with the report is "Pyrolysis Oil Market," which aids in identifying and referencing the specific market segment covered.
12. How do I determine which pricing option suits my needs best?
The pricing options vary based on user requirements and access needs. Individual users may opt for single-user licenses, while businesses requiring broader access may choose multi-user or enterprise licenses for cost-effective access to the report.
13. Are there any additional resources or data provided in the Pyrolysis Oil Market report?
While the report offers comprehensive insights, it's advisable to review the specific contents or supplementary materials provided to ascertain if additional resources or data are available.
14. How can I stay updated on further developments or reports in the Pyrolysis Oil Market?
To stay informed about further developments, trends, and reports in the Pyrolysis Oil Market, consider subscribing to industry newsletters, following relevant companies and organizations, or regularly checking reputable industry news sources and publications.
Methodology
Step 1 - Identification of Relevant Samples Size from Population Database


Step 2 - Approaches for Defining Global Market Size (Value, Volume* & Price*)

Note*: In applicable scenarios
Step 3 - Data Sources
Primary Research
- Web Analytics
- Survey Reports
- Research Institute
- Latest Research Reports
- Opinion Leaders
Secondary Research
- Annual Reports
- White Paper
- Latest Press Release
- Industry Association
- Paid Database
- Investor Presentations

Step 4 - Data Triangulation
Involves using different sources of information in order to increase the validity of a study
These sources are likely to be stakeholders in a program - participants, other researchers, program staff, other community members, and so on.
Then we put all data in single framework & apply various statistical tools to find out the dynamic on the market.
During the analysis stage, feedback from the stakeholder groups would be compared to determine areas of agreement as well as areas of divergence