

Key Insights
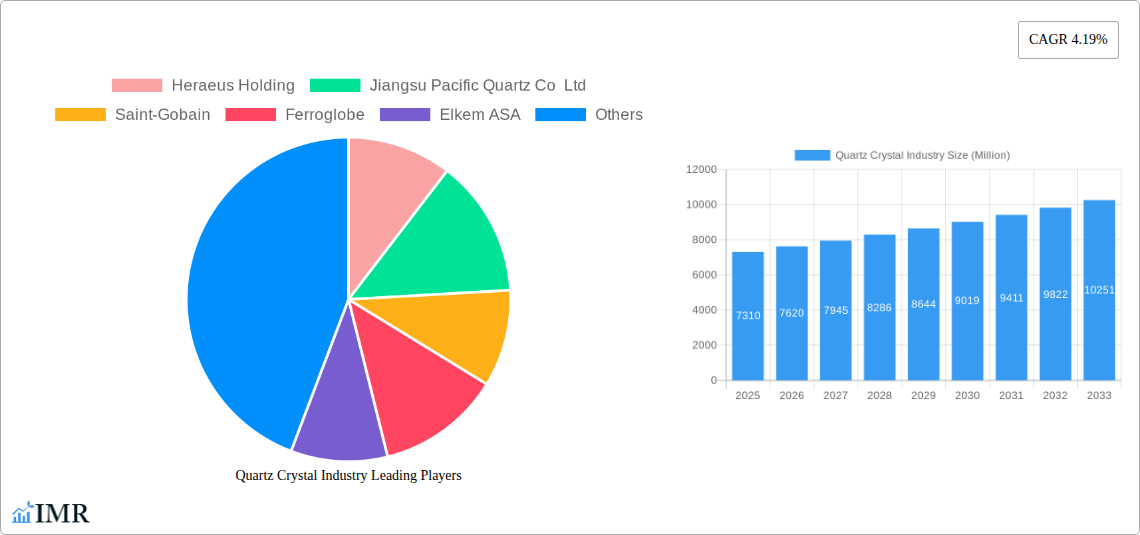
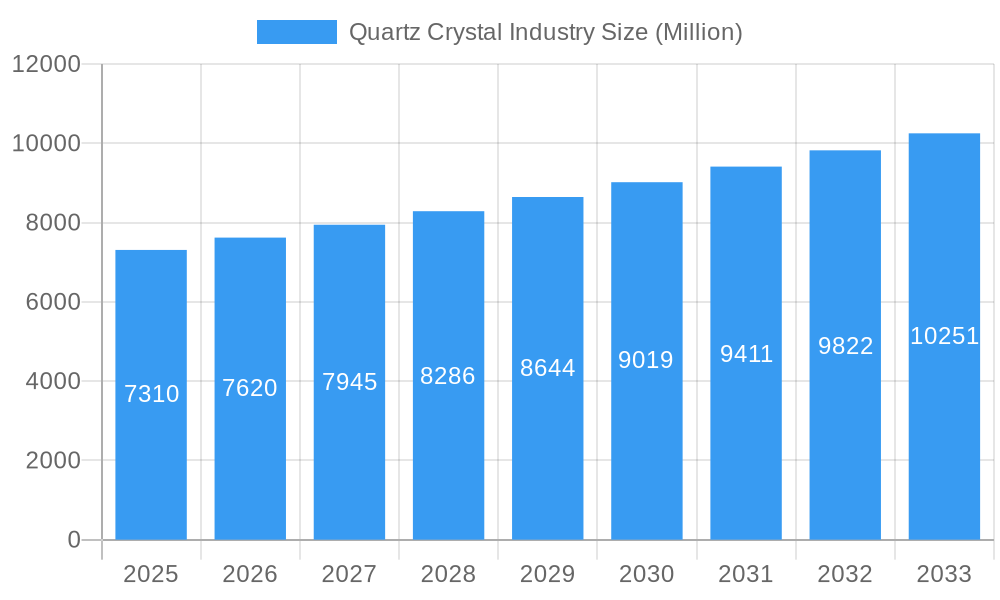
The global quartz crystal market, valued at $7.31 billion in 2025, is projected to experience robust growth, driven by increasing demand across diverse sectors. A compound annual growth rate (CAGR) of 4.19% from 2025 to 2033 signifies a significant expansion, primarily fueled by the electronics and semiconductor industry's continuous reliance on quartz crystals for precise frequency control and timing applications. The burgeoning solar energy sector further contributes to market growth, as quartz is crucial in solar cell manufacturing. Technological advancements leading to higher-purity quartz crystals and miniaturization are key trends shaping the market landscape. However, price volatility of raw materials like silicon metal and fluctuations in energy costs pose potential restraints. The high-purity quartz segment dominates, reflecting the growing need for precision in applications such as telecommunications and advanced electronics. Geographically, the Asia-Pacific region, particularly China and India, holds a significant market share due to substantial manufacturing activities and increasing domestic demand. North America and Europe also contribute substantially, driven by strong demand from technologically advanced sectors. Key players like Heraeus Holding, Saint-Gobain, and others are actively investing in research and development to enhance product quality and expand market reach. The market's future growth hinges on technological advancements, geopolitical factors, and ongoing innovations in materials science.
Quartz Crystal Industry Market Size (In Billion)
The competitive landscape is characterized by both established multinational corporations and regional players. The market is witnessing increasing consolidation, with mergers and acquisitions becoming a common strategy for expansion. Furthermore, the increasing focus on sustainable manufacturing practices and environmentally friendly materials is driving innovation within the industry. The market will likely see the emergence of new technologies and applications in the coming years, creating new opportunities for growth. The ongoing advancements in 5G technology and the Internet of Things (IoT) are expected to significantly impact demand for high-precision quartz crystals, fostering further market expansion throughout the forecast period. The ongoing development of novel applications for quartz crystal in areas like sensors and medical devices also promises to boost future growth.
Quartz Crystal Industry Company Market Share
Quartz Crystal Industry Market Report: 2019-2033
This comprehensive report provides an in-depth analysis of the Quartz Crystal Industry, encompassing market dynamics, growth trends, regional dominance, product landscape, and key players. The report covers the period 2019-2033, with a focus on the 2025-2033 forecast period. The market size is valued in million units. This report is crucial for industry professionals, investors, and strategists seeking a comprehensive understanding of this rapidly evolving sector. It leverages proprietary data and industry expertise to deliver actionable insights.
Quartz Crystal Industry Market Dynamics & Structure
The Quartz Crystal Industry, a critical component within broader material sciences and encompassing parent markets like Silicon Metal and specialized child markets such as High-purity Quartz, is characterized by a moderately concentrated market structure. While leading global entities like Heraeus Holding, Jiangsu Pacific Quartz Co Ltd, Saint-Gobain, and Sibelco command substantial market share, the industry also features a dynamic ecosystem of numerous smaller, agile players, especially within regional markets, indicating a healthy degree of fragmentation and innovation potential. The industry's trajectory is strongly propelled by relentless technological innovation, with a particular emphasis on achieving ever-higher purities and developing novel quartz formulations for cutting-edge applications in electronics, optics, and energy. Navigating this landscape requires adherence to stringent regulatory frameworks governing environmental sustainability and safety standards, which significantly influence manufacturing processes and operational strategies. Furthermore, the presence of competitive substitutes, including alternative materials adept at fulfilling specific application needs, exerts continuous pressure on market pricing and necessitates a focus on value proposition. The end-user demographics are exceptionally diverse, spanning the rapidly evolving electronics and semiconductor sectors, the burgeoning solar energy market, essential construction applications, and the critical telecommunications infrastructure. Consolidation is an observable trend, as evidenced by strategic M&A activities, such as Sibelco’s significant acquisition of Bassanetti Group in December 2022, highlighting a drive towards vertical integration, expanded market reach, and enhanced product portfolios.
- Market Concentration: Moderately concentrated, with top players holding approximately 55-65% of the global market share in 2024.
- Technological Innovation: A relentless focus on enhancing purity levels, minimizing defects through advanced characterization techniques, and developing specialized quartz forms (e.g., fused quartz, synthetic quartz) tailored for niche, high-performance applications.
- Regulatory Landscape: Increasingly stringent environmental protection and worker safety regulations are shaping mining practices, processing methodologies, and final product manufacturing, often necessitating investments in cleaner technologies and sustainable sourcing.
- Competitive Substitutes: While quartz offers unique properties, alternative materials like synthetic sapphire, advanced ceramics, and certain specialty glasses are gaining traction in specific high-end niche markets where their distinct characteristics offer an advantage.
- M&A Activity: A significant uptick in M&A activity has been observed in recent years, driven by a strategic imperative to consolidate market presence, acquire specialized technological expertise, and expand geographical footprint. Approximately 15-20 significant M&A deals have been recorded between 2019 and early 2024.
- Innovation Barriers: The substantial capital investment required for state-of-the-art manufacturing facilities, advanced R&D for ultra-high purity materials, and the rigorous quality control measures essential for meeting exacting industry standards present significant innovation barriers.
Quartz Crystal Industry Growth Trends & Insights
The Quartz Crystal Industry has demonstrated robust growth, achieving a compound annual growth rate (CAGR) of approximately 6.5% during the historical period of 2019-2024. This impressive expansion is primarily fueled by the escalating demand from pivotal end-user industries, most notably electronics and semiconductors, driven by the ubiquitous proliferation of advanced smartphones, sophisticated computing devices, and a wide array of interconnected electronic gadgets. The solar energy sector has also emerged as a substantial contributor to industry growth, powerfully propelled by the global imperative and concerted transition toward renewable energy sources and sustainable power generation. Technological disruptions, including the pioneering development of more efficient, cost-effective, and environmentally friendly quartz production techniques, are not only enhancing market competitiveness but also significantly driving adoption rates across various applications. A discernible shift in consumer and industrial behavior towards embracing environmentally conscious products and sustainable technologies further acts as a potent catalyst for the market's sustained expansion. Market penetration in key strategic regions is anticipated to climb, with projections indicating a reach of over 85% by 2033. The forecast period, spanning 2025-2033, is expected to witness a continued healthy CAGR of around 7.0-7.5%, primarily driven by sustained and growing demand from high-growth end-user segments and ongoing, impactful technological advancements in material science and manufacturing processes.
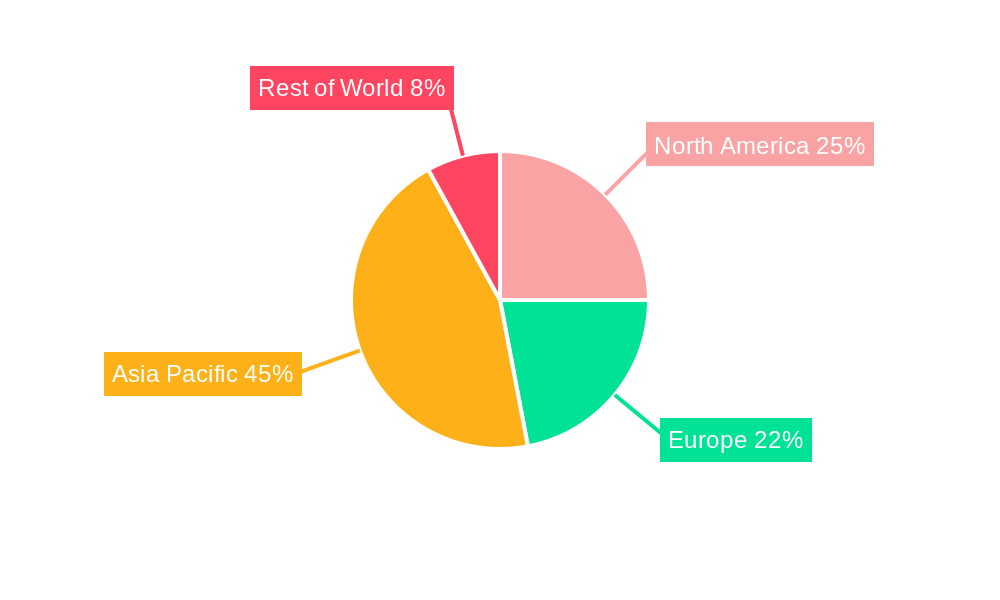
Dominant Regions, Countries, or Segments in Quartz Crystal Industry
The Asia-Pacific region, with China at its forefront, currently stands as the undisputed dominant market for quartz crystal. This supremacy is largely attributable to the region's exceptionally robust electronics and semiconductor manufacturing ecosystem, which forms the bedrock of demand. Complementing this, strong economic growth trajectories and proactive government support for renewable energy projects, particularly solar installations, further solidify this region's leading position. The North American market also commands a significant market share, benefiting from its well-established and advanced electronics industry alongside a burgeoning demand for solar energy applications and infrastructure development. Examining product segments, High-purity Quartz indisputably commands the highest market share, a direct consequence of its indispensable use in high-value, performance-critical applications where purity is paramount. Similarly, the Electronics and Semiconductor end-user segment holds the largest market share, driven by the insatiable and ever-increasing global demand for electronic devices and advancements in microelectronics.
- Key Drivers (Asia-Pacific): Rapid industrialization, a massive and expanding electronics manufacturing base, and supportive government initiatives promoting renewable energy and advanced materials development.
- Key Drivers (North America): A mature and innovation-driven electronics industry, increasing adoption of solar energy for grid modernization and distributed generation, and robust infrastructure development projects.
- Dominant Segment: High-purity Quartz (estimated market share of 60-70% in 2024).
- Dominant End-user Industry: Electronics and Semiconductor (estimated market share of 50-60% in 2024).
- Growth Potential: Significant untapped growth potential exists in emerging markets, including rapidly developing economies in Southeast Asia and Africa, as their industrial bases expand and renewable energy adoption accelerates.
Quartz Crystal Industry Product Landscape
The quartz crystal industry offers a diverse and sophisticated array of products, broadly categorized into natural and synthetic quartz. These products are meticulously manufactured with varying purity levels, precise specifications, and tailored physical properties to meet the stringent demands of a wide spectrum of applications. The increasing prevalence of High-purity Quartz is a defining characteristic, driven by its superior optical clarity, excellent thermal stability, and exceptional electrical insulation properties, making it indispensable for advanced technologies. Product innovations are intensely focused on enhancing manufacturing precision, achieving near-perfect purity levels, minimizing microscopic imperfections, and developing bespoke quartz solutions for highly specialized industrial niches. The unique selling propositions (USPs) of different quartz products are fundamentally anchored in their purity grades (e.g., semiconductor-grade, optical-grade), dimensional consistency, and specifically engineered material properties that align with critical application requirements. Underlying these advancements are continuous technological innovations aimed at optimizing production efficiency, improving material yield, reducing energy consumption, and minimizing the overall environmental footprint of the manufacturing processes.
Key Drivers, Barriers & Challenges in Quartz Crystal Industry
Key Drivers: The surging demand from the rapidly expanding electronics and solar energy sectors stands as a primary growth engine. Concurrently, significant advancements in sophisticated quartz processing and purification technologies are enabling new applications and improving cost-effectiveness. Furthermore, supportive government policies and incentives, particularly those promoting renewable energy adoption and advanced manufacturing, are acting as crucial catalysts for industry expansion.
Challenges & Restraints: The industry faces considerable headwinds from the inherent volatility in raw material prices, particularly for high-grade quartz deposits. Increasingly stringent environmental regulations and the associated compliance costs add another layer of complexity. Intense global competition, especially from low-cost producers, exerts continuous pressure on profit margins. Supply chain disruptions, amplified by geopolitical instability and logistical bottlenecks impacting certain key supply regions, pose a significant risk. These multifaceted challenges, particularly the impact of widespread supply chain disruptions experienced globally, are estimated to have collectively impacted market growth by approximately 3-5% in 2022.
Emerging Opportunities in Quartz Crystal Industry
Emerging opportunities lie in the development of specialized quartz for niche applications, such as advanced sensors, medical devices, and high-frequency electronics. Expanding into untapped markets in developing economies presents significant growth potential. The growing demand for sustainable technologies and environmentally friendly products opens avenues for innovative and eco-conscious quartz production processes.
Growth Accelerators in the Quartz Crystal Industry Industry
Long-term growth will be fueled by the continued expansion of the electronics and renewable energy sectors, coupled with technological breakthroughs in quartz processing and purification. Strategic partnerships and collaborations between manufacturers and end-users will play a crucial role in driving innovation and market expansion.
Key Players Shaping the Quartz Crystal Industry Market
- Heraeus Holding
- Jiangsu Pacific Quartz Co Ltd
- Saint-Gobain
- Ferroglobe
- Elkem ASA
- Wonic QnC Corporation
- The Quartz Corporation
- Nihon Dempa Kogyo Co Ltd
- Sibelco
- Nordic Mining ASA
- SUMCO Corporation
- Dow
- RUSNANO Group
- AGC Inc
- Beijing Kai de Quartz Co Ltd
Notable Milestones in Quartz Crystal Industry Sector
- December 2022: Sibelco acquired Bassanetti Group, strengthening its position in Southern Europe.
- March 2022: AGC Inc terminated operations in Russia and Ukraine due to the war.
In-Depth Quartz Crystal Industry Market Outlook
The Quartz Crystal Industry is poised for continued growth driven by the increasing demand for high-purity quartz in advanced technologies and renewable energy applications. Strategic investments in research and development, coupled with innovative manufacturing processes, will shape future market dynamics. Companies that effectively manage supply chain risks and adapt to evolving regulatory landscapes will be best positioned for success. The long-term outlook is positive, with significant opportunities for market expansion and technological advancements.
Quartz Crystal Industry Segmentation
-
1. Type
-
1.1. High-purity Quartz
- 1.1.1. Quartz Surface and Tile
- 1.1.2. Fused Quartz Crucible
- 1.1.3. Quartz Glass
- 1.2. Quartz Crystal
- 1.3. Silicon Metal
-
1.1. High-purity Quartz
-
2. End-user Industry
- 2.1. Electronics and Semiconductor
- 2.2. Solar
- 2.3. Buildings and Construction
- 2.4. Optical fiber and Telecommunication
- 2.5. Automotive
- 2.6. Other End-user Industries
Quartz Crystal Industry Segmentation By Geography
-
1. Asia Pacific
- 1.1. China
- 1.2. India
- 1.3. Japan
- 1.4. South Korea
- 1.5. Rest of Asia Pacific
-
2. North America
- 2.1. United States
- 2.2. Canada
- 2.3. Mexico
-
3. Europe
- 3.1. Germany
- 3.2. United Kingdom
- 3.3. Italy
- 3.4. France
- 3.5. Russia
- 3.6. Rest of Europe
-
4. South America
- 4.1. Brazil
- 4.2. Argentina
- 4.3. Rest of South America
- 5. Middle East
-
6. Saudi Arabia
- 6.1. South Africa
- 6.2. Rest of Middle East
Quartz Crystal Industry Regional Market Share
Geographic Coverage of Quartz Crystal Industry
Quartz Crystal Industry REPORT HIGHLIGHTS
| Aspects | Details |
|---|---|
| Study Period | 2020-2034 |
| Base Year | 2025 |
| Estimated Year | 2026 |
| Forecast Period | 2026-2034 |
| Historical Period | 2020-2025 |
| Growth Rate | CAGR of 4.19% from 2020-2034 |
| Segmentation |
|
Table of Contents
- 1. Introduction
- 1.1. Research Scope
- 1.2. Market Segmentation
- 1.3. Research Objective
- 1.4. Definitions and Assumptions
- 2. Executive Summary
- 2.1. Market Snapshot
- 3. Market Dynamics
- 3.1. Market Drivers
- 3.2. Market Restrains
- 3.3. Market Trends
- 3.4. Market Opportunities
- 4. Market Factor Analysis
- 4.1. Porters Five Forces
- 4.1.1. Bargaining Power of Suppliers
- 4.1.2. Bargaining Power of Buyers
- 4.1.3. Threat of New Entrants
- 4.1.4. Threat of Substitutes
- 4.1.5. Competitive Rivalry
- 4.2. PESTEL analysis
- 4.3. BCG Analysis
- 4.3.1. Stars (High Growth, High Market Share)
- 4.3.2. Cash Cows (Low Growth, High Market Share)
- 4.3.3. Question Mark (High Growth, Low Market Share)
- 4.3.4. Dogs (Low Growth, Low Market Share)
- 4.4. Ansoff Matrix Analysis
- 4.5. Supply Chain Analysis
- 4.6. Regulatory Landscape
- 4.7. Current Market Potential and Opportunity Assessment (TAM–SAM–SOM Framework)
- 4.8. IMR Analyst Note
- 4.1. Porters Five Forces
- 5. Market Analysis, Insights and Forecast 2021-2033
- 5.1. Market Analysis, Insights and Forecast - by Type
- 5.1.1. High-purity Quartz
- 5.1.1.1. Quartz Surface and Tile
- 5.1.1.2. Fused Quartz Crucible
- 5.1.1.3. Quartz Glass
- 5.1.2. Quartz Crystal
- 5.1.3. Silicon Metal
- 5.1.1. High-purity Quartz
- 5.2. Market Analysis, Insights and Forecast - by End-user Industry
- 5.2.1. Electronics and Semiconductor
- 5.2.2. Solar
- 5.2.3. Buildings and Construction
- 5.2.4. Optical fiber and Telecommunication
- 5.2.5. Automotive
- 5.2.6. Other End-user Industries
- 5.3. Market Analysis, Insights and Forecast - by Region
- 5.3.1. Asia Pacific
- 5.3.2. North America
- 5.3.3. Europe
- 5.3.4. South America
- 5.3.5. Middle East
- 5.3.6. Saudi Arabia
- 5.1. Market Analysis, Insights and Forecast - by Type
- 6. Global Quartz Crystal Industry Analysis, Insights and Forecast, 2021-2033
- 6.1. Market Analysis, Insights and Forecast - by Type
- 6.1.1. High-purity Quartz
- 6.1.1.1. Quartz Surface and Tile
- 6.1.1.2. Fused Quartz Crucible
- 6.1.1.3. Quartz Glass
- 6.1.2. Quartz Crystal
- 6.1.3. Silicon Metal
- 6.1.1. High-purity Quartz
- 6.2. Market Analysis, Insights and Forecast - by End-user Industry
- 6.2.1. Electronics and Semiconductor
- 6.2.2. Solar
- 6.2.3. Buildings and Construction
- 6.2.4. Optical fiber and Telecommunication
- 6.2.5. Automotive
- 6.2.6. Other End-user Industries
- 6.1. Market Analysis, Insights and Forecast - by Type
- 7. Asia Pacific Quartz Crystal Industry Analysis, Insights and Forecast, 2020-2032
- 7.1. Market Analysis, Insights and Forecast - by Type
- 7.1.1. High-purity Quartz
- 7.1.1.1. Quartz Surface and Tile
- 7.1.1.2. Fused Quartz Crucible
- 7.1.1.3. Quartz Glass
- 7.1.2. Quartz Crystal
- 7.1.3. Silicon Metal
- 7.1.1. High-purity Quartz
- 7.2. Market Analysis, Insights and Forecast - by End-user Industry
- 7.2.1. Electronics and Semiconductor
- 7.2.2. Solar
- 7.2.3. Buildings and Construction
- 7.2.4. Optical fiber and Telecommunication
- 7.2.5. Automotive
- 7.2.6. Other End-user Industries
- 7.1. Market Analysis, Insights and Forecast - by Type
- 8. North America Quartz Crystal Industry Analysis, Insights and Forecast, 2020-2032
- 8.1. Market Analysis, Insights and Forecast - by Type
- 8.1.1. High-purity Quartz
- 8.1.1.1. Quartz Surface and Tile
- 8.1.1.2. Fused Quartz Crucible
- 8.1.1.3. Quartz Glass
- 8.1.2. Quartz Crystal
- 8.1.3. Silicon Metal
- 8.1.1. High-purity Quartz
- 8.2. Market Analysis, Insights and Forecast - by End-user Industry
- 8.2.1. Electronics and Semiconductor
- 8.2.2. Solar
- 8.2.3. Buildings and Construction
- 8.2.4. Optical fiber and Telecommunication
- 8.2.5. Automotive
- 8.2.6. Other End-user Industries
- 8.1. Market Analysis, Insights and Forecast - by Type
- 9. Europe Quartz Crystal Industry Analysis, Insights and Forecast, 2020-2032
- 9.1. Market Analysis, Insights and Forecast - by Type
- 9.1.1. High-purity Quartz
- 9.1.1.1. Quartz Surface and Tile
- 9.1.1.2. Fused Quartz Crucible
- 9.1.1.3. Quartz Glass
- 9.1.2. Quartz Crystal
- 9.1.3. Silicon Metal
- 9.1.1. High-purity Quartz
- 9.2. Market Analysis, Insights and Forecast - by End-user Industry
- 9.2.1. Electronics and Semiconductor
- 9.2.2. Solar
- 9.2.3. Buildings and Construction
- 9.2.4. Optical fiber and Telecommunication
- 9.2.5. Automotive
- 9.2.6. Other End-user Industries
- 9.1. Market Analysis, Insights and Forecast - by Type
- 10. South America Quartz Crystal Industry Analysis, Insights and Forecast, 2020-2032
- 10.1. Market Analysis, Insights and Forecast - by Type
- 10.1.1. High-purity Quartz
- 10.1.1.1. Quartz Surface and Tile
- 10.1.1.2. Fused Quartz Crucible
- 10.1.1.3. Quartz Glass
- 10.1.2. Quartz Crystal
- 10.1.3. Silicon Metal
- 10.1.1. High-purity Quartz
- 10.2. Market Analysis, Insights and Forecast - by End-user Industry
- 10.2.1. Electronics and Semiconductor
- 10.2.2. Solar
- 10.2.3. Buildings and Construction
- 10.2.4. Optical fiber and Telecommunication
- 10.2.5. Automotive
- 10.2.6. Other End-user Industries
- 10.1. Market Analysis, Insights and Forecast - by Type
- 11. Middle East Quartz Crystal Industry Analysis, Insights and Forecast, 2020-2032
- 11.1. Market Analysis, Insights and Forecast - by Type
- 11.1.1. High-purity Quartz
- 11.1.1.1. Quartz Surface and Tile
- 11.1.1.2. Fused Quartz Crucible
- 11.1.1.3. Quartz Glass
- 11.1.2. Quartz Crystal
- 11.1.3. Silicon Metal
- 11.1.1. High-purity Quartz
- 11.2. Market Analysis, Insights and Forecast - by End-user Industry
- 11.2.1. Electronics and Semiconductor
- 11.2.2. Solar
- 11.2.3. Buildings and Construction
- 11.2.4. Optical fiber and Telecommunication
- 11.2.5. Automotive
- 11.2.6. Other End-user Industries
- 11.1. Market Analysis, Insights and Forecast - by Type
- 12. Saudi Arabia Quartz Crystal Industry Analysis, Insights and Forecast, 2020-2032
- 12.1. Market Analysis, Insights and Forecast - by Type
- 12.1.1. High-purity Quartz
- 12.1.1.1. Quartz Surface and Tile
- 12.1.1.2. Fused Quartz Crucible
- 12.1.1.3. Quartz Glass
- 12.1.2. Quartz Crystal
- 12.1.3. Silicon Metal
- 12.1.1. High-purity Quartz
- 12.2. Market Analysis, Insights and Forecast - by End-user Industry
- 12.2.1. Electronics and Semiconductor
- 12.2.2. Solar
- 12.2.3. Buildings and Construction
- 12.2.4. Optical fiber and Telecommunication
- 12.2.5. Automotive
- 12.2.6. Other End-user Industries
- 12.1. Market Analysis, Insights and Forecast - by Type
- 13. Competitive Analysis
- 13.1. Company Profiles
- 13.1.1 Heraeus Holding
- 13.1.1.1. Company Overview
- 13.1.1.2. Products
- 13.1.1.3. Company Financials
- 13.1.1.4. SWOT Analysis
- 13.1.2 Jiangsu Pacific Quartz Co Ltd
- 13.1.2.1. Company Overview
- 13.1.2.2. Products
- 13.1.2.3. Company Financials
- 13.1.2.4. SWOT Analysis
- 13.1.3 Saint-Gobain
- 13.1.3.1. Company Overview
- 13.1.3.2. Products
- 13.1.3.3. Company Financials
- 13.1.3.4. SWOT Analysis
- 13.1.4 Ferroglobe
- 13.1.4.1. Company Overview
- 13.1.4.2. Products
- 13.1.4.3. Company Financials
- 13.1.4.4. SWOT Analysis
- 13.1.5 Elkem ASA
- 13.1.5.1. Company Overview
- 13.1.5.2. Products
- 13.1.5.3. Company Financials
- 13.1.5.4. SWOT Analysis
- 13.1.6 Wonic QnC Corporation
- 13.1.6.1. Company Overview
- 13.1.6.2. Products
- 13.1.6.3. Company Financials
- 13.1.6.4. SWOT Analysis
- 13.1.7 The Quartz Corporation*List Not Exhaustive
- 13.1.7.1. Company Overview
- 13.1.7.2. Products
- 13.1.7.3. Company Financials
- 13.1.7.4. SWOT Analysis
- 13.1.8 Nihon Dempa Kogyo Co Ltd
- 13.1.8.1. Company Overview
- 13.1.8.2. Products
- 13.1.8.3. Company Financials
- 13.1.8.4. SWOT Analysis
- 13.1.9 Sibelco
- 13.1.9.1. Company Overview
- 13.1.9.2. Products
- 13.1.9.3. Company Financials
- 13.1.9.4. SWOT Analysis
- 13.1.10 Nordic Mining ASA
- 13.1.10.1. Company Overview
- 13.1.10.2. Products
- 13.1.10.3. Company Financials
- 13.1.10.4. SWOT Analysis
- 13.1.11 SUMCO Corporation
- 13.1.11.1. Company Overview
- 13.1.11.2. Products
- 13.1.11.3. Company Financials
- 13.1.11.4. SWOT Analysis
- 13.1.12 Dow
- 13.1.12.1. Company Overview
- 13.1.12.2. Products
- 13.1.12.3. Company Financials
- 13.1.12.4. SWOT Analysis
- 13.1.13 RUSNANO Group
- 13.1.13.1. Company Overview
- 13.1.13.2. Products
- 13.1.13.3. Company Financials
- 13.1.13.4. SWOT Analysis
- 13.1.14 AGC Inc
- 13.1.14.1. Company Overview
- 13.1.14.2. Products
- 13.1.14.3. Company Financials
- 13.1.14.4. SWOT Analysis
- 13.1.15 Beijing Kai de Quartz Co Ltd
- 13.1.15.1. Company Overview
- 13.1.15.2. Products
- 13.1.15.3. Company Financials
- 13.1.15.4. SWOT Analysis
- 13.1.1 Heraeus Holding
- 13.2. Market Entropy
- 13.2.1 Company's Key Areas Served
- 13.2.2 Recent Developments
- 13.3. Company Market Share Analysis 2025
- 13.3.1 Top 5 Companies Market Share Analysis
- 13.3.2 Top 3 Companies Market Share Analysis
- 13.4. List of Potential Customers
- 14. Research Methodology
List of Figures
- Figure 1: Global Quartz Crystal Industry Revenue Breakdown (Million, %) by Region 2025 & 2033
- Figure 2: Asia Pacific Quartz Crystal Industry Revenue (Million), by Type 2025 & 2033
- Figure 3: Asia Pacific Quartz Crystal Industry Revenue Share (%), by Type 2025 & 2033
- Figure 4: Asia Pacific Quartz Crystal Industry Revenue (Million), by End-user Industry 2025 & 2033
- Figure 5: Asia Pacific Quartz Crystal Industry Revenue Share (%), by End-user Industry 2025 & 2033
- Figure 6: Asia Pacific Quartz Crystal Industry Revenue (Million), by Country 2025 & 2033
- Figure 7: Asia Pacific Quartz Crystal Industry Revenue Share (%), by Country 2025 & 2033
- Figure 8: North America Quartz Crystal Industry Revenue (Million), by Type 2025 & 2033
- Figure 9: North America Quartz Crystal Industry Revenue Share (%), by Type 2025 & 2033
- Figure 10: North America Quartz Crystal Industry Revenue (Million), by End-user Industry 2025 & 2033
- Figure 11: North America Quartz Crystal Industry Revenue Share (%), by End-user Industry 2025 & 2033
- Figure 12: North America Quartz Crystal Industry Revenue (Million), by Country 2025 & 2033
- Figure 13: North America Quartz Crystal Industry Revenue Share (%), by Country 2025 & 2033
- Figure 14: Europe Quartz Crystal Industry Revenue (Million), by Type 2025 & 2033
- Figure 15: Europe Quartz Crystal Industry Revenue Share (%), by Type 2025 & 2033
- Figure 16: Europe Quartz Crystal Industry Revenue (Million), by End-user Industry 2025 & 2033
- Figure 17: Europe Quartz Crystal Industry Revenue Share (%), by End-user Industry 2025 & 2033
- Figure 18: Europe Quartz Crystal Industry Revenue (Million), by Country 2025 & 2033
- Figure 19: Europe Quartz Crystal Industry Revenue Share (%), by Country 2025 & 2033
- Figure 20: South America Quartz Crystal Industry Revenue (Million), by Type 2025 & 2033
- Figure 21: South America Quartz Crystal Industry Revenue Share (%), by Type 2025 & 2033
- Figure 22: South America Quartz Crystal Industry Revenue (Million), by End-user Industry 2025 & 2033
- Figure 23: South America Quartz Crystal Industry Revenue Share (%), by End-user Industry 2025 & 2033
- Figure 24: South America Quartz Crystal Industry Revenue (Million), by Country 2025 & 2033
- Figure 25: South America Quartz Crystal Industry Revenue Share (%), by Country 2025 & 2033
- Figure 26: Middle East Quartz Crystal Industry Revenue (Million), by Type 2025 & 2033
- Figure 27: Middle East Quartz Crystal Industry Revenue Share (%), by Type 2025 & 2033
- Figure 28: Middle East Quartz Crystal Industry Revenue (Million), by End-user Industry 2025 & 2033
- Figure 29: Middle East Quartz Crystal Industry Revenue Share (%), by End-user Industry 2025 & 2033
- Figure 30: Middle East Quartz Crystal Industry Revenue (Million), by Country 2025 & 2033
- Figure 31: Middle East Quartz Crystal Industry Revenue Share (%), by Country 2025 & 2033
- Figure 32: Saudi Arabia Quartz Crystal Industry Revenue (Million), by Type 2025 & 2033
- Figure 33: Saudi Arabia Quartz Crystal Industry Revenue Share (%), by Type 2025 & 2033
- Figure 34: Saudi Arabia Quartz Crystal Industry Revenue (Million), by End-user Industry 2025 & 2033
- Figure 35: Saudi Arabia Quartz Crystal Industry Revenue Share (%), by End-user Industry 2025 & 2033
- Figure 36: Saudi Arabia Quartz Crystal Industry Revenue (Million), by Country 2025 & 2033
- Figure 37: Saudi Arabia Quartz Crystal Industry Revenue Share (%), by Country 2025 & 2033
List of Tables
- Table 1: Global Quartz Crystal Industry Revenue Million Forecast, by Type 2020 & 2033
- Table 2: Global Quartz Crystal Industry Revenue Million Forecast, by End-user Industry 2020 & 2033
- Table 3: Global Quartz Crystal Industry Revenue Million Forecast, by Region 2020 & 2033
- Table 4: Global Quartz Crystal Industry Revenue Million Forecast, by Type 2020 & 2033
- Table 5: Global Quartz Crystal Industry Revenue Million Forecast, by End-user Industry 2020 & 2033
- Table 6: Global Quartz Crystal Industry Revenue Million Forecast, by Country 2020 & 2033
- Table 7: China Quartz Crystal Industry Revenue (Million) Forecast, by Application 2020 & 2033
- Table 8: India Quartz Crystal Industry Revenue (Million) Forecast, by Application 2020 & 2033
- Table 9: Japan Quartz Crystal Industry Revenue (Million) Forecast, by Application 2020 & 2033
- Table 10: South Korea Quartz Crystal Industry Revenue (Million) Forecast, by Application 2020 & 2033
- Table 11: Rest of Asia Pacific Quartz Crystal Industry Revenue (Million) Forecast, by Application 2020 & 2033
- Table 12: Global Quartz Crystal Industry Revenue Million Forecast, by Type 2020 & 2033
- Table 13: Global Quartz Crystal Industry Revenue Million Forecast, by End-user Industry 2020 & 2033
- Table 14: Global Quartz Crystal Industry Revenue Million Forecast, by Country 2020 & 2033
- Table 15: United States Quartz Crystal Industry Revenue (Million) Forecast, by Application 2020 & 2033
- Table 16: Canada Quartz Crystal Industry Revenue (Million) Forecast, by Application 2020 & 2033
- Table 17: Mexico Quartz Crystal Industry Revenue (Million) Forecast, by Application 2020 & 2033
- Table 18: Global Quartz Crystal Industry Revenue Million Forecast, by Type 2020 & 2033
- Table 19: Global Quartz Crystal Industry Revenue Million Forecast, by End-user Industry 2020 & 2033
- Table 20: Global Quartz Crystal Industry Revenue Million Forecast, by Country 2020 & 2033
- Table 21: Germany Quartz Crystal Industry Revenue (Million) Forecast, by Application 2020 & 2033
- Table 22: United Kingdom Quartz Crystal Industry Revenue (Million) Forecast, by Application 2020 & 2033
- Table 23: Italy Quartz Crystal Industry Revenue (Million) Forecast, by Application 2020 & 2033
- Table 24: France Quartz Crystal Industry Revenue (Million) Forecast, by Application 2020 & 2033
- Table 25: Russia Quartz Crystal Industry Revenue (Million) Forecast, by Application 2020 & 2033
- Table 26: Rest of Europe Quartz Crystal Industry Revenue (Million) Forecast, by Application 2020 & 2033
- Table 27: Global Quartz Crystal Industry Revenue Million Forecast, by Type 2020 & 2033
- Table 28: Global Quartz Crystal Industry Revenue Million Forecast, by End-user Industry 2020 & 2033
- Table 29: Global Quartz Crystal Industry Revenue Million Forecast, by Country 2020 & 2033
- Table 30: Brazil Quartz Crystal Industry Revenue (Million) Forecast, by Application 2020 & 2033
- Table 31: Argentina Quartz Crystal Industry Revenue (Million) Forecast, by Application 2020 & 2033
- Table 32: Rest of South America Quartz Crystal Industry Revenue (Million) Forecast, by Application 2020 & 2033
- Table 33: Global Quartz Crystal Industry Revenue Million Forecast, by Type 2020 & 2033
- Table 34: Global Quartz Crystal Industry Revenue Million Forecast, by End-user Industry 2020 & 2033
- Table 35: Global Quartz Crystal Industry Revenue Million Forecast, by Country 2020 & 2033
- Table 36: Global Quartz Crystal Industry Revenue Million Forecast, by Type 2020 & 2033
- Table 37: Global Quartz Crystal Industry Revenue Million Forecast, by End-user Industry 2020 & 2033
- Table 38: Global Quartz Crystal Industry Revenue Million Forecast, by Country 2020 & 2033
- Table 39: South Africa Quartz Crystal Industry Revenue (Million) Forecast, by Application 2020 & 2033
- Table 40: Rest of Middle East Quartz Crystal Industry Revenue (Million) Forecast, by Application 2020 & 2033
Frequently Asked Questions
1. What is the projected Compound Annual Growth Rate (CAGR) of the Quartz Crystal Industry?
The projected CAGR is approximately 4.19%.
2. Which companies are prominent players in the Quartz Crystal Industry?
Key companies in the market include Heraeus Holding, Jiangsu Pacific Quartz Co Ltd, Saint-Gobain, Ferroglobe, Elkem ASA, Wonic QnC Corporation, The Quartz Corporation*List Not Exhaustive, Nihon Dempa Kogyo Co Ltd, Sibelco, Nordic Mining ASA, SUMCO Corporation, Dow, RUSNANO Group, AGC Inc, Beijing Kai de Quartz Co Ltd.
3. What are the main segments of the Quartz Crystal Industry?
The market segments include Type, End-user Industry.
4. Can you provide details about the market size?
The market size is estimated to be USD 7.31 Million as of 2022.
5. What are some drivers contributing to market growth?
Growing Solar Industry; Demand for High-purity Quartz in the Semiconductor Industry.
6. What are the notable trends driving market growth?
Rising Demand from the Electronics and Semiconductor Industry.
7. Are there any restraints impacting market growth?
Ecological Impact of Quartz Mining; Discoloration in Quartz Tiles and Slabs.
8. Can you provide examples of recent developments in the market?
December 2022: Sibelco acquired Bassanetti Group of Italy, which is a local player in the extraction, processing, and marketing of sand products in Southern Europe. This move will strengthen the company's positioning in Southern Europe.
9. What pricing options are available for accessing the report?
Pricing options include single-user, multi-user, and enterprise licenses priced at USD 4750, USD 5250, and USD 8750 respectively.
10. Is the market size provided in terms of value or volume?
The market size is provided in terms of value, measured in Million.
11. Are there any specific market keywords associated with the report?
Yes, the market keyword associated with the report is "Quartz Crystal Industry," which aids in identifying and referencing the specific market segment covered.
12. How do I determine which pricing option suits my needs best?
The pricing options vary based on user requirements and access needs. Individual users may opt for single-user licenses, while businesses requiring broader access may choose multi-user or enterprise licenses for cost-effective access to the report.
13. Are there any additional resources or data provided in the Quartz Crystal Industry report?
While the report offers comprehensive insights, it's advisable to review the specific contents or supplementary materials provided to ascertain if additional resources or data are available.
14. How can I stay updated on further developments or reports in the Quartz Crystal Industry?
To stay informed about further developments, trends, and reports in the Quartz Crystal Industry, consider subscribing to industry newsletters, following relevant companies and organizations, or regularly checking reputable industry news sources and publications.
Methodology
Step 1 - Identification of Relevant Samples Size from Population Database


Step 2 - Approaches for Defining Global Market Size (Value, Volume* & Price*)

Note*: In applicable scenarios
Step 3 - Data Sources
Primary Research
- Web Analytics
- Survey Reports
- Research Institute
- Latest Research Reports
- Opinion Leaders
Secondary Research
- Annual Reports
- White Paper
- Latest Press Release
- Industry Association
- Paid Database
- Investor Presentations

Step 4 - Data Triangulation
Involves using different sources of information in order to increase the validity of a study
These sources are likely to be stakeholders in a program - participants, other researchers, program staff, other community members, and so on.
Then we put all data in single framework & apply various statistical tools to find out the dynamic on the market.
During the analysis stage, feedback from the stakeholder groups would be compared to determine areas of agreement as well as areas of divergence