

Key Insights
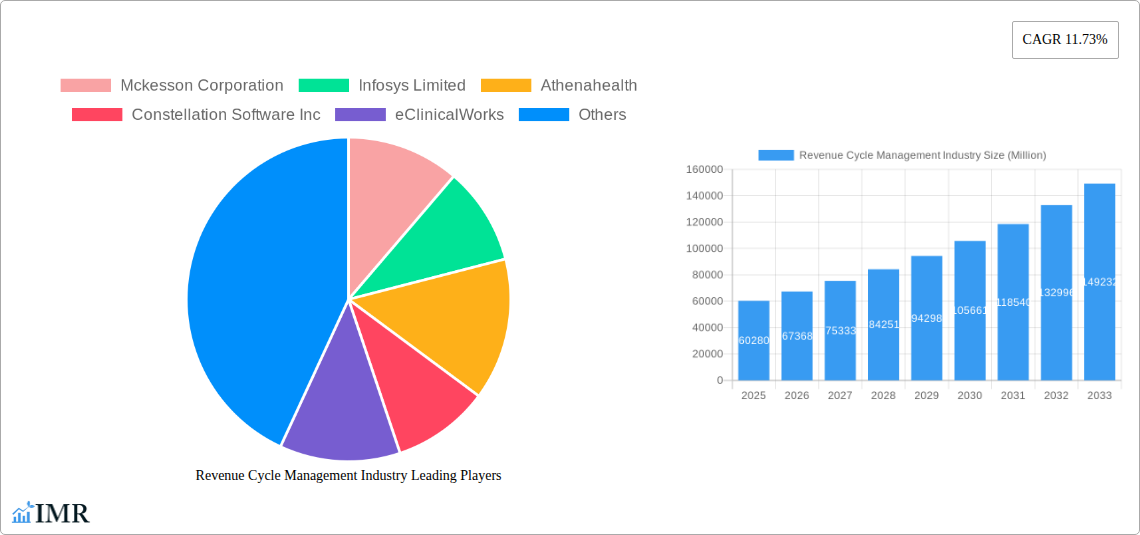
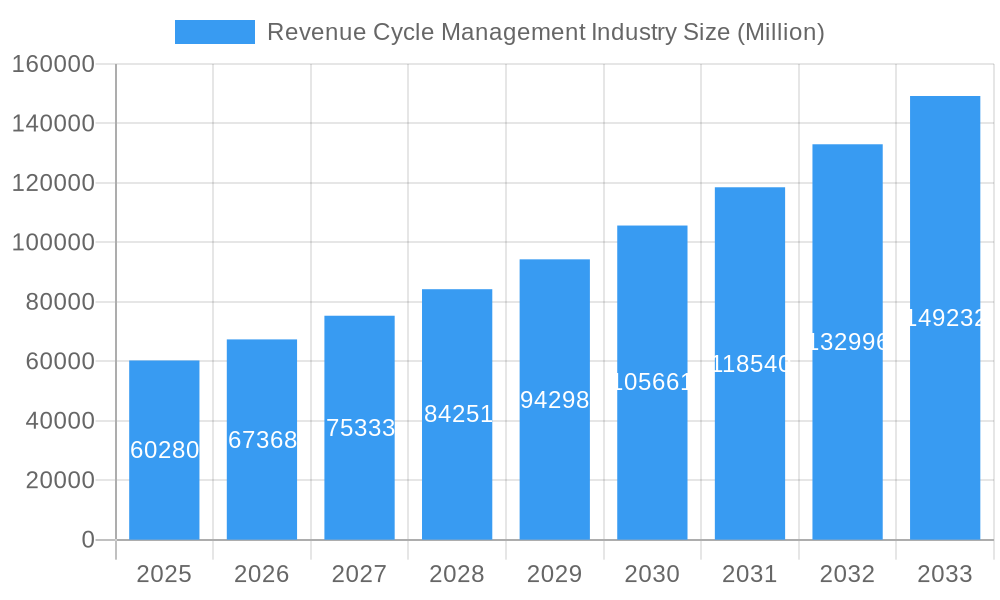
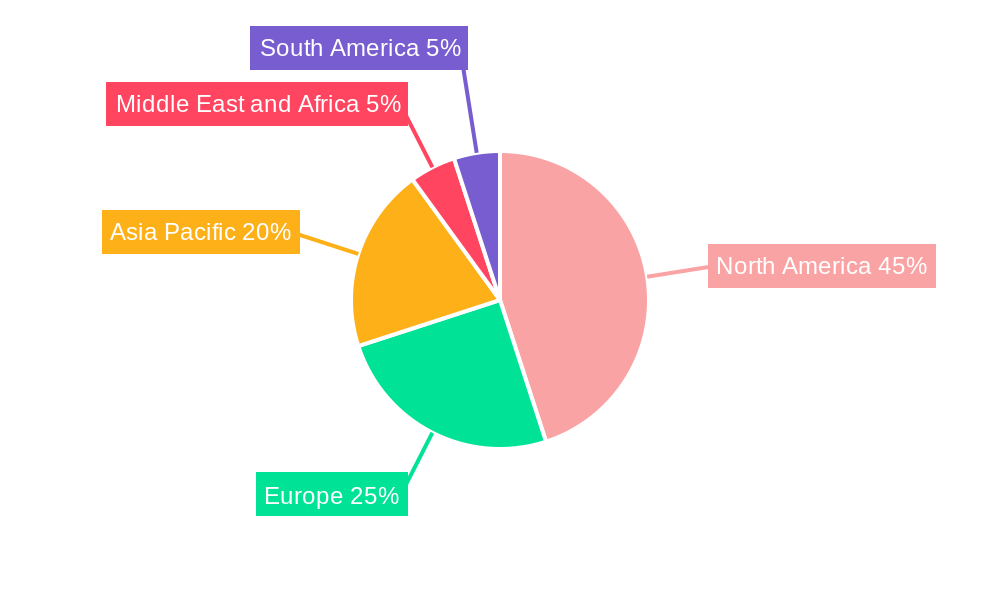
The Revenue Cycle Management (RCM) industry, currently valued at $60.28 billion in 2025, is experiencing robust growth, projected to expand at a Compound Annual Growth Rate (CAGR) of 11.73% from 2025 to 2033. This significant expansion is driven by several key factors. The increasing adoption of electronic health records (EHRs) and the growing demand for efficient healthcare billing and claims processing solutions are major contributors. Furthermore, the industry is witnessing a shift towards cloud-based RCM solutions, offering enhanced scalability, accessibility, and cost-effectiveness. The rising prevalence of chronic diseases and an aging global population are also fueling the demand for comprehensive RCM services across hospitals, laboratories, and other healthcare providers. Increased regulatory pressures and the need to minimize revenue leakage further incentivize healthcare organizations to invest in sophisticated RCM systems and services. Competitive pressures and the pursuit of improved operational efficiency are also key drivers. The market segmentation highlights a strong demand across various functions, including claims and denial management, medical coding and billing, and clinical documentation improvement. North America currently dominates the market, followed by Europe and the Asia-Pacific region, but emerging economies are showing promising growth potential.
Revenue Cycle Management Industry Market Size (In Billion)
The competitive landscape is characterized by a mix of large established players like McKesson, Epic Systems, and Athenahealth, and specialized niche providers. Strategic partnerships, mergers, and acquisitions are expected to shape the industry's future. While the industry faces challenges such as data security concerns and the complexities of integrating various systems, the overall outlook remains positive. The continuous innovation in RCM technologies, coupled with the increasing focus on improving healthcare revenue cycle operations, will fuel substantial market growth in the coming years. The projected market size in 2033, based on the provided CAGR, is expected to significantly exceed the current valuation, reflecting the positive outlook for the industry. The continued expansion into emerging markets and the integration of advanced analytics and artificial intelligence will further enhance the market's trajectory.
Revenue Cycle Management Industry Company Market Share
This comprehensive report provides a detailed analysis of the Revenue Cycle Management (RCM) industry, encompassing market dynamics, growth trends, key players, and future outlook. The report covers the parent market of Healthcare IT and the child market of Revenue Cycle Management, offering invaluable insights for investors, industry professionals, and strategic decision-makers. The study period spans from 2019 to 2033, with 2025 serving as the base year and estimated year.
Revenue Cycle Management Industry Market Dynamics & Structure
The RCM market is characterized by a moderately concentrated landscape with a few dominant players alongside several niche providers. Technological innovation, particularly in AI and automation, is a key driver, alongside increasing regulatory pressures for data security and interoperability. Competitive substitutes include in-house RCM departments, but the trend is toward outsourcing for efficiency and expertise. The end-user demographic comprises hospitals, laboratories, and other healthcare facilities, with hospitals currently representing the largest segment. Significant M&A activity has reshaped the industry, with larger players consolidating their market positions.
- Market Concentration: Moderately concentrated, with top 5 players holding approximately xx% market share in 2025.
- Technological Innovation: AI-powered automation, cloud-based solutions, and blockchain technology are driving efficiency gains.
- Regulatory Framework: HIPAA compliance, ICD-10 coding, and data privacy regulations significantly impact RCM operations.
- M&A Activity: An average of xx M&A deals per year observed during the historical period (2019-2024), with a projected increase to xx deals annually during the forecast period.
- Innovation Barriers: High initial investment costs for advanced technologies, integration complexities with existing EHR systems, and resistance to change among healthcare providers.
Revenue Cycle Management Industry Growth Trends & Insights
The global RCM market experienced robust growth throughout the historical period, driven by increasing healthcare spending, rising adoption of EHR systems, and the growing need for improved financial performance among healthcare providers. The market size expanded from xx million in 2019 to xx million in 2024, exhibiting a CAGR of xx%. This positive trend is expected to continue, with the market projected to reach xx million by 2033, fueled by factors such as increasing healthcare data volume, demand for enhanced revenue cycle automation, and the expansion of telehealth services. The cloud-based segment is showing significant growth and market penetration, surpassing on-premise solutions. Consumer behavior shifts towards value-based care models are further contributing to market expansion.
Dominant Regions, Countries, or Segments in Revenue Cycle Management Industry
North America currently dominates the RCM market, driven by high healthcare spending, advanced technological adoption, and stringent regulatory compliance requirements. Within this region, the United States holds the largest market share. The cloud-based deployment model is experiencing the fastest growth globally, fueled by scalability, cost-effectiveness, and improved accessibility. In terms of function, Claims and Denial Management and Medical Coding and Billing constitute the largest segments, reflecting the core RCM processes. Hospitals remain the primary end-users, owing to their large volumes of transactions and complex billing procedures.
- Key Drivers (North America): High healthcare expenditure, robust technological infrastructure, stringent regulatory compliance, established healthcare IT ecosystem.
- Key Drivers (Cloud-based): Cost-effectiveness, scalability, accessibility, improved data security and collaboration.
- Key Drivers (Claims & Denial Management): Rising claim denials, stringent payer requirements, and need for automated solutions.
- Key Drivers (Hospitals): High transaction volume, complex billing procedures, and increased pressure for improved financial performance.
Revenue Cycle Management Industry Product Landscape
RCM solutions are evolving rapidly, incorporating AI and machine learning for tasks like automated coding, claims processing, and denial management. Products integrate with EHR systems for seamless data flow and analytics capabilities. Key performance metrics include improved claim submission rates, reduced denial rates, faster payment cycles, and optimized revenue capture. Many vendors offer specialized solutions tailored to specific healthcare settings (hospitals, physician practices), while others provide comprehensive platform solutions. Unique selling propositions often include proprietary algorithms, superior data analytics, or specialized integration capabilities.
Key Drivers, Barriers & Challenges in Revenue Cycle Management Industry
Key Drivers: Increasing healthcare data volume, stringent regulatory compliance requirements, the shift towards value-based care, and the growing adoption of cloud-based technologies are key drivers. The need to improve operational efficiency and reduce costs within healthcare organizations also fuels market expansion.
Key Challenges: High implementation costs, data security concerns, interoperability issues between different systems, and the need for skilled personnel are significant barriers. Furthermore, resistance to adopting new technologies among healthcare providers and the complexity of regulatory landscapes pose challenges. Supply chain disruptions can also impact the availability of necessary resources and equipment.
Emerging Opportunities in Revenue Cycle Management Industry
Untapped markets exist in developing economies with growing healthcare infrastructures. The integration of telehealth platforms with RCM systems presents a significant opportunity, as does the development of AI-powered predictive analytics for revenue forecasting and risk management. Growing emphasis on patient experience and engagement provides opportunities for innovative solutions that enhance patient communication and payment processes.
Growth Accelerators in the Revenue Cycle Management Industry Industry
Technological advancements, strategic partnerships between RCM providers and healthcare technology companies, and expansion into new geographic markets are driving long-term growth. Increasing adoption of value-based care models also creates significant opportunities for RCM providers to demonstrate their value in optimizing revenue capture under alternative payment models.
Key Players Shaping the Revenue Cycle Management Industry Market
- Mckesson Corporation
- Infosys Limited
- Athenahealth
- Constellation Software Inc
- eClinicalWorks
- Epic Systems Corporation
- R1 RCM Inc
- Accenture
- GeBBs
- Veradigm LLC
- Conifer Health Solutions LLC
- Oracle
Notable Milestones in Revenue Cycle Management Industry Sector
- February 2024: Konwtian Health was awarded as the top healthcare revenue cycle management company in the United States by the Health Tech Outlook Magazine due to its innovative technological contributions to the advancement of healthcare administration.
- November 2023: Nym expanded its strengths to revenue cycle management solutions by helping hospitals and healthcare facilities automate medical coding for inpatient care.
In-Depth Revenue Cycle Management Industry Market Outlook
The RCM market is poised for continued growth, driven by technological innovation, increasing demand for efficient revenue cycle management solutions, and the expansion of value-based care. Strategic partnerships, expansion into new markets, and the development of AI-powered solutions will further fuel market expansion. Opportunities exist for companies that can effectively address the challenges of data security, interoperability, and regulatory compliance, while simultaneously improving the patient experience. The long-term outlook for the RCM industry remains positive, with significant potential for growth and innovation.
Revenue Cycle Management Industry Segmentation
-
1. Deployment
- 1.1. Cloud-based
- 1.2. On-premise
-
2. Function
- 2.1. Claims and Denial Management
- 2.2. Medical Coding and Billing
- 2.3. Electronic Health Record (EHR)
- 2.4. Clinical Documentation Improvement (CDI)
- 2.5. Insurance
- 2.6. Other Functions
-
3. End User
- 3.1. Hospitals
- 3.2. Laboratories
- 3.3. Other End Users
Revenue Cycle Management Industry Segmentation By Geography
-
1. North America
- 1.1. United States
- 1.2. Canada
- 1.3. Mexico
-
2. Europe
- 2.1. Germany
- 2.2. United Kingdom
- 2.3. France
- 2.4. Italy
- 2.5. Spain
- 2.6. Rest of Europe
-
3. Asia Pacific
- 3.1. China
- 3.2. Japan
- 3.3. India
- 3.4. Australia
- 3.5. South Korea
- 3.6. Rest of Asia Pacific
-
4. Middle East and Africa
- 4.1. GCC
- 4.2. South Africa
- 4.3. Rest of Middle East and Africa
-
5. South America
- 5.1. Brazil
- 5.2. Argentina
- 5.3. Rest of South America
Revenue Cycle Management Industry Regional Market Share
Geographic Coverage of Revenue Cycle Management Industry
Revenue Cycle Management Industry REPORT HIGHLIGHTS
| Aspects | Details |
|---|---|
| Study Period | 2020-2034 |
| Base Year | 2025 |
| Estimated Year | 2026 |
| Forecast Period | 2026-2034 |
| Historical Period | 2020-2025 |
| Growth Rate | CAGR of 11.73% from 2020-2034 |
| Segmentation |
|
Table of Contents
- 1. Introduction
- 1.1. Research Scope
- 1.2. Market Segmentation
- 1.3. Research Objective
- 1.4. Definitions and Assumptions
- 2. Executive Summary
- 2.1. Market Snapshot
- 3. Market Dynamics
- 3.1. Market Drivers
- 3.2. Market Restrains
- 3.3. Market Trends
- 3.4. Market Opportunities
- 4. Market Factor Analysis
- 4.1. Porters Five Forces
- 4.1.1. Bargaining Power of Suppliers
- 4.1.2. Bargaining Power of Buyers
- 4.1.3. Threat of New Entrants
- 4.1.4. Threat of Substitutes
- 4.1.5. Competitive Rivalry
- 4.2. PESTEL analysis
- 4.3. BCG Analysis
- 4.3.1. Stars (High Growth, High Market Share)
- 4.3.2. Cash Cows (Low Growth, High Market Share)
- 4.3.3. Question Mark (High Growth, Low Market Share)
- 4.3.4. Dogs (Low Growth, Low Market Share)
- 4.4. Ansoff Matrix Analysis
- 4.5. Supply Chain Analysis
- 4.6. Regulatory Landscape
- 4.7. Current Market Potential and Opportunity Assessment (TAM–SAM–SOM Framework)
- 4.8. IMR Analyst Note
- 4.1. Porters Five Forces
- 5. Market Analysis, Insights and Forecast 2021-2033
- 5.1. Market Analysis, Insights and Forecast - by Deployment
- 5.1.1. Cloud-based
- 5.1.2. On-premise
- 5.2. Market Analysis, Insights and Forecast - by Function
- 5.2.1. Claims and Denial Management
- 5.2.2. Medical Coding and Billing
- 5.2.3. Electronic Health Record (EHR)
- 5.2.4. Clinical Documentation Improvement (CDI)
- 5.2.5. Insurance
- 5.2.6. Other Functions
- 5.3. Market Analysis, Insights and Forecast - by End User
- 5.3.1. Hospitals
- 5.3.2. Laboratories
- 5.3.3. Other End Users
- 5.4. Market Analysis, Insights and Forecast - by Region
- 5.4.1. North America
- 5.4.2. Europe
- 5.4.3. Asia Pacific
- 5.4.4. Middle East and Africa
- 5.4.5. South America
- 5.1. Market Analysis, Insights and Forecast - by Deployment
- 6. Global Revenue Cycle Management Industry Analysis, Insights and Forecast, 2021-2033
- 6.1. Market Analysis, Insights and Forecast - by Deployment
- 6.1.1. Cloud-based
- 6.1.2. On-premise
- 6.2. Market Analysis, Insights and Forecast - by Function
- 6.2.1. Claims and Denial Management
- 6.2.2. Medical Coding and Billing
- 6.2.3. Electronic Health Record (EHR)
- 6.2.4. Clinical Documentation Improvement (CDI)
- 6.2.5. Insurance
- 6.2.6. Other Functions
- 6.3. Market Analysis, Insights and Forecast - by End User
- 6.3.1. Hospitals
- 6.3.2. Laboratories
- 6.3.3. Other End Users
- 6.1. Market Analysis, Insights and Forecast - by Deployment
- 7. North America Revenue Cycle Management Industry Analysis, Insights and Forecast, 2020-2032
- 7.1. Market Analysis, Insights and Forecast - by Deployment
- 7.1.1. Cloud-based
- 7.1.2. On-premise
- 7.2. Market Analysis, Insights and Forecast - by Function
- 7.2.1. Claims and Denial Management
- 7.2.2. Medical Coding and Billing
- 7.2.3. Electronic Health Record (EHR)
- 7.2.4. Clinical Documentation Improvement (CDI)
- 7.2.5. Insurance
- 7.2.6. Other Functions
- 7.3. Market Analysis, Insights and Forecast - by End User
- 7.3.1. Hospitals
- 7.3.2. Laboratories
- 7.3.3. Other End Users
- 7.1. Market Analysis, Insights and Forecast - by Deployment
- 8. Europe Revenue Cycle Management Industry Analysis, Insights and Forecast, 2020-2032
- 8.1. Market Analysis, Insights and Forecast - by Deployment
- 8.1.1. Cloud-based
- 8.1.2. On-premise
- 8.2. Market Analysis, Insights and Forecast - by Function
- 8.2.1. Claims and Denial Management
- 8.2.2. Medical Coding and Billing
- 8.2.3. Electronic Health Record (EHR)
- 8.2.4. Clinical Documentation Improvement (CDI)
- 8.2.5. Insurance
- 8.2.6. Other Functions
- 8.3. Market Analysis, Insights and Forecast - by End User
- 8.3.1. Hospitals
- 8.3.2. Laboratories
- 8.3.3. Other End Users
- 8.1. Market Analysis, Insights and Forecast - by Deployment
- 9. Asia Pacific Revenue Cycle Management Industry Analysis, Insights and Forecast, 2020-2032
- 9.1. Market Analysis, Insights and Forecast - by Deployment
- 9.1.1. Cloud-based
- 9.1.2. On-premise
- 9.2. Market Analysis, Insights and Forecast - by Function
- 9.2.1. Claims and Denial Management
- 9.2.2. Medical Coding and Billing
- 9.2.3. Electronic Health Record (EHR)
- 9.2.4. Clinical Documentation Improvement (CDI)
- 9.2.5. Insurance
- 9.2.6. Other Functions
- 9.3. Market Analysis, Insights and Forecast - by End User
- 9.3.1. Hospitals
- 9.3.2. Laboratories
- 9.3.3. Other End Users
- 9.1. Market Analysis, Insights and Forecast - by Deployment
- 10. Middle East and Africa Revenue Cycle Management Industry Analysis, Insights and Forecast, 2020-2032
- 10.1. Market Analysis, Insights and Forecast - by Deployment
- 10.1.1. Cloud-based
- 10.1.2. On-premise
- 10.2. Market Analysis, Insights and Forecast - by Function
- 10.2.1. Claims and Denial Management
- 10.2.2. Medical Coding and Billing
- 10.2.3. Electronic Health Record (EHR)
- 10.2.4. Clinical Documentation Improvement (CDI)
- 10.2.5. Insurance
- 10.2.6. Other Functions
- 10.3. Market Analysis, Insights and Forecast - by End User
- 10.3.1. Hospitals
- 10.3.2. Laboratories
- 10.3.3. Other End Users
- 10.1. Market Analysis, Insights and Forecast - by Deployment
- 11. South America Revenue Cycle Management Industry Analysis, Insights and Forecast, 2020-2032
- 11.1. Market Analysis, Insights and Forecast - by Deployment
- 11.1.1. Cloud-based
- 11.1.2. On-premise
- 11.2. Market Analysis, Insights and Forecast - by Function
- 11.2.1. Claims and Denial Management
- 11.2.2. Medical Coding and Billing
- 11.2.3. Electronic Health Record (EHR)
- 11.2.4. Clinical Documentation Improvement (CDI)
- 11.2.5. Insurance
- 11.2.6. Other Functions
- 11.3. Market Analysis, Insights and Forecast - by End User
- 11.3.1. Hospitals
- 11.3.2. Laboratories
- 11.3.3. Other End Users
- 11.1. Market Analysis, Insights and Forecast - by Deployment
- 12. Competitive Analysis
- 12.1. Company Profiles
- 12.1.1 Mckesson Corporation
- 12.1.1.1. Company Overview
- 12.1.1.2. Products
- 12.1.1.3. Company Financials
- 12.1.1.4. SWOT Analysis
- 12.1.2 Infosys Limited
- 12.1.2.1. Company Overview
- 12.1.2.2. Products
- 12.1.2.3. Company Financials
- 12.1.2.4. SWOT Analysis
- 12.1.3 Athenahealth
- 12.1.3.1. Company Overview
- 12.1.3.2. Products
- 12.1.3.3. Company Financials
- 12.1.3.4. SWOT Analysis
- 12.1.4 Constellation Software Inc
- 12.1.4.1. Company Overview
- 12.1.4.2. Products
- 12.1.4.3. Company Financials
- 12.1.4.4. SWOT Analysis
- 12.1.5 eClinicalWorks
- 12.1.5.1. Company Overview
- 12.1.5.2. Products
- 12.1.5.3. Company Financials
- 12.1.5.4. SWOT Analysis
- 12.1.6 Epic Systems Corporation
- 12.1.6.1. Company Overview
- 12.1.6.2. Products
- 12.1.6.3. Company Financials
- 12.1.6.4. SWOT Analysis
- 12.1.7 R1 RCM Inc
- 12.1.7.1. Company Overview
- 12.1.7.2. Products
- 12.1.7.3. Company Financials
- 12.1.7.4. SWOT Analysis
- 12.1.8 Accenture
- 12.1.8.1. Company Overview
- 12.1.8.2. Products
- 12.1.8.3. Company Financials
- 12.1.8.4. SWOT Analysis
- 12.1.9 GeBBs
- 12.1.9.1. Company Overview
- 12.1.9.2. Products
- 12.1.9.3. Company Financials
- 12.1.9.4. SWOT Analysis
- 12.1.10 Veradigm LLC
- 12.1.10.1. Company Overview
- 12.1.10.2. Products
- 12.1.10.3. Company Financials
- 12.1.10.4. SWOT Analysis
- 12.1.11 Conifer Health Solutions LLC
- 12.1.11.1. Company Overview
- 12.1.11.2. Products
- 12.1.11.3. Company Financials
- 12.1.11.4. SWOT Analysis
- 12.1.12 Oracle
- 12.1.12.1. Company Overview
- 12.1.12.2. Products
- 12.1.12.3. Company Financials
- 12.1.12.4. SWOT Analysis
- 12.1.1 Mckesson Corporation
- 12.2. Market Entropy
- 12.2.1 Company's Key Areas Served
- 12.2.2 Recent Developments
- 12.3. Company Market Share Analysis 2025
- 12.3.1 Top 5 Companies Market Share Analysis
- 12.3.2 Top 3 Companies Market Share Analysis
- 12.4. List of Potential Customers
- 13. Research Methodology
List of Figures
- Figure 1: Global Revenue Cycle Management Industry Revenue Breakdown (Million, %) by Region 2025 & 2033
- Figure 2: North America Revenue Cycle Management Industry Revenue (Million), by Deployment 2025 & 2033
- Figure 3: North America Revenue Cycle Management Industry Revenue Share (%), by Deployment 2025 & 2033
- Figure 4: North America Revenue Cycle Management Industry Revenue (Million), by Function 2025 & 2033
- Figure 5: North America Revenue Cycle Management Industry Revenue Share (%), by Function 2025 & 2033
- Figure 6: North America Revenue Cycle Management Industry Revenue (Million), by End User 2025 & 2033
- Figure 7: North America Revenue Cycle Management Industry Revenue Share (%), by End User 2025 & 2033
- Figure 8: North America Revenue Cycle Management Industry Revenue (Million), by Country 2025 & 2033
- Figure 9: North America Revenue Cycle Management Industry Revenue Share (%), by Country 2025 & 2033
- Figure 10: Europe Revenue Cycle Management Industry Revenue (Million), by Deployment 2025 & 2033
- Figure 11: Europe Revenue Cycle Management Industry Revenue Share (%), by Deployment 2025 & 2033
- Figure 12: Europe Revenue Cycle Management Industry Revenue (Million), by Function 2025 & 2033
- Figure 13: Europe Revenue Cycle Management Industry Revenue Share (%), by Function 2025 & 2033
- Figure 14: Europe Revenue Cycle Management Industry Revenue (Million), by End User 2025 & 2033
- Figure 15: Europe Revenue Cycle Management Industry Revenue Share (%), by End User 2025 & 2033
- Figure 16: Europe Revenue Cycle Management Industry Revenue (Million), by Country 2025 & 2033
- Figure 17: Europe Revenue Cycle Management Industry Revenue Share (%), by Country 2025 & 2033
- Figure 18: Asia Pacific Revenue Cycle Management Industry Revenue (Million), by Deployment 2025 & 2033
- Figure 19: Asia Pacific Revenue Cycle Management Industry Revenue Share (%), by Deployment 2025 & 2033
- Figure 20: Asia Pacific Revenue Cycle Management Industry Revenue (Million), by Function 2025 & 2033
- Figure 21: Asia Pacific Revenue Cycle Management Industry Revenue Share (%), by Function 2025 & 2033
- Figure 22: Asia Pacific Revenue Cycle Management Industry Revenue (Million), by End User 2025 & 2033
- Figure 23: Asia Pacific Revenue Cycle Management Industry Revenue Share (%), by End User 2025 & 2033
- Figure 24: Asia Pacific Revenue Cycle Management Industry Revenue (Million), by Country 2025 & 2033
- Figure 25: Asia Pacific Revenue Cycle Management Industry Revenue Share (%), by Country 2025 & 2033
- Figure 26: Middle East and Africa Revenue Cycle Management Industry Revenue (Million), by Deployment 2025 & 2033
- Figure 27: Middle East and Africa Revenue Cycle Management Industry Revenue Share (%), by Deployment 2025 & 2033
- Figure 28: Middle East and Africa Revenue Cycle Management Industry Revenue (Million), by Function 2025 & 2033
- Figure 29: Middle East and Africa Revenue Cycle Management Industry Revenue Share (%), by Function 2025 & 2033
- Figure 30: Middle East and Africa Revenue Cycle Management Industry Revenue (Million), by End User 2025 & 2033
- Figure 31: Middle East and Africa Revenue Cycle Management Industry Revenue Share (%), by End User 2025 & 2033
- Figure 32: Middle East and Africa Revenue Cycle Management Industry Revenue (Million), by Country 2025 & 2033
- Figure 33: Middle East and Africa Revenue Cycle Management Industry Revenue Share (%), by Country 2025 & 2033
- Figure 34: South America Revenue Cycle Management Industry Revenue (Million), by Deployment 2025 & 2033
- Figure 35: South America Revenue Cycle Management Industry Revenue Share (%), by Deployment 2025 & 2033
- Figure 36: South America Revenue Cycle Management Industry Revenue (Million), by Function 2025 & 2033
- Figure 37: South America Revenue Cycle Management Industry Revenue Share (%), by Function 2025 & 2033
- Figure 38: South America Revenue Cycle Management Industry Revenue (Million), by End User 2025 & 2033
- Figure 39: South America Revenue Cycle Management Industry Revenue Share (%), by End User 2025 & 2033
- Figure 40: South America Revenue Cycle Management Industry Revenue (Million), by Country 2025 & 2033
- Figure 41: South America Revenue Cycle Management Industry Revenue Share (%), by Country 2025 & 2033
List of Tables
- Table 1: Global Revenue Cycle Management Industry Revenue Million Forecast, by Deployment 2020 & 2033
- Table 2: Global Revenue Cycle Management Industry Revenue Million Forecast, by Function 2020 & 2033
- Table 3: Global Revenue Cycle Management Industry Revenue Million Forecast, by End User 2020 & 2033
- Table 4: Global Revenue Cycle Management Industry Revenue Million Forecast, by Region 2020 & 2033
- Table 5: Global Revenue Cycle Management Industry Revenue Million Forecast, by Deployment 2020 & 2033
- Table 6: Global Revenue Cycle Management Industry Revenue Million Forecast, by Function 2020 & 2033
- Table 7: Global Revenue Cycle Management Industry Revenue Million Forecast, by End User 2020 & 2033
- Table 8: Global Revenue Cycle Management Industry Revenue Million Forecast, by Country 2020 & 2033
- Table 9: United States Revenue Cycle Management Industry Revenue (Million) Forecast, by Application 2020 & 2033
- Table 10: Canada Revenue Cycle Management Industry Revenue (Million) Forecast, by Application 2020 & 2033
- Table 11: Mexico Revenue Cycle Management Industry Revenue (Million) Forecast, by Application 2020 & 2033
- Table 12: Global Revenue Cycle Management Industry Revenue Million Forecast, by Deployment 2020 & 2033
- Table 13: Global Revenue Cycle Management Industry Revenue Million Forecast, by Function 2020 & 2033
- Table 14: Global Revenue Cycle Management Industry Revenue Million Forecast, by End User 2020 & 2033
- Table 15: Global Revenue Cycle Management Industry Revenue Million Forecast, by Country 2020 & 2033
- Table 16: Germany Revenue Cycle Management Industry Revenue (Million) Forecast, by Application 2020 & 2033
- Table 17: United Kingdom Revenue Cycle Management Industry Revenue (Million) Forecast, by Application 2020 & 2033
- Table 18: France Revenue Cycle Management Industry Revenue (Million) Forecast, by Application 2020 & 2033
- Table 19: Italy Revenue Cycle Management Industry Revenue (Million) Forecast, by Application 2020 & 2033
- Table 20: Spain Revenue Cycle Management Industry Revenue (Million) Forecast, by Application 2020 & 2033
- Table 21: Rest of Europe Revenue Cycle Management Industry Revenue (Million) Forecast, by Application 2020 & 2033
- Table 22: Global Revenue Cycle Management Industry Revenue Million Forecast, by Deployment 2020 & 2033
- Table 23: Global Revenue Cycle Management Industry Revenue Million Forecast, by Function 2020 & 2033
- Table 24: Global Revenue Cycle Management Industry Revenue Million Forecast, by End User 2020 & 2033
- Table 25: Global Revenue Cycle Management Industry Revenue Million Forecast, by Country 2020 & 2033
- Table 26: China Revenue Cycle Management Industry Revenue (Million) Forecast, by Application 2020 & 2033
- Table 27: Japan Revenue Cycle Management Industry Revenue (Million) Forecast, by Application 2020 & 2033
- Table 28: India Revenue Cycle Management Industry Revenue (Million) Forecast, by Application 2020 & 2033
- Table 29: Australia Revenue Cycle Management Industry Revenue (Million) Forecast, by Application 2020 & 2033
- Table 30: South Korea Revenue Cycle Management Industry Revenue (Million) Forecast, by Application 2020 & 2033
- Table 31: Rest of Asia Pacific Revenue Cycle Management Industry Revenue (Million) Forecast, by Application 2020 & 2033
- Table 32: Global Revenue Cycle Management Industry Revenue Million Forecast, by Deployment 2020 & 2033
- Table 33: Global Revenue Cycle Management Industry Revenue Million Forecast, by Function 2020 & 2033
- Table 34: Global Revenue Cycle Management Industry Revenue Million Forecast, by End User 2020 & 2033
- Table 35: Global Revenue Cycle Management Industry Revenue Million Forecast, by Country 2020 & 2033
- Table 36: GCC Revenue Cycle Management Industry Revenue (Million) Forecast, by Application 2020 & 2033
- Table 37: South Africa Revenue Cycle Management Industry Revenue (Million) Forecast, by Application 2020 & 2033
- Table 38: Rest of Middle East and Africa Revenue Cycle Management Industry Revenue (Million) Forecast, by Application 2020 & 2033
- Table 39: Global Revenue Cycle Management Industry Revenue Million Forecast, by Deployment 2020 & 2033
- Table 40: Global Revenue Cycle Management Industry Revenue Million Forecast, by Function 2020 & 2033
- Table 41: Global Revenue Cycle Management Industry Revenue Million Forecast, by End User 2020 & 2033
- Table 42: Global Revenue Cycle Management Industry Revenue Million Forecast, by Country 2020 & 2033
- Table 43: Brazil Revenue Cycle Management Industry Revenue (Million) Forecast, by Application 2020 & 2033
- Table 44: Argentina Revenue Cycle Management Industry Revenue (Million) Forecast, by Application 2020 & 2033
- Table 45: Rest of South America Revenue Cycle Management Industry Revenue (Million) Forecast, by Application 2020 & 2033
Frequently Asked Questions
1. What is the projected Compound Annual Growth Rate (CAGR) of the Revenue Cycle Management Industry?
The projected CAGR is approximately 11.73%.
2. Which companies are prominent players in the Revenue Cycle Management Industry?
Key companies in the market include Mckesson Corporation, Infosys Limited, Athenahealth, Constellation Software Inc, eClinicalWorks, Epic Systems Corporation, R1 RCM Inc, Accenture, GeBBs, Veradigm LLC, Conifer Health Solutions LLC, Oracle.
3. What are the main segments of the Revenue Cycle Management Industry?
The market segments include Deployment, Function, End User.
4. Can you provide details about the market size?
The market size is estimated to be USD 60.28 Million as of 2022.
5. What are some drivers contributing to market growth?
Government Initiatives to Boost the Adoption of RCM Solutions; Increasing Revenue Loss Due to Billing Errors; Process Improvements in Healthcare Organizations.
6. What are the notable trends driving market growth?
The Claims and Denial Management Segment is Expected to Witness Significant Growth Over the Forecast Period.
7. Are there any restraints impacting market growth?
High Pricing and Maintenance of RCM Solutions; Lack of Proper IT Infrastructure.
8. Can you provide examples of recent developments in the market?
February 2024: Konwtian Health was awarded as the top healthcare revenue cycle management company in the United States by the Health Tech Outlook Magazine due to its innovative technological contributions to the advancement of healthcare administration.
9. What pricing options are available for accessing the report?
Pricing options include single-user, multi-user, and enterprise licenses priced at USD 4750, USD 5250, and USD 8750 respectively.
10. Is the market size provided in terms of value or volume?
The market size is provided in terms of value, measured in Million.
11. Are there any specific market keywords associated with the report?
Yes, the market keyword associated with the report is "Revenue Cycle Management Industry," which aids in identifying and referencing the specific market segment covered.
12. How do I determine which pricing option suits my needs best?
The pricing options vary based on user requirements and access needs. Individual users may opt for single-user licenses, while businesses requiring broader access may choose multi-user or enterprise licenses for cost-effective access to the report.
13. Are there any additional resources or data provided in the Revenue Cycle Management Industry report?
While the report offers comprehensive insights, it's advisable to review the specific contents or supplementary materials provided to ascertain if additional resources or data are available.
14. How can I stay updated on further developments or reports in the Revenue Cycle Management Industry?
To stay informed about further developments, trends, and reports in the Revenue Cycle Management Industry, consider subscribing to industry newsletters, following relevant companies and organizations, or regularly checking reputable industry news sources and publications.
Methodology
Step 1 - Identification of Relevant Samples Size from Population Database


Step 2 - Approaches for Defining Global Market Size (Value, Volume* & Price*)

Note*: In applicable scenarios
Step 3 - Data Sources
Primary Research
- Web Analytics
- Survey Reports
- Research Institute
- Latest Research Reports
- Opinion Leaders
Secondary Research
- Annual Reports
- White Paper
- Latest Press Release
- Industry Association
- Paid Database
- Investor Presentations

Step 4 - Data Triangulation
Involves using different sources of information in order to increase the validity of a study
These sources are likely to be stakeholders in a program - participants, other researchers, program staff, other community members, and so on.
Then we put all data in single framework & apply various statistical tools to find out the dynamic on the market.
During the analysis stage, feedback from the stakeholder groups would be compared to determine areas of agreement as well as areas of divergence