

Key Insights
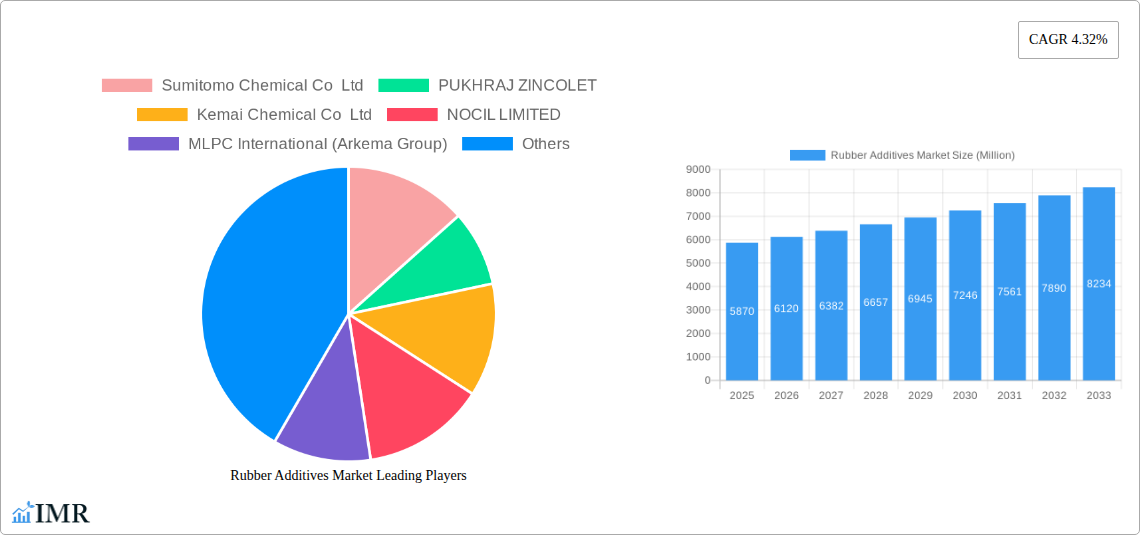
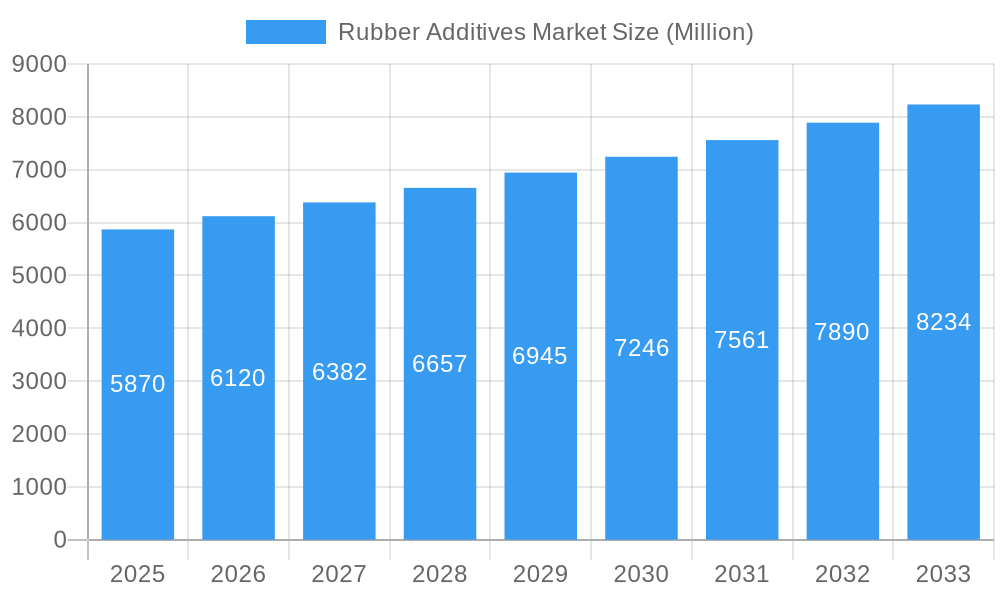
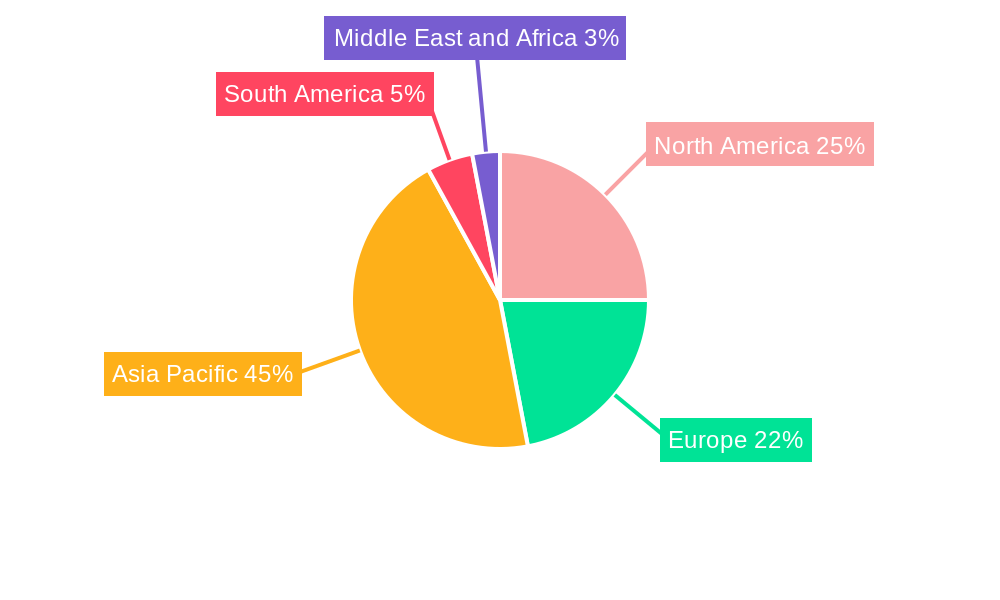
The global rubber additives market, valued at $5.87 billion in 2025, is projected to experience robust growth, driven by the burgeoning automotive and construction sectors. A compound annual growth rate (CAGR) of 4.32% from 2025 to 2033 indicates a significant expansion, reaching an estimated value exceeding $8 billion by 2033. Key drivers include increasing demand for high-performance tires, enhanced conveyor belt durability, and the growth of the electric vehicle market, which necessitates specialized rubber compounds. The market is segmented by type (activators, vulcanization inhibitors, plasticizers, and others), application (tires, conveyor belts, electric cables, and others), and fillers (carbon black, calcium carbonate, silica, and others). Asia Pacific, particularly China and India, currently dominates the market due to their large manufacturing bases and rapidly expanding infrastructure development. However, North America and Europe are expected to witness substantial growth, driven by stringent regulatory standards promoting enhanced rubber product performance and sustainability. Competition is intense, with major players like Sumitomo Chemical, BASF, and Lanxess vying for market share through innovation and strategic partnerships. Challenges include fluctuating raw material prices and evolving environmental regulations, necessitating manufacturers to adopt sustainable practices and innovative solutions.
Rubber Additives Market Market Size (In Billion)
The market's segmentation offers diverse growth opportunities. The tire segment is expected to retain its largest share, driven by the global automotive industry's expansion and the increasing demand for high-performance tires. Conveyor belts, benefiting from industrial automation and infrastructure development, also present a substantial growth avenue. The electric cable segment is poised for significant expansion due to the increasing adoption of electric vehicles and renewable energy infrastructure. Within the filler segment, carbon black maintains its dominance, owing to its superior reinforcing properties. However, silica and calcium carbonate are gaining traction due to their cost-effectiveness and growing demand for sustainable alternatives. The ongoing research and development efforts focused on improving the performance and sustainability of rubber additives are expected to fuel market expansion further, driving the adoption of eco-friendly and high-performance additives in various applications.
Rubber Additives Market Company Market Share
This comprehensive report provides an in-depth analysis of the Rubber Additives Market, encompassing market dynamics, growth trends, regional dominance, product landscape, key players, and future outlook. The study period covers 2019-2033, with 2025 as the base and estimated year. This report is crucial for industry professionals seeking to understand and capitalize on opportunities within this dynamic market.
Rubber Additives Market Dynamics & Structure
The global rubber additives market is characterized by moderate concentration, with several multinational corporations and regional players dominating the landscape. Technological innovation, particularly in sustainable and high-performance additives, is a significant driver, while stringent environmental regulations shape product development and manufacturing processes. The market experiences competitive pressure from substitute materials and faces evolving end-user demands. Mergers and acquisitions (M&A) activity has been steady, reflecting industry consolidation and expansion strategies.
- Market Concentration: Moderately concentrated, with top 10 players holding approximately xx% market share in 2024.
- Technological Innovation: Focus on sustainable additives (e.g., bio-based materials), improved performance characteristics (e.g., enhanced durability, reduced rolling resistance), and digitalization of manufacturing processes.
- Regulatory Framework: Stringent environmental regulations (e.g., REACH, RoHS) drive the development of eco-friendly additives.
- Competitive Product Substitutes: Competition from alternative materials in specific applications (e.g., plastics in some non-tire applications).
- End-User Demographics: Dominated by the automotive, construction, and industrial sectors, with increasing demand from emerging economies.
- M&A Trends: Steady level of M&A activity, primarily focused on expanding product portfolios and geographical reach. Approximately xx M&A deals were recorded between 2019 and 2024.
Rubber Additives Market Growth Trends & Insights
The Rubber Additives market exhibits robust growth, driven by increasing demand from key end-use sectors such as automotive and construction. The market size is projected to reach xx million units by 2033, exhibiting a CAGR of xx% during the forecast period (2025-2033). Technological disruptions, including the adoption of sustainable and high-performance additives, are reshaping market dynamics. Consumer preference shifts toward environmentally friendly products are also influencing the market. The market penetration of sustainable rubber additives is projected to increase from xx% in 2024 to xx% by 2033.
Dominant Regions, Countries, or Segments in Rubber Additives Market
The Asia-Pacific region currently holds the largest market share due to rapid industrialization and a surge in automotive production. Within this region, China and India are significant contributors. The Tire application segment dominates the market due to the high volume of tire production globally. Among additive types, Vulcanization Inhibitors hold a substantial market share, followed by Activators and Plasticizers. Carbon Black remains the leading filler material.
- Key Regional Drivers:
- Asia-Pacific: Rapid industrialization, growing automotive sector, and increasing infrastructure development.
- North America: Strong automotive industry and increasing demand for high-performance tires.
- Europe: Stringent environmental regulations driving the adoption of sustainable additives.
- Dominant Segments:
- Application: Tires (xx% market share), followed by Conveyor Belts and Electric Cables.
- Type: Vulcanization Inhibitors (xx% market share), Activators, Plasticizers, and Other Types.
- Fillers: Carbon Black (xx% market share), followed by Silica and Calcium Carbonate.
Rubber Additives Market Product Landscape
The rubber additives market showcases continuous product innovation, focusing on enhancing performance characteristics like durability, heat resistance, and processability. New products are tailored to specific applications, optimizing cost-effectiveness and environmental impact. Unique selling propositions emphasize sustainability, improved safety, and enhanced processing efficiencies, leading to increased adoption rates across industries. Technological advancements, such as the introduction of nanomaterials and bio-based additives, are transforming the product landscape.
Key Drivers, Barriers & Challenges in Rubber Additives Market
Key Drivers: Growing demand from the automotive and construction industries, increasing adoption of high-performance tires, stringent environmental regulations promoting sustainable additives, and technological advancements.
Challenges: Fluctuations in raw material prices, intense competition, and evolving regulatory landscapes. Supply chain disruptions caused by geopolitical factors and the COVID-19 pandemic have impacted production and pricing. The market faces challenges in terms of managing consistent supply of raw materials, and adjusting to constantly changing regulations.
Emerging Opportunities in Rubber Additives Market
Emerging opportunities include the growth of electric vehicles requiring specialized rubber components, expansion into developing economies, the increasing demand for sustainable and bio-based additives, and the development of innovative applications in sectors like renewable energy and healthcare. Untapped markets in developing regions present significant growth potential.
Growth Accelerators in the Rubber Additives Market Industry
Technological breakthroughs in materials science, strategic partnerships to leverage expertise and market access, and expansion strategies into high-growth sectors are accelerating market growth. The focus on sustainable and high-performance additives is a major growth catalyst.
Key Players Shaping the Rubber Additives Market Market
- Sumitomo Chemical Co Ltd
- PUKHRAJ ZINCOLET
- Kemai Chemical Co Ltd
- NOCIL LIMITED
- MLPC International (Arkema Group)
- Emery Oleochemicals
- BASF SE
- China Sunsine Chemical Holdings Limited
- Thomas Swan & Co Ltd
- Eastman Chemical Company
- Behn Meyer
- Rhein Chemie (Lanxess)
- China Petrochemical Corporation (SINOPEC)
Notable Milestones in Rubber Additives Market Sector
- June 2022: Evonik launched POLYVEST eCO, a sustainable liquid polybutadiene for tire manufacturing.
- July 2022: Birch Chemicals established a new entity in India to meet growing Asian market demand.
- February 2023: Yokohama Rubber Co., Ltd. announced a 60% expansion of passenger car tire production in India, increasing capacity to 4.5 million units per year.
In-Depth Rubber Additives Market Market Outlook
The Rubber Additives market is poised for continued growth, driven by technological advancements, increasing demand from key industries, and the growing focus on sustainability. Strategic partnerships and market expansion strategies will be crucial for companies seeking to capitalize on future opportunities. The market's future potential is significant, especially in emerging economies and new applications.
Rubber Additives Market Segmentation
-
1. Type
- 1.1. Activators
- 1.2. Vulcanization Inhibitors
- 1.3. Plasticizers
- 1.4. Other Types
-
2. Application
- 2.1. Tires
- 2.2. Conveyor Belts
- 2.3. Electric Cables
- 2.4. Other Applications
-
3. Fillers
- 3.1. Carbon Black
- 3.2. Calcium Carbonate
- 3.3. Silica
- 3.4. Other Fillers
Rubber Additives Market Segmentation By Geography
-
1. Asia Pacific
- 1.1. China
- 1.2. India
- 1.3. Japan
- 1.4. South Korea
- 1.5. Rest of Asia Pacific
-
2. North America
- 2.1. United States
- 2.2. Canada
- 2.3. Mexico
-
3. Europe
- 3.1. Germany
- 3.2. United Kingdom
- 3.3. France
- 3.4. Italy
- 3.5. Rest of Europe
-
4. South America
- 4.1. Brazil
- 4.2. Argentina
- 4.3. Rest of South America
-
5. Middle East and Africa
- 5.1. Saudi Arabia
- 5.2. South Africa
- 5.3. Rest of Middle East and Africa
Rubber Additives Market Regional Market Share
Geographic Coverage of Rubber Additives Market
Rubber Additives Market REPORT HIGHLIGHTS
| Aspects | Details |
|---|---|
| Study Period | 2020-2034 |
| Base Year | 2025 |
| Estimated Year | 2026 |
| Forecast Period | 2026-2034 |
| Historical Period | 2020-2025 |
| Growth Rate | CAGR of 4.32% from 2020-2034 |
| Segmentation |
|
Table of Contents
- 1. Introduction
- 1.1. Research Scope
- 1.2. Market Segmentation
- 1.3. Research Objective
- 1.4. Definitions and Assumptions
- 2. Executive Summary
- 2.1. Market Snapshot
- 3. Market Dynamics
- 3.1. Market Drivers
- 3.2. Market Restrains
- 3.3. Market Trends
- 3.4. Market Opportunities
- 4. Market Factor Analysis
- 4.1. Porters Five Forces
- 4.1.1. Bargaining Power of Suppliers
- 4.1.2. Bargaining Power of Buyers
- 4.1.3. Threat of New Entrants
- 4.1.4. Threat of Substitutes
- 4.1.5. Competitive Rivalry
- 4.2. PESTEL analysis
- 4.3. BCG Analysis
- 4.3.1. Stars (High Growth, High Market Share)
- 4.3.2. Cash Cows (Low Growth, High Market Share)
- 4.3.3. Question Mark (High Growth, Low Market Share)
- 4.3.4. Dogs (Low Growth, Low Market Share)
- 4.4. Ansoff Matrix Analysis
- 4.5. Supply Chain Analysis
- 4.6. Regulatory Landscape
- 4.7. Current Market Potential and Opportunity Assessment (TAM–SAM–SOM Framework)
- 4.8. IMR Analyst Note
- 4.1. Porters Five Forces
- 5. Market Analysis, Insights and Forecast 2021-2033
- 5.1. Market Analysis, Insights and Forecast - by Type
- 5.1.1. Activators
- 5.1.2. Vulcanization Inhibitors
- 5.1.3. Plasticizers
- 5.1.4. Other Types
- 5.2. Market Analysis, Insights and Forecast - by Application
- 5.2.1. Tires
- 5.2.2. Conveyor Belts
- 5.2.3. Electric Cables
- 5.2.4. Other Applications
- 5.3. Market Analysis, Insights and Forecast - by Fillers
- 5.3.1. Carbon Black
- 5.3.2. Calcium Carbonate
- 5.3.3. Silica
- 5.3.4. Other Fillers
- 5.4. Market Analysis, Insights and Forecast - by Region
- 5.4.1. Asia Pacific
- 5.4.2. North America
- 5.4.3. Europe
- 5.4.4. South America
- 5.4.5. Middle East and Africa
- 5.1. Market Analysis, Insights and Forecast - by Type
- 6. Global Rubber Additives Market Analysis, Insights and Forecast, 2021-2033
- 6.1. Market Analysis, Insights and Forecast - by Type
- 6.1.1. Activators
- 6.1.2. Vulcanization Inhibitors
- 6.1.3. Plasticizers
- 6.1.4. Other Types
- 6.2. Market Analysis, Insights and Forecast - by Application
- 6.2.1. Tires
- 6.2.2. Conveyor Belts
- 6.2.3. Electric Cables
- 6.2.4. Other Applications
- 6.3. Market Analysis, Insights and Forecast - by Fillers
- 6.3.1. Carbon Black
- 6.3.2. Calcium Carbonate
- 6.3.3. Silica
- 6.3.4. Other Fillers
- 6.1. Market Analysis, Insights and Forecast - by Type
- 7. Asia Pacific Rubber Additives Market Analysis, Insights and Forecast, 2020-2032
- 7.1. Market Analysis, Insights and Forecast - by Type
- 7.1.1. Activators
- 7.1.2. Vulcanization Inhibitors
- 7.1.3. Plasticizers
- 7.1.4. Other Types
- 7.2. Market Analysis, Insights and Forecast - by Application
- 7.2.1. Tires
- 7.2.2. Conveyor Belts
- 7.2.3. Electric Cables
- 7.2.4. Other Applications
- 7.3. Market Analysis, Insights and Forecast - by Fillers
- 7.3.1. Carbon Black
- 7.3.2. Calcium Carbonate
- 7.3.3. Silica
- 7.3.4. Other Fillers
- 7.1. Market Analysis, Insights and Forecast - by Type
- 8. North America Rubber Additives Market Analysis, Insights and Forecast, 2020-2032
- 8.1. Market Analysis, Insights and Forecast - by Type
- 8.1.1. Activators
- 8.1.2. Vulcanization Inhibitors
- 8.1.3. Plasticizers
- 8.1.4. Other Types
- 8.2. Market Analysis, Insights and Forecast - by Application
- 8.2.1. Tires
- 8.2.2. Conveyor Belts
- 8.2.3. Electric Cables
- 8.2.4. Other Applications
- 8.3. Market Analysis, Insights and Forecast - by Fillers
- 8.3.1. Carbon Black
- 8.3.2. Calcium Carbonate
- 8.3.3. Silica
- 8.3.4. Other Fillers
- 8.1. Market Analysis, Insights and Forecast - by Type
- 9. Europe Rubber Additives Market Analysis, Insights and Forecast, 2020-2032
- 9.1. Market Analysis, Insights and Forecast - by Type
- 9.1.1. Activators
- 9.1.2. Vulcanization Inhibitors
- 9.1.3. Plasticizers
- 9.1.4. Other Types
- 9.2. Market Analysis, Insights and Forecast - by Application
- 9.2.1. Tires
- 9.2.2. Conveyor Belts
- 9.2.3. Electric Cables
- 9.2.4. Other Applications
- 9.3. Market Analysis, Insights and Forecast - by Fillers
- 9.3.1. Carbon Black
- 9.3.2. Calcium Carbonate
- 9.3.3. Silica
- 9.3.4. Other Fillers
- 9.1. Market Analysis, Insights and Forecast - by Type
- 10. South America Rubber Additives Market Analysis, Insights and Forecast, 2020-2032
- 10.1. Market Analysis, Insights and Forecast - by Type
- 10.1.1. Activators
- 10.1.2. Vulcanization Inhibitors
- 10.1.3. Plasticizers
- 10.1.4. Other Types
- 10.2. Market Analysis, Insights and Forecast - by Application
- 10.2.1. Tires
- 10.2.2. Conveyor Belts
- 10.2.3. Electric Cables
- 10.2.4. Other Applications
- 10.3. Market Analysis, Insights and Forecast - by Fillers
- 10.3.1. Carbon Black
- 10.3.2. Calcium Carbonate
- 10.3.3. Silica
- 10.3.4. Other Fillers
- 10.1. Market Analysis, Insights and Forecast - by Type
- 11. Middle East and Africa Rubber Additives Market Analysis, Insights and Forecast, 2020-2032
- 11.1. Market Analysis, Insights and Forecast - by Type
- 11.1.1. Activators
- 11.1.2. Vulcanization Inhibitors
- 11.1.3. Plasticizers
- 11.1.4. Other Types
- 11.2. Market Analysis, Insights and Forecast - by Application
- 11.2.1. Tires
- 11.2.2. Conveyor Belts
- 11.2.3. Electric Cables
- 11.2.4. Other Applications
- 11.3. Market Analysis, Insights and Forecast - by Fillers
- 11.3.1. Carbon Black
- 11.3.2. Calcium Carbonate
- 11.3.3. Silica
- 11.3.4. Other Fillers
- 11.1. Market Analysis, Insights and Forecast - by Type
- 12. Competitive Analysis
- 12.1. Company Profiles
- 12.1.1 Sumitomo Chemical Co Ltd
- 12.1.1.1. Company Overview
- 12.1.1.2. Products
- 12.1.1.3. Company Financials
- 12.1.1.4. SWOT Analysis
- 12.1.2 PUKHRAJ ZINCOLET
- 12.1.2.1. Company Overview
- 12.1.2.2. Products
- 12.1.2.3. Company Financials
- 12.1.2.4. SWOT Analysis
- 12.1.3 Kemai Chemical Co Ltd
- 12.1.3.1. Company Overview
- 12.1.3.2. Products
- 12.1.3.3. Company Financials
- 12.1.3.4. SWOT Analysis
- 12.1.4 NOCIL LIMITED
- 12.1.4.1. Company Overview
- 12.1.4.2. Products
- 12.1.4.3. Company Financials
- 12.1.4.4. SWOT Analysis
- 12.1.5 MLPC International (Arkema Group)
- 12.1.5.1. Company Overview
- 12.1.5.2. Products
- 12.1.5.3. Company Financials
- 12.1.5.4. SWOT Analysis
- 12.1.6 Emery Oleochemicals
- 12.1.6.1. Company Overview
- 12.1.6.2. Products
- 12.1.6.3. Company Financials
- 12.1.6.4. SWOT Analysis
- 12.1.7 BASF SE
- 12.1.7.1. Company Overview
- 12.1.7.2. Products
- 12.1.7.3. Company Financials
- 12.1.7.4. SWOT Analysis
- 12.1.8 China Sunsine Chemical Holdings Limited
- 12.1.8.1. Company Overview
- 12.1.8.2. Products
- 12.1.8.3. Company Financials
- 12.1.8.4. SWOT Analysis
- 12.1.9 Thomas Swan & Co Ltd*List Not Exhaustive
- 12.1.9.1. Company Overview
- 12.1.9.2. Products
- 12.1.9.3. Company Financials
- 12.1.9.4. SWOT Analysis
- 12.1.10 Eastman Chemical Company
- 12.1.10.1. Company Overview
- 12.1.10.2. Products
- 12.1.10.3. Company Financials
- 12.1.10.4. SWOT Analysis
- 12.1.11 Behn Meyer
- 12.1.11.1. Company Overview
- 12.1.11.2. Products
- 12.1.11.3. Company Financials
- 12.1.11.4. SWOT Analysis
- 12.1.12 Rhein Chemie (Lanxess)
- 12.1.12.1. Company Overview
- 12.1.12.2. Products
- 12.1.12.3. Company Financials
- 12.1.12.4. SWOT Analysis
- 12.1.13 China Petrochemical Corporation (SINOPEC)
- 12.1.13.1. Company Overview
- 12.1.13.2. Products
- 12.1.13.3. Company Financials
- 12.1.13.4. SWOT Analysis
- 12.1.1 Sumitomo Chemical Co Ltd
- 12.2. Market Entropy
- 12.2.1 Company's Key Areas Served
- 12.2.2 Recent Developments
- 12.3. Company Market Share Analysis 2025
- 12.3.1 Top 5 Companies Market Share Analysis
- 12.3.2 Top 3 Companies Market Share Analysis
- 12.4. List of Potential Customers
- 13. Research Methodology
List of Figures
- Figure 1: Global Rubber Additives Market Revenue Breakdown (Million, %) by Region 2025 & 2033
- Figure 2: Asia Pacific Rubber Additives Market Revenue (Million), by Type 2025 & 2033
- Figure 3: Asia Pacific Rubber Additives Market Revenue Share (%), by Type 2025 & 2033
- Figure 4: Asia Pacific Rubber Additives Market Revenue (Million), by Application 2025 & 2033
- Figure 5: Asia Pacific Rubber Additives Market Revenue Share (%), by Application 2025 & 2033
- Figure 6: Asia Pacific Rubber Additives Market Revenue (Million), by Fillers 2025 & 2033
- Figure 7: Asia Pacific Rubber Additives Market Revenue Share (%), by Fillers 2025 & 2033
- Figure 8: Asia Pacific Rubber Additives Market Revenue (Million), by Country 2025 & 2033
- Figure 9: Asia Pacific Rubber Additives Market Revenue Share (%), by Country 2025 & 2033
- Figure 10: North America Rubber Additives Market Revenue (Million), by Type 2025 & 2033
- Figure 11: North America Rubber Additives Market Revenue Share (%), by Type 2025 & 2033
- Figure 12: North America Rubber Additives Market Revenue (Million), by Application 2025 & 2033
- Figure 13: North America Rubber Additives Market Revenue Share (%), by Application 2025 & 2033
- Figure 14: North America Rubber Additives Market Revenue (Million), by Fillers 2025 & 2033
- Figure 15: North America Rubber Additives Market Revenue Share (%), by Fillers 2025 & 2033
- Figure 16: North America Rubber Additives Market Revenue (Million), by Country 2025 & 2033
- Figure 17: North America Rubber Additives Market Revenue Share (%), by Country 2025 & 2033
- Figure 18: Europe Rubber Additives Market Revenue (Million), by Type 2025 & 2033
- Figure 19: Europe Rubber Additives Market Revenue Share (%), by Type 2025 & 2033
- Figure 20: Europe Rubber Additives Market Revenue (Million), by Application 2025 & 2033
- Figure 21: Europe Rubber Additives Market Revenue Share (%), by Application 2025 & 2033
- Figure 22: Europe Rubber Additives Market Revenue (Million), by Fillers 2025 & 2033
- Figure 23: Europe Rubber Additives Market Revenue Share (%), by Fillers 2025 & 2033
- Figure 24: Europe Rubber Additives Market Revenue (Million), by Country 2025 & 2033
- Figure 25: Europe Rubber Additives Market Revenue Share (%), by Country 2025 & 2033
- Figure 26: South America Rubber Additives Market Revenue (Million), by Type 2025 & 2033
- Figure 27: South America Rubber Additives Market Revenue Share (%), by Type 2025 & 2033
- Figure 28: South America Rubber Additives Market Revenue (Million), by Application 2025 & 2033
- Figure 29: South America Rubber Additives Market Revenue Share (%), by Application 2025 & 2033
- Figure 30: South America Rubber Additives Market Revenue (Million), by Fillers 2025 & 2033
- Figure 31: South America Rubber Additives Market Revenue Share (%), by Fillers 2025 & 2033
- Figure 32: South America Rubber Additives Market Revenue (Million), by Country 2025 & 2033
- Figure 33: South America Rubber Additives Market Revenue Share (%), by Country 2025 & 2033
- Figure 34: Middle East and Africa Rubber Additives Market Revenue (Million), by Type 2025 & 2033
- Figure 35: Middle East and Africa Rubber Additives Market Revenue Share (%), by Type 2025 & 2033
- Figure 36: Middle East and Africa Rubber Additives Market Revenue (Million), by Application 2025 & 2033
- Figure 37: Middle East and Africa Rubber Additives Market Revenue Share (%), by Application 2025 & 2033
- Figure 38: Middle East and Africa Rubber Additives Market Revenue (Million), by Fillers 2025 & 2033
- Figure 39: Middle East and Africa Rubber Additives Market Revenue Share (%), by Fillers 2025 & 2033
- Figure 40: Middle East and Africa Rubber Additives Market Revenue (Million), by Country 2025 & 2033
- Figure 41: Middle East and Africa Rubber Additives Market Revenue Share (%), by Country 2025 & 2033
List of Tables
- Table 1: Global Rubber Additives Market Revenue Million Forecast, by Type 2020 & 2033
- Table 2: Global Rubber Additives Market Revenue Million Forecast, by Application 2020 & 2033
- Table 3: Global Rubber Additives Market Revenue Million Forecast, by Fillers 2020 & 2033
- Table 4: Global Rubber Additives Market Revenue Million Forecast, by Region 2020 & 2033
- Table 5: Global Rubber Additives Market Revenue Million Forecast, by Type 2020 & 2033
- Table 6: Global Rubber Additives Market Revenue Million Forecast, by Application 2020 & 2033
- Table 7: Global Rubber Additives Market Revenue Million Forecast, by Fillers 2020 & 2033
- Table 8: Global Rubber Additives Market Revenue Million Forecast, by Country 2020 & 2033
- Table 9: China Rubber Additives Market Revenue (Million) Forecast, by Application 2020 & 2033
- Table 10: India Rubber Additives Market Revenue (Million) Forecast, by Application 2020 & 2033
- Table 11: Japan Rubber Additives Market Revenue (Million) Forecast, by Application 2020 & 2033
- Table 12: South Korea Rubber Additives Market Revenue (Million) Forecast, by Application 2020 & 2033
- Table 13: Rest of Asia Pacific Rubber Additives Market Revenue (Million) Forecast, by Application 2020 & 2033
- Table 14: Global Rubber Additives Market Revenue Million Forecast, by Type 2020 & 2033
- Table 15: Global Rubber Additives Market Revenue Million Forecast, by Application 2020 & 2033
- Table 16: Global Rubber Additives Market Revenue Million Forecast, by Fillers 2020 & 2033
- Table 17: Global Rubber Additives Market Revenue Million Forecast, by Country 2020 & 2033
- Table 18: United States Rubber Additives Market Revenue (Million) Forecast, by Application 2020 & 2033
- Table 19: Canada Rubber Additives Market Revenue (Million) Forecast, by Application 2020 & 2033
- Table 20: Mexico Rubber Additives Market Revenue (Million) Forecast, by Application 2020 & 2033
- Table 21: Global Rubber Additives Market Revenue Million Forecast, by Type 2020 & 2033
- Table 22: Global Rubber Additives Market Revenue Million Forecast, by Application 2020 & 2033
- Table 23: Global Rubber Additives Market Revenue Million Forecast, by Fillers 2020 & 2033
- Table 24: Global Rubber Additives Market Revenue Million Forecast, by Country 2020 & 2033
- Table 25: Germany Rubber Additives Market Revenue (Million) Forecast, by Application 2020 & 2033
- Table 26: United Kingdom Rubber Additives Market Revenue (Million) Forecast, by Application 2020 & 2033
- Table 27: France Rubber Additives Market Revenue (Million) Forecast, by Application 2020 & 2033
- Table 28: Italy Rubber Additives Market Revenue (Million) Forecast, by Application 2020 & 2033
- Table 29: Rest of Europe Rubber Additives Market Revenue (Million) Forecast, by Application 2020 & 2033
- Table 30: Global Rubber Additives Market Revenue Million Forecast, by Type 2020 & 2033
- Table 31: Global Rubber Additives Market Revenue Million Forecast, by Application 2020 & 2033
- Table 32: Global Rubber Additives Market Revenue Million Forecast, by Fillers 2020 & 2033
- Table 33: Global Rubber Additives Market Revenue Million Forecast, by Country 2020 & 2033
- Table 34: Brazil Rubber Additives Market Revenue (Million) Forecast, by Application 2020 & 2033
- Table 35: Argentina Rubber Additives Market Revenue (Million) Forecast, by Application 2020 & 2033
- Table 36: Rest of South America Rubber Additives Market Revenue (Million) Forecast, by Application 2020 & 2033
- Table 37: Global Rubber Additives Market Revenue Million Forecast, by Type 2020 & 2033
- Table 38: Global Rubber Additives Market Revenue Million Forecast, by Application 2020 & 2033
- Table 39: Global Rubber Additives Market Revenue Million Forecast, by Fillers 2020 & 2033
- Table 40: Global Rubber Additives Market Revenue Million Forecast, by Country 2020 & 2033
- Table 41: Saudi Arabia Rubber Additives Market Revenue (Million) Forecast, by Application 2020 & 2033
- Table 42: South Africa Rubber Additives Market Revenue (Million) Forecast, by Application 2020 & 2033
- Table 43: Rest of Middle East and Africa Rubber Additives Market Revenue (Million) Forecast, by Application 2020 & 2033
Frequently Asked Questions
1. What is the projected Compound Annual Growth Rate (CAGR) of the Rubber Additives Market?
The projected CAGR is approximately 4.32%.
2. Which companies are prominent players in the Rubber Additives Market?
Key companies in the market include Sumitomo Chemical Co Ltd, PUKHRAJ ZINCOLET, Kemai Chemical Co Ltd, NOCIL LIMITED, MLPC International (Arkema Group), Emery Oleochemicals, BASF SE, China Sunsine Chemical Holdings Limited, Thomas Swan & Co Ltd*List Not Exhaustive, Eastman Chemical Company, Behn Meyer, Rhein Chemie (Lanxess), China Petrochemical Corporation (SINOPEC).
3. What are the main segments of the Rubber Additives Market?
The market segments include Type, Application, Fillers.
4. Can you provide details about the market size?
The market size is estimated to be USD 5.87 Million as of 2022.
5. What are some drivers contributing to market growth?
Growth in the Tire and Rubber Industry; Growing Demand from the Non-Tire Segment in the Construction Industry; Other Drivers.
6. What are the notable trends driving market growth?
Tire Segment to Dominate the Market.
7. Are there any restraints impacting market growth?
Environmental Constraints Pertaining to Rubber Chemicals; Other Restraints.
8. Can you provide examples of recent developments in the market?
In February 2023, The Yokohama Rubber Co., Ltd. (YRC) announced details of its 2023 expansion program following the completion of its ongoing medium-term business plan Under Yokohama Transformation 2023 (YX2023). The project includes an expansion of passenger car tire production capacity in India, increasing the Group's production by 60% to 4.5 million units per year.
9. What pricing options are available for accessing the report?
Pricing options include single-user, multi-user, and enterprise licenses priced at USD 4750, USD 5250, and USD 8750 respectively.
10. Is the market size provided in terms of value or volume?
The market size is provided in terms of value, measured in Million.
11. Are there any specific market keywords associated with the report?
Yes, the market keyword associated with the report is "Rubber Additives Market," which aids in identifying and referencing the specific market segment covered.
12. How do I determine which pricing option suits my needs best?
The pricing options vary based on user requirements and access needs. Individual users may opt for single-user licenses, while businesses requiring broader access may choose multi-user or enterprise licenses for cost-effective access to the report.
13. Are there any additional resources or data provided in the Rubber Additives Market report?
While the report offers comprehensive insights, it's advisable to review the specific contents or supplementary materials provided to ascertain if additional resources or data are available.
14. How can I stay updated on further developments or reports in the Rubber Additives Market?
To stay informed about further developments, trends, and reports in the Rubber Additives Market, consider subscribing to industry newsletters, following relevant companies and organizations, or regularly checking reputable industry news sources and publications.
Methodology
Step 1 - Identification of Relevant Samples Size from Population Database


Step 2 - Approaches for Defining Global Market Size (Value, Volume* & Price*)

Note*: In applicable scenarios
Step 3 - Data Sources
Primary Research
- Web Analytics
- Survey Reports
- Research Institute
- Latest Research Reports
- Opinion Leaders
Secondary Research
- Annual Reports
- White Paper
- Latest Press Release
- Industry Association
- Paid Database
- Investor Presentations

Step 4 - Data Triangulation
Involves using different sources of information in order to increase the validity of a study
These sources are likely to be stakeholders in a program - participants, other researchers, program staff, other community members, and so on.
Then we put all data in single framework & apply various statistical tools to find out the dynamic on the market.
During the analysis stage, feedback from the stakeholder groups would be compared to determine areas of agreement as well as areas of divergence