

Key Insights
The global Rubber Process Oil market is projected for consistent growth, anticipating a market size of 3.73 million by 2025. With a Compound Annual Growth Rate (CAGR) of 2.93%, the industry is set for significant value appreciation. This expansion is primarily driven by robust demand from the automotive sector, particularly in tire manufacturing. The growing global vehicle parc and advancements in tire technology, emphasizing durability and performance, directly increase rubber process oil consumption. Expanding applications in consumer goods, industrial components, and footwear further contribute to this upward trend. The market offers a diverse product range, including Aromatic, Paraffinic, and Naphthenic oils, each tailored to specific performance needs and industries. Key players are actively investing in R&D for product innovation and market expansion.
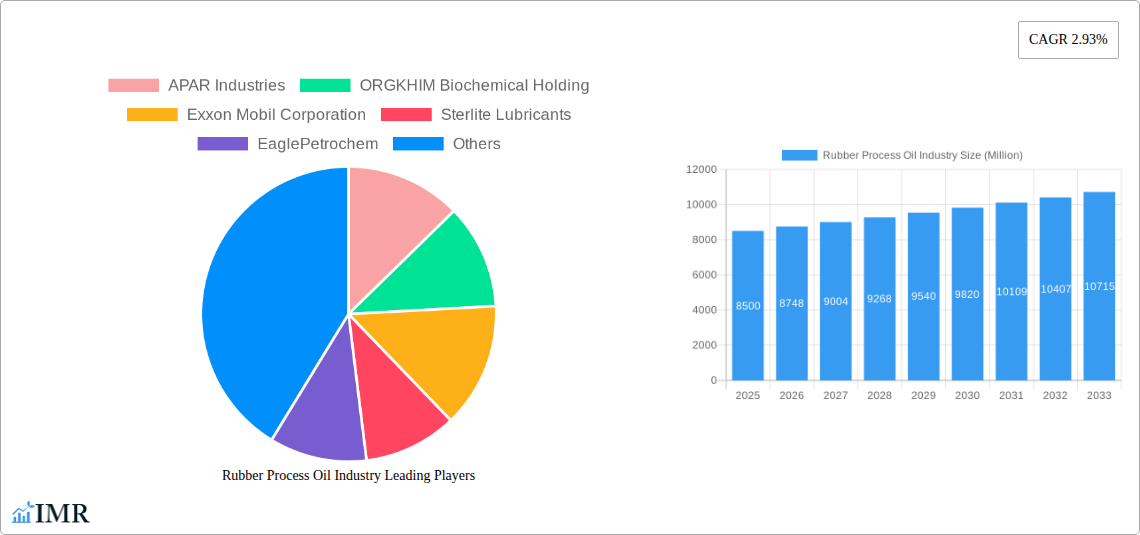
Rubber Process Oil Industry Market Size (In Million)
Market dynamics are influenced by trends such as the growing demand for sustainable and eco-friendly rubber processing chemicals, prompting the development of bio-based or recycled alternatives. Innovations in refining technologies are also enhancing production quality and efficiency. However, challenges include fluctuating raw material prices tied to crude oil derivatives, potentially impacting profit margins. Stringent environmental regulations on certain oil types, especially aromatics, may also present hurdles. Geographically, the Asia Pacific region is expected to dominate, driven by its substantial manufacturing base and burgeoning automotive industry. North America and Europe remain significant markets, supported by established automotive sectors and a focus on high-performance rubber products.
Rubber Process Oil Industry Company Market Share
Rubber Process Oil Industry: Global Market Analysis & Forecast 2019-2033 (USD XX Million)
This comprehensive report provides an in-depth analysis of the global Rubber Process Oil Market, a critical component in the rubber manufacturing industry. Covering the period from 2019 to 2033, with a base year of 2025 and a forecast period of 2025-2033, this study delves into market dynamics, growth trends, regional dominance, product landscape, key drivers, barriers, emerging opportunities, growth accelerators, and the competitive landscape.
The report offers granular insights into market segmentation by Product Type (Aromatic, Paraffinic, Naphthenic) and Application (Tire and Automobile Components, Footwear, Consumer Goods, Other Applications). With a focus on quantitative data and qualitative analysis, this report is an indispensable resource for stakeholders, including manufacturers, suppliers, investors, and industry analysts seeking to navigate this dynamic market. All values are presented in Million units for clarity.
Rubber Process Oil Industry Market Dynamics & Structure
The Rubber Process Oil Market exhibits a moderately concentrated structure, with key players vying for market share through product innovation, strategic partnerships, and geographical expansion. Technological advancements in refining processes and the development of bio-based alternatives are key innovation drivers, aimed at enhancing performance and sustainability. Stringent environmental regulations concerning volatile organic compounds (VOCs) and hazardous substances are shaping the regulatory frameworks, prompting manufacturers to invest in cleaner production technologies. Competitive product substitutes, though limited, include plasticizers and alternative processing aids, necessitating continuous product differentiation. End-user demographics, particularly the automotive sector's demand for high-performance tires and components, significantly influence market growth. Mergers and acquisitions (M&A) remain a strategic tool for market consolidation and capability enhancement, with recent deal volumes indicating a trend towards vertical integration and regional expansion.
- Market Concentration: Moderate, with key global players holding significant market shares.
- Technological Innovation Drivers: Advanced refining techniques, development of bio-based process oils, enhanced product performance for specific rubber applications.
- Regulatory Frameworks: Increasing focus on environmental compliance, emission standards, and chemical safety directives.
- Competitive Product Substitutes: Limited, but includes certain plasticizers and specialized processing aids.
- End-User Demographics: Strong reliance on the automotive and tire industry; growing demand from footwear and industrial rubber goods sectors.
- M&A Trends: Strategic acquisitions for market access, technology acquisition, and portfolio diversification. Notable M&A activity has been observed in the recent past, impacting market share dynamics.
Rubber Process Oil Industry Growth Trends & Insights
The Rubber Process Oil Market is poised for robust growth, driven by increasing demand from its primary end-use industries. The market size evolution is characterized by a steady upward trajectory, fueled by the burgeoning automotive sector globally, particularly in emerging economies. Adoption rates of refined rubber process oils are escalating as manufacturers prioritize enhanced product performance, durability, and safety in tires and other rubber components. Technological disruptions are less about entirely new oil types and more about evolutionary improvements in existing product lines, such as increased aromaticity for better compatibility or improved safety profiles for low-PAH (Polycyclic Aromatic Hydrocarbons) variants.
Consumer behavior shifts are indirectly influencing the market through evolving automotive preferences, such as the demand for fuel-efficient tires and specialized components for electric vehicles. These shifts necessitate rubber compounds with specific properties, directly impacting the type and volume of process oils required. The compound annual growth rate (CAGR) is projected to be substantial throughout the forecast period. Market penetration of specialized rubber process oils is increasing as industries recognize their contribution to optimizing manufacturing processes and achieving desired end-product characteristics. The historical period (2019-2024) laid the groundwork for current growth, with steady demand from established applications. The base year (2025) reflects current market conditions, and the estimated year (2025) is aligned with the base year for immediate analysis. The forecast period (2025-2033) anticipates sustained expansion, influenced by global economic recovery, infrastructure development, and evolving automotive manufacturing trends.
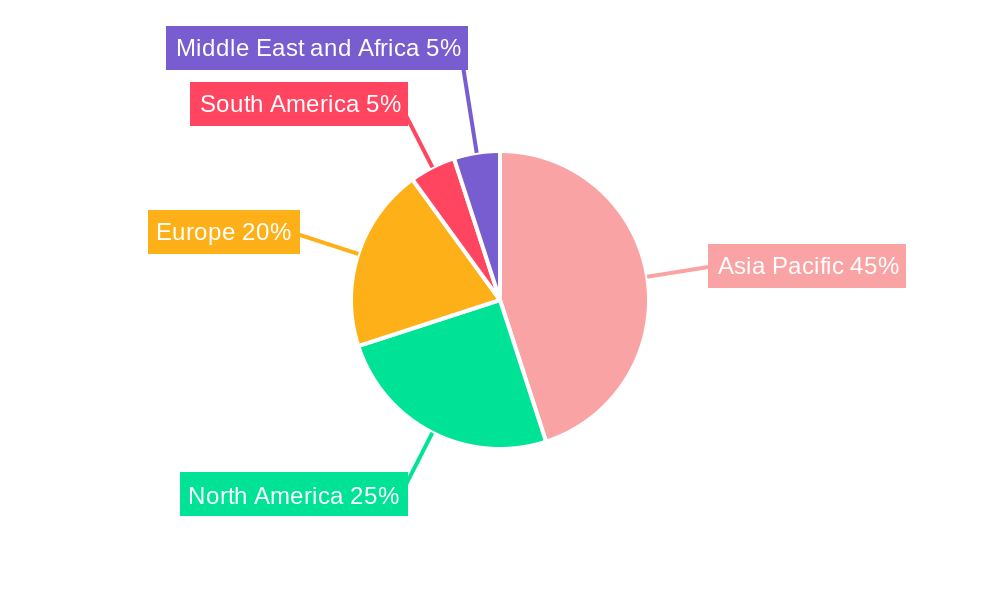
Dominant Regions, Countries, or Segments in Rubber Process Oil Industry
The Tire and Automobile Components segment stands as the dominant force driving growth in the global Rubber Process Oil Market. This dominance is primarily attributed to the sheer volume and continuous demand from the automotive industry worldwide. The increasing global vehicle production, coupled with the replacement tire market, directly translates into a substantial and consistent need for rubber process oils.
Key Drivers of Dominance in Tire and Automobile Components:
- Global Automotive Production: A direct correlation exists between the number of vehicles manufactured globally and the demand for tires and other rubber auto parts, which are heavily reliant on rubber process oils. Production of approximately XX million units in 2025 is a key indicator.
- Replacement Tire Market: The aftermarket for tires, driven by regular wear and tear and vehicle maintenance, provides a steady and significant revenue stream for rubber product manufacturers, and consequently, for process oil suppliers.
- Technological Advancements in Tires: The development of high-performance tires, fuel-efficient tires, and tires for electric vehicles necessitates specialized rubber formulations, requiring specific types of rubber process oils to achieve desired properties like grip, wear resistance, and reduced rolling resistance.
- Stringent Safety and Performance Standards: Automotive manufacturers and regulatory bodies impose rigorous safety and performance standards for tires and other components, pushing for the use of high-quality rubber process oils that contribute to these attributes.
Regional Dominance:
While the application segment is a key driver, regional dynamics also play a crucial role. Asia Pacific is identified as the leading region, fueled by its expansive manufacturing base, particularly in China and India, which are major hubs for automotive production and tire manufacturing. The region’s robust economic growth, increasing disposable incomes, and expanding infrastructure development projects contribute to higher demand for vehicles and, consequently, rubber products. Countries within this region demonstrate significant market share due to their substantial industrial output and growing domestic consumption.
Rubber Process Oil Industry Product Landscape
The Rubber Process Oil Industry is characterized by a diverse product landscape catering to the nuanced requirements of various rubber applications. Manufacturers are continuously innovating to offer oils with optimized performance metrics. Aromatic process oils are widely used for their excellent solvency and compatibility with a broad range of elastomers, enhancing plasticity and reducing viscosity during processing. Paraffinic process oils are favored for their lower volatility and good staining resistance, making them suitable for light-colored rubber goods. Naphthenic process oils offer a balance of solvency and low-temperature properties. Innovations are focused on developing low-PAH variants to meet stringent environmental regulations and produce oils with enhanced safety profiles for sensitive applications.
Key Drivers, Barriers & Challenges in Rubber Process Oil Industry
The Rubber Process Oil Industry is propelled by several key drivers, including the sustained growth of the global automotive sector, particularly in emerging economies, leading to increased demand for tires and automotive components. Growing urbanization and infrastructure development further boost the need for various rubber products in construction and industrial applications. Technological advancements in rubber compounding and manufacturing processes also drive the demand for specialized process oils that enhance efficiency and product performance.
Conversely, the industry faces significant barriers and challenges. Volatility in crude oil prices directly impacts the cost of raw materials, affecting profit margins. Increasing environmental regulations and the demand for sustainable alternatives pose a challenge, pushing for the development and adoption of bio-based or low-emission process oils. Supply chain disruptions, geopolitical instability, and fluctuating global economic conditions can hinder production and distribution. Intense competition among established players and the emergence of new market entrants also exert pressure on pricing and market share. For instance, the anticipated rise in crude oil prices by XX% in the coming years presents a significant cost challenge.
Emerging Opportunities in Rubber Process Oil Industry
Emerging opportunities in the Rubber Process Oil Industry lie in the growing demand for eco-friendly and sustainable alternatives. The development and widespread adoption of bio-based rubber process oils derived from renewable resources present a significant untapped market. Furthermore, the increasing focus on electric vehicles (EVs) is creating a demand for specialized process oils that can enhance the performance and durability of EV components and tires, such as improved grip and reduced noise levels. The expanding industrial rubber goods sector in developing economies, including conveyor belts, hoses, and seals, offers substantial growth potential. Innovations in additive technologies to enhance the properties of rubber process oils for specific niche applications also represent a promising avenue for market expansion.
Growth Accelerators in the Rubber Process Oil Industry Industry
Several factors are accelerating growth in the Rubber Process Oil Industry. The continuous innovation in tire technology, driven by the pursuit of fuel efficiency, safety, and longevity, directly fuels the demand for advanced rubber process oils. Strategic partnerships and collaborations between rubber manufacturers and process oil suppliers are crucial for co-developing tailored solutions and expanding market reach. The increasing adoption of automation and advanced manufacturing techniques in the rubber industry necessitates process oils that are compatible with these modern processes, thereby driving their demand. Furthermore, market expansion strategies, particularly focusing on high-growth regions in Asia Pacific and Latin America, are key accelerators for sustained industry growth.
Key Players Shaping the Rubber Process Oil Industry Market
- APAR Industries
- ORGKHIM Biochemical Holding
- Exxon Mobil Corporation
- Sterlite Lubricants
- EaglePetrochem
- Repsol
- LODHA Petro
- Chevron Corporation
- Witmans Industries Pvt Ltd
- TotalEnergies
- HF Sinclair Corporation
- Panama Petrochem Ltd
- CPC Corporation
Notable Milestones in Rubber Process Oil Industry Sector
- 2019: Launch of low-PAH aromatic process oils by several leading manufacturers, responding to increasing environmental regulations.
- 2020: Significant increase in demand for rubber process oils from the automotive sector driven by post-pandemic recovery and renewed consumer spending.
- 2021: Several M&A activities reported, focusing on market consolidation and vertical integration within the petrochemical and rubber chemicals sector.
- 2022: Growing research and development in bio-based rubber process oils gains traction as sustainability becomes a key industry focus.
- 2023: Introduction of new grades of paraffinic and naphthenic process oils offering enhanced low-temperature performance for specialized applications.
- 2024: Increased adoption of digital technologies for supply chain management and process optimization within the rubber process oil industry.
In-Depth Rubber Process Oil Industry Market Outlook
The Rubber Process Oil Industry is set for continued expansion, driven by the indispensable role of process oils in rubber manufacturing. Future growth will be significantly influenced by advancements in sustainable processing and the demand for high-performance materials in the automotive sector, especially with the rise of electric mobility. Strategic investments in research and development, a focus on circular economy principles, and the exploration of new geographical markets will be critical for sustained success. The industry's ability to adapt to evolving regulatory landscapes and consumer preferences for eco-friendly products will shape its long-term trajectory, presenting lucrative opportunities for innovative and agile players.
Rubber Process Oil Industry Segmentation
-
1. Product Type
- 1.1. Aromatic
- 1.2. Paraffinic
- 1.3. Naphthenic
-
2. Application
- 2.1. Tire and Automobile Components
- 2.2. Footwear
- 2.3. Consumer Goods
- 2.4. Other Applications
Rubber Process Oil Industry Segmentation By Geography
-
1. Asia Pacific
- 1.1. China
- 1.2. India
- 1.3. Japan
- 1.4. South Korea
- 1.5. Rest of Asia Pacific
-
2. North America
- 2.1. United States
- 2.2. Canada
- 2.3. Mexico
-
3. Europe
- 3.1. Germany
- 3.2. United Kingdom
- 3.3. France
- 3.4. Italy
- 3.5. Rest of Europe
-
4. South America
- 4.1. Brazil
- 4.2. Argentina
- 4.3. Rest of South America
-
5. Middle East and Africa
- 5.1. Saudi Arabia
- 5.2. South Africa
- 5.3. Rest of Middle East and Africa
Rubber Process Oil Industry Regional Market Share
Geographic Coverage of Rubber Process Oil Industry
Rubber Process Oil Industry REPORT HIGHLIGHTS
| Aspects | Details |
|---|---|
| Study Period | 2020-2034 |
| Base Year | 2025 |
| Estimated Year | 2026 |
| Forecast Period | 2026-2034 |
| Historical Period | 2020-2025 |
| Growth Rate | CAGR of 2.93% from 2020-2034 |
| Segmentation |
|
Table of Contents
- 1. Introduction
- 1.1. Research Scope
- 1.2. Market Segmentation
- 1.3. Research Objective
- 1.4. Definitions and Assumptions
- 2. Executive Summary
- 2.1. Market Snapshot
- 3. Market Dynamics
- 3.1. Market Drivers
- 3.2. Market Restrains
- 3.3. Market Trends
- 3.4. Market Opportunities
- 4. Market Factor Analysis
- 4.1. Porters Five Forces
- 4.1.1. Bargaining Power of Suppliers
- 4.1.2. Bargaining Power of Buyers
- 4.1.3. Threat of New Entrants
- 4.1.4. Threat of Substitutes
- 4.1.5. Competitive Rivalry
- 4.2. PESTEL analysis
- 4.3. BCG Analysis
- 4.3.1. Stars (High Growth, High Market Share)
- 4.3.2. Cash Cows (Low Growth, High Market Share)
- 4.3.3. Question Mark (High Growth, Low Market Share)
- 4.3.4. Dogs (Low Growth, Low Market Share)
- 4.4. Ansoff Matrix Analysis
- 4.5. Supply Chain Analysis
- 4.6. Regulatory Landscape
- 4.7. Current Market Potential and Opportunity Assessment (TAM–SAM–SOM Framework)
- 4.8. IMR Analyst Note
- 4.1. Porters Five Forces
- 5. Market Analysis, Insights and Forecast 2021-2033
- 5.1. Market Analysis, Insights and Forecast - by Product Type
- 5.1.1. Aromatic
- 5.1.2. Paraffinic
- 5.1.3. Naphthenic
- 5.2. Market Analysis, Insights and Forecast - by Application
- 5.2.1. Tire and Automobile Components
- 5.2.2. Footwear
- 5.2.3. Consumer Goods
- 5.2.4. Other Applications
- 5.3. Market Analysis, Insights and Forecast - by Region
- 5.3.1. Asia Pacific
- 5.3.2. North America
- 5.3.3. Europe
- 5.3.4. South America
- 5.3.5. Middle East and Africa
- 5.1. Market Analysis, Insights and Forecast - by Product Type
- 6. Global Rubber Process Oil Industry Analysis, Insights and Forecast, 2021-2033
- 6.1. Market Analysis, Insights and Forecast - by Product Type
- 6.1.1. Aromatic
- 6.1.2. Paraffinic
- 6.1.3. Naphthenic
- 6.2. Market Analysis, Insights and Forecast - by Application
- 6.2.1. Tire and Automobile Components
- 6.2.2. Footwear
- 6.2.3. Consumer Goods
- 6.2.4. Other Applications
- 6.1. Market Analysis, Insights and Forecast - by Product Type
- 7. Asia Pacific Rubber Process Oil Industry Analysis, Insights and Forecast, 2020-2032
- 7.1. Market Analysis, Insights and Forecast - by Product Type
- 7.1.1. Aromatic
- 7.1.2. Paraffinic
- 7.1.3. Naphthenic
- 7.2. Market Analysis, Insights and Forecast - by Application
- 7.2.1. Tire and Automobile Components
- 7.2.2. Footwear
- 7.2.3. Consumer Goods
- 7.2.4. Other Applications
- 7.1. Market Analysis, Insights and Forecast - by Product Type
- 8. North America Rubber Process Oil Industry Analysis, Insights and Forecast, 2020-2032
- 8.1. Market Analysis, Insights and Forecast - by Product Type
- 8.1.1. Aromatic
- 8.1.2. Paraffinic
- 8.1.3. Naphthenic
- 8.2. Market Analysis, Insights and Forecast - by Application
- 8.2.1. Tire and Automobile Components
- 8.2.2. Footwear
- 8.2.3. Consumer Goods
- 8.2.4. Other Applications
- 8.1. Market Analysis, Insights and Forecast - by Product Type
- 9. Europe Rubber Process Oil Industry Analysis, Insights and Forecast, 2020-2032
- 9.1. Market Analysis, Insights and Forecast - by Product Type
- 9.1.1. Aromatic
- 9.1.2. Paraffinic
- 9.1.3. Naphthenic
- 9.2. Market Analysis, Insights and Forecast - by Application
- 9.2.1. Tire and Automobile Components
- 9.2.2. Footwear
- 9.2.3. Consumer Goods
- 9.2.4. Other Applications
- 9.1. Market Analysis, Insights and Forecast - by Product Type
- 10. South America Rubber Process Oil Industry Analysis, Insights and Forecast, 2020-2032
- 10.1. Market Analysis, Insights and Forecast - by Product Type
- 10.1.1. Aromatic
- 10.1.2. Paraffinic
- 10.1.3. Naphthenic
- 10.2. Market Analysis, Insights and Forecast - by Application
- 10.2.1. Tire and Automobile Components
- 10.2.2. Footwear
- 10.2.3. Consumer Goods
- 10.2.4. Other Applications
- 10.1. Market Analysis, Insights and Forecast - by Product Type
- 11. Middle East and Africa Rubber Process Oil Industry Analysis, Insights and Forecast, 2020-2032
- 11.1. Market Analysis, Insights and Forecast - by Product Type
- 11.1.1. Aromatic
- 11.1.2. Paraffinic
- 11.1.3. Naphthenic
- 11.2. Market Analysis, Insights and Forecast - by Application
- 11.2.1. Tire and Automobile Components
- 11.2.2. Footwear
- 11.2.3. Consumer Goods
- 11.2.4. Other Applications
- 11.1. Market Analysis, Insights and Forecast - by Product Type
- 12. Competitive Analysis
- 12.1. Company Profiles
- 12.1.1 APAR Industries
- 12.1.1.1. Company Overview
- 12.1.1.2. Products
- 12.1.1.3. Company Financials
- 12.1.1.4. SWOT Analysis
- 12.1.2 ORGKHIM Biochemical Holding
- 12.1.2.1. Company Overview
- 12.1.2.2. Products
- 12.1.2.3. Company Financials
- 12.1.2.4. SWOT Analysis
- 12.1.3 Exxon Mobil Corporation
- 12.1.3.1. Company Overview
- 12.1.3.2. Products
- 12.1.3.3. Company Financials
- 12.1.3.4. SWOT Analysis
- 12.1.4 Sterlite Lubricants
- 12.1.4.1. Company Overview
- 12.1.4.2. Products
- 12.1.4.3. Company Financials
- 12.1.4.4. SWOT Analysis
- 12.1.5 EaglePetrochem
- 12.1.5.1. Company Overview
- 12.1.5.2. Products
- 12.1.5.3. Company Financials
- 12.1.5.4. SWOT Analysis
- 12.1.6 Repsol
- 12.1.6.1. Company Overview
- 12.1.6.2. Products
- 12.1.6.3. Company Financials
- 12.1.6.4. SWOT Analysis
- 12.1.7 LODHA Petro
- 12.1.7.1. Company Overview
- 12.1.7.2. Products
- 12.1.7.3. Company Financials
- 12.1.7.4. SWOT Analysis
- 12.1.8 Chevron Corporation
- 12.1.8.1. Company Overview
- 12.1.8.2. Products
- 12.1.8.3. Company Financials
- 12.1.8.4. SWOT Analysis
- 12.1.9 Witmans Industries Pvt Ltd*List Not Exhaustive
- 12.1.9.1. Company Overview
- 12.1.9.2. Products
- 12.1.9.3. Company Financials
- 12.1.9.4. SWOT Analysis
- 12.1.10 TotalEnergies
- 12.1.10.1. Company Overview
- 12.1.10.2. Products
- 12.1.10.3. Company Financials
- 12.1.10.4. SWOT Analysis
- 12.1.11 HF Sinclair Corporation
- 12.1.11.1. Company Overview
- 12.1.11.2. Products
- 12.1.11.3. Company Financials
- 12.1.11.4. SWOT Analysis
- 12.1.12 Panama Petrochem Ltd
- 12.1.12.1. Company Overview
- 12.1.12.2. Products
- 12.1.12.3. Company Financials
- 12.1.12.4. SWOT Analysis
- 12.1.13 CPC Corporation
- 12.1.13.1. Company Overview
- 12.1.13.2. Products
- 12.1.13.3. Company Financials
- 12.1.13.4. SWOT Analysis
- 12.1.1 APAR Industries
- 12.2. Market Entropy
- 12.2.1 Company's Key Areas Served
- 12.2.2 Recent Developments
- 12.3. Company Market Share Analysis 2025
- 12.3.1 Top 5 Companies Market Share Analysis
- 12.3.2 Top 3 Companies Market Share Analysis
- 12.4. List of Potential Customers
- 13. Research Methodology
List of Figures
- Figure 1: Global Rubber Process Oil Industry Revenue Breakdown (million, %) by Region 2025 & 2033
- Figure 2: Global Rubber Process Oil Industry Volume Breakdown (Million, %) by Region 2025 & 2033
- Figure 3: Asia Pacific Rubber Process Oil Industry Revenue (million), by Product Type 2025 & 2033
- Figure 4: Asia Pacific Rubber Process Oil Industry Volume (Million), by Product Type 2025 & 2033
- Figure 5: Asia Pacific Rubber Process Oil Industry Revenue Share (%), by Product Type 2025 & 2033
- Figure 6: Asia Pacific Rubber Process Oil Industry Volume Share (%), by Product Type 2025 & 2033
- Figure 7: Asia Pacific Rubber Process Oil Industry Revenue (million), by Application 2025 & 2033
- Figure 8: Asia Pacific Rubber Process Oil Industry Volume (Million), by Application 2025 & 2033
- Figure 9: Asia Pacific Rubber Process Oil Industry Revenue Share (%), by Application 2025 & 2033
- Figure 10: Asia Pacific Rubber Process Oil Industry Volume Share (%), by Application 2025 & 2033
- Figure 11: Asia Pacific Rubber Process Oil Industry Revenue (million), by Country 2025 & 2033
- Figure 12: Asia Pacific Rubber Process Oil Industry Volume (Million), by Country 2025 & 2033
- Figure 13: Asia Pacific Rubber Process Oil Industry Revenue Share (%), by Country 2025 & 2033
- Figure 14: Asia Pacific Rubber Process Oil Industry Volume Share (%), by Country 2025 & 2033
- Figure 15: North America Rubber Process Oil Industry Revenue (million), by Product Type 2025 & 2033
- Figure 16: North America Rubber Process Oil Industry Volume (Million), by Product Type 2025 & 2033
- Figure 17: North America Rubber Process Oil Industry Revenue Share (%), by Product Type 2025 & 2033
- Figure 18: North America Rubber Process Oil Industry Volume Share (%), by Product Type 2025 & 2033
- Figure 19: North America Rubber Process Oil Industry Revenue (million), by Application 2025 & 2033
- Figure 20: North America Rubber Process Oil Industry Volume (Million), by Application 2025 & 2033
- Figure 21: North America Rubber Process Oil Industry Revenue Share (%), by Application 2025 & 2033
- Figure 22: North America Rubber Process Oil Industry Volume Share (%), by Application 2025 & 2033
- Figure 23: North America Rubber Process Oil Industry Revenue (million), by Country 2025 & 2033
- Figure 24: North America Rubber Process Oil Industry Volume (Million), by Country 2025 & 2033
- Figure 25: North America Rubber Process Oil Industry Revenue Share (%), by Country 2025 & 2033
- Figure 26: North America Rubber Process Oil Industry Volume Share (%), by Country 2025 & 2033
- Figure 27: Europe Rubber Process Oil Industry Revenue (million), by Product Type 2025 & 2033
- Figure 28: Europe Rubber Process Oil Industry Volume (Million), by Product Type 2025 & 2033
- Figure 29: Europe Rubber Process Oil Industry Revenue Share (%), by Product Type 2025 & 2033
- Figure 30: Europe Rubber Process Oil Industry Volume Share (%), by Product Type 2025 & 2033
- Figure 31: Europe Rubber Process Oil Industry Revenue (million), by Application 2025 & 2033
- Figure 32: Europe Rubber Process Oil Industry Volume (Million), by Application 2025 & 2033
- Figure 33: Europe Rubber Process Oil Industry Revenue Share (%), by Application 2025 & 2033
- Figure 34: Europe Rubber Process Oil Industry Volume Share (%), by Application 2025 & 2033
- Figure 35: Europe Rubber Process Oil Industry Revenue (million), by Country 2025 & 2033
- Figure 36: Europe Rubber Process Oil Industry Volume (Million), by Country 2025 & 2033
- Figure 37: Europe Rubber Process Oil Industry Revenue Share (%), by Country 2025 & 2033
- Figure 38: Europe Rubber Process Oil Industry Volume Share (%), by Country 2025 & 2033
- Figure 39: South America Rubber Process Oil Industry Revenue (million), by Product Type 2025 & 2033
- Figure 40: South America Rubber Process Oil Industry Volume (Million), by Product Type 2025 & 2033
- Figure 41: South America Rubber Process Oil Industry Revenue Share (%), by Product Type 2025 & 2033
- Figure 42: South America Rubber Process Oil Industry Volume Share (%), by Product Type 2025 & 2033
- Figure 43: South America Rubber Process Oil Industry Revenue (million), by Application 2025 & 2033
- Figure 44: South America Rubber Process Oil Industry Volume (Million), by Application 2025 & 2033
- Figure 45: South America Rubber Process Oil Industry Revenue Share (%), by Application 2025 & 2033
- Figure 46: South America Rubber Process Oil Industry Volume Share (%), by Application 2025 & 2033
- Figure 47: South America Rubber Process Oil Industry Revenue (million), by Country 2025 & 2033
- Figure 48: South America Rubber Process Oil Industry Volume (Million), by Country 2025 & 2033
- Figure 49: South America Rubber Process Oil Industry Revenue Share (%), by Country 2025 & 2033
- Figure 50: South America Rubber Process Oil Industry Volume Share (%), by Country 2025 & 2033
- Figure 51: Middle East and Africa Rubber Process Oil Industry Revenue (million), by Product Type 2025 & 2033
- Figure 52: Middle East and Africa Rubber Process Oil Industry Volume (Million), by Product Type 2025 & 2033
- Figure 53: Middle East and Africa Rubber Process Oil Industry Revenue Share (%), by Product Type 2025 & 2033
- Figure 54: Middle East and Africa Rubber Process Oil Industry Volume Share (%), by Product Type 2025 & 2033
- Figure 55: Middle East and Africa Rubber Process Oil Industry Revenue (million), by Application 2025 & 2033
- Figure 56: Middle East and Africa Rubber Process Oil Industry Volume (Million), by Application 2025 & 2033
- Figure 57: Middle East and Africa Rubber Process Oil Industry Revenue Share (%), by Application 2025 & 2033
- Figure 58: Middle East and Africa Rubber Process Oil Industry Volume Share (%), by Application 2025 & 2033
- Figure 59: Middle East and Africa Rubber Process Oil Industry Revenue (million), by Country 2025 & 2033
- Figure 60: Middle East and Africa Rubber Process Oil Industry Volume (Million), by Country 2025 & 2033
- Figure 61: Middle East and Africa Rubber Process Oil Industry Revenue Share (%), by Country 2025 & 2033
- Figure 62: Middle East and Africa Rubber Process Oil Industry Volume Share (%), by Country 2025 & 2033
List of Tables
- Table 1: Global Rubber Process Oil Industry Revenue million Forecast, by Product Type 2020 & 2033
- Table 2: Global Rubber Process Oil Industry Volume Million Forecast, by Product Type 2020 & 2033
- Table 3: Global Rubber Process Oil Industry Revenue million Forecast, by Application 2020 & 2033
- Table 4: Global Rubber Process Oil Industry Volume Million Forecast, by Application 2020 & 2033
- Table 5: Global Rubber Process Oil Industry Revenue million Forecast, by Region 2020 & 2033
- Table 6: Global Rubber Process Oil Industry Volume Million Forecast, by Region 2020 & 2033
- Table 7: Global Rubber Process Oil Industry Revenue million Forecast, by Product Type 2020 & 2033
- Table 8: Global Rubber Process Oil Industry Volume Million Forecast, by Product Type 2020 & 2033
- Table 9: Global Rubber Process Oil Industry Revenue million Forecast, by Application 2020 & 2033
- Table 10: Global Rubber Process Oil Industry Volume Million Forecast, by Application 2020 & 2033
- Table 11: Global Rubber Process Oil Industry Revenue million Forecast, by Country 2020 & 2033
- Table 12: Global Rubber Process Oil Industry Volume Million Forecast, by Country 2020 & 2033
- Table 13: China Rubber Process Oil Industry Revenue (million) Forecast, by Application 2020 & 2033
- Table 14: China Rubber Process Oil Industry Volume (Million) Forecast, by Application 2020 & 2033
- Table 15: India Rubber Process Oil Industry Revenue (million) Forecast, by Application 2020 & 2033
- Table 16: India Rubber Process Oil Industry Volume (Million) Forecast, by Application 2020 & 2033
- Table 17: Japan Rubber Process Oil Industry Revenue (million) Forecast, by Application 2020 & 2033
- Table 18: Japan Rubber Process Oil Industry Volume (Million) Forecast, by Application 2020 & 2033
- Table 19: South Korea Rubber Process Oil Industry Revenue (million) Forecast, by Application 2020 & 2033
- Table 20: South Korea Rubber Process Oil Industry Volume (Million) Forecast, by Application 2020 & 2033
- Table 21: Rest of Asia Pacific Rubber Process Oil Industry Revenue (million) Forecast, by Application 2020 & 2033
- Table 22: Rest of Asia Pacific Rubber Process Oil Industry Volume (Million) Forecast, by Application 2020 & 2033
- Table 23: Global Rubber Process Oil Industry Revenue million Forecast, by Product Type 2020 & 2033
- Table 24: Global Rubber Process Oil Industry Volume Million Forecast, by Product Type 2020 & 2033
- Table 25: Global Rubber Process Oil Industry Revenue million Forecast, by Application 2020 & 2033
- Table 26: Global Rubber Process Oil Industry Volume Million Forecast, by Application 2020 & 2033
- Table 27: Global Rubber Process Oil Industry Revenue million Forecast, by Country 2020 & 2033
- Table 28: Global Rubber Process Oil Industry Volume Million Forecast, by Country 2020 & 2033
- Table 29: United States Rubber Process Oil Industry Revenue (million) Forecast, by Application 2020 & 2033
- Table 30: United States Rubber Process Oil Industry Volume (Million) Forecast, by Application 2020 & 2033
- Table 31: Canada Rubber Process Oil Industry Revenue (million) Forecast, by Application 2020 & 2033
- Table 32: Canada Rubber Process Oil Industry Volume (Million) Forecast, by Application 2020 & 2033
- Table 33: Mexico Rubber Process Oil Industry Revenue (million) Forecast, by Application 2020 & 2033
- Table 34: Mexico Rubber Process Oil Industry Volume (Million) Forecast, by Application 2020 & 2033
- Table 35: Global Rubber Process Oil Industry Revenue million Forecast, by Product Type 2020 & 2033
- Table 36: Global Rubber Process Oil Industry Volume Million Forecast, by Product Type 2020 & 2033
- Table 37: Global Rubber Process Oil Industry Revenue million Forecast, by Application 2020 & 2033
- Table 38: Global Rubber Process Oil Industry Volume Million Forecast, by Application 2020 & 2033
- Table 39: Global Rubber Process Oil Industry Revenue million Forecast, by Country 2020 & 2033
- Table 40: Global Rubber Process Oil Industry Volume Million Forecast, by Country 2020 & 2033
- Table 41: Germany Rubber Process Oil Industry Revenue (million) Forecast, by Application 2020 & 2033
- Table 42: Germany Rubber Process Oil Industry Volume (Million) Forecast, by Application 2020 & 2033
- Table 43: United Kingdom Rubber Process Oil Industry Revenue (million) Forecast, by Application 2020 & 2033
- Table 44: United Kingdom Rubber Process Oil Industry Volume (Million) Forecast, by Application 2020 & 2033
- Table 45: France Rubber Process Oil Industry Revenue (million) Forecast, by Application 2020 & 2033
- Table 46: France Rubber Process Oil Industry Volume (Million) Forecast, by Application 2020 & 2033
- Table 47: Italy Rubber Process Oil Industry Revenue (million) Forecast, by Application 2020 & 2033
- Table 48: Italy Rubber Process Oil Industry Volume (Million) Forecast, by Application 2020 & 2033
- Table 49: Rest of Europe Rubber Process Oil Industry Revenue (million) Forecast, by Application 2020 & 2033
- Table 50: Rest of Europe Rubber Process Oil Industry Volume (Million) Forecast, by Application 2020 & 2033
- Table 51: Global Rubber Process Oil Industry Revenue million Forecast, by Product Type 2020 & 2033
- Table 52: Global Rubber Process Oil Industry Volume Million Forecast, by Product Type 2020 & 2033
- Table 53: Global Rubber Process Oil Industry Revenue million Forecast, by Application 2020 & 2033
- Table 54: Global Rubber Process Oil Industry Volume Million Forecast, by Application 2020 & 2033
- Table 55: Global Rubber Process Oil Industry Revenue million Forecast, by Country 2020 & 2033
- Table 56: Global Rubber Process Oil Industry Volume Million Forecast, by Country 2020 & 2033
- Table 57: Brazil Rubber Process Oil Industry Revenue (million) Forecast, by Application 2020 & 2033
- Table 58: Brazil Rubber Process Oil Industry Volume (Million) Forecast, by Application 2020 & 2033
- Table 59: Argentina Rubber Process Oil Industry Revenue (million) Forecast, by Application 2020 & 2033
- Table 60: Argentina Rubber Process Oil Industry Volume (Million) Forecast, by Application 2020 & 2033
- Table 61: Rest of South America Rubber Process Oil Industry Revenue (million) Forecast, by Application 2020 & 2033
- Table 62: Rest of South America Rubber Process Oil Industry Volume (Million) Forecast, by Application 2020 & 2033
- Table 63: Global Rubber Process Oil Industry Revenue million Forecast, by Product Type 2020 & 2033
- Table 64: Global Rubber Process Oil Industry Volume Million Forecast, by Product Type 2020 & 2033
- Table 65: Global Rubber Process Oil Industry Revenue million Forecast, by Application 2020 & 2033
- Table 66: Global Rubber Process Oil Industry Volume Million Forecast, by Application 2020 & 2033
- Table 67: Global Rubber Process Oil Industry Revenue million Forecast, by Country 2020 & 2033
- Table 68: Global Rubber Process Oil Industry Volume Million Forecast, by Country 2020 & 2033
- Table 69: Saudi Arabia Rubber Process Oil Industry Revenue (million) Forecast, by Application 2020 & 2033
- Table 70: Saudi Arabia Rubber Process Oil Industry Volume (Million) Forecast, by Application 2020 & 2033
- Table 71: South Africa Rubber Process Oil Industry Revenue (million) Forecast, by Application 2020 & 2033
- Table 72: South Africa Rubber Process Oil Industry Volume (Million) Forecast, by Application 2020 & 2033
- Table 73: Rest of Middle East and Africa Rubber Process Oil Industry Revenue (million) Forecast, by Application 2020 & 2033
- Table 74: Rest of Middle East and Africa Rubber Process Oil Industry Volume (Million) Forecast, by Application 2020 & 2033
Frequently Asked Questions
1. What is the projected Compound Annual Growth Rate (CAGR) of the Rubber Process Oil Industry?
The projected CAGR is approximately 2.93%.
2. Which companies are prominent players in the Rubber Process Oil Industry?
Key companies in the market include APAR Industries, ORGKHIM Biochemical Holding, Exxon Mobil Corporation, Sterlite Lubricants, EaglePetrochem, Repsol, LODHA Petro, Chevron Corporation, Witmans Industries Pvt Ltd*List Not Exhaustive, TotalEnergies, HF Sinclair Corporation, Panama Petrochem Ltd, CPC Corporation.
3. What are the main segments of the Rubber Process Oil Industry?
The market segments include Product Type, Application.
4. Can you provide details about the market size?
The market size is estimated to be USD 3.73 million as of 2022.
5. What are some drivers contributing to market growth?
Increasing Demand for Tire and Automotive Components; Growing Demand for Footwear; Others.
6. What are the notable trends driving market growth?
Growing Demand of Rubber Process Oil from Tire and Automobile Components.
7. Are there any restraints impacting market growth?
Volatility in Raw Material Price; Other Restraints.
8. Can you provide examples of recent developments in the market?
N/A
9. What pricing options are available for accessing the report?
Pricing options include single-user, multi-user, and enterprise licenses priced at USD 4750, USD 5250, and USD 8750 respectively.
10. Is the market size provided in terms of value or volume?
The market size is provided in terms of value, measured in million and volume, measured in Million.
11. Are there any specific market keywords associated with the report?
Yes, the market keyword associated with the report is "Rubber Process Oil Industry," which aids in identifying and referencing the specific market segment covered.
12. How do I determine which pricing option suits my needs best?
The pricing options vary based on user requirements and access needs. Individual users may opt for single-user licenses, while businesses requiring broader access may choose multi-user or enterprise licenses for cost-effective access to the report.
13. Are there any additional resources or data provided in the Rubber Process Oil Industry report?
While the report offers comprehensive insights, it's advisable to review the specific contents or supplementary materials provided to ascertain if additional resources or data are available.
14. How can I stay updated on further developments or reports in the Rubber Process Oil Industry?
To stay informed about further developments, trends, and reports in the Rubber Process Oil Industry, consider subscribing to industry newsletters, following relevant companies and organizations, or regularly checking reputable industry news sources and publications.
Methodology
Step 1 - Identification of Relevant Samples Size from Population Database


Step 2 - Approaches for Defining Global Market Size (Value, Volume* & Price*)

Note*: In applicable scenarios
Step 3 - Data Sources
Primary Research
- Web Analytics
- Survey Reports
- Research Institute
- Latest Research Reports
- Opinion Leaders
Secondary Research
- Annual Reports
- White Paper
- Latest Press Release
- Industry Association
- Paid Database
- Investor Presentations

Step 4 - Data Triangulation
Involves using different sources of information in order to increase the validity of a study
These sources are likely to be stakeholders in a program - participants, other researchers, program staff, other community members, and so on.
Then we put all data in single framework & apply various statistical tools to find out the dynamic on the market.
During the analysis stage, feedback from the stakeholder groups would be compared to determine areas of agreement as well as areas of divergence