

Key Insights
The global rubidium market, valued at approximately 960.32 million in the base year 2025, is projected to expand at a compound annual growth rate (CAGR) of 5.6% from 2025 to 2033. This growth is propelled by escalating demand from the biomedical research sector, driven by innovations in atomic clocks and medical imaging. The electronics industry also significantly contributes, utilizing rubidium in specialized sensors and optical components. Further impetus comes from the expanding specialty glass and pyrotechnics sectors, leveraging rubidium compounds' unique properties. While challenges such as limited rubidium source availability and raw material price volatility exist, ongoing research into efficient extraction and supply chain diversification will mitigate these. Lepidolite and pollucite extraction currently dominate production, with emerging methods also noted. Key players including Sinomine Resource Group, Merck Kgaa, and Ganfeng Lithium are well-positioned for this expansion, emphasizing innovation and strategic alliances. The market exhibits a balanced geographic distribution across North America, Europe, and Asia-Pacific, with China and the United States as prominent regional hubs.
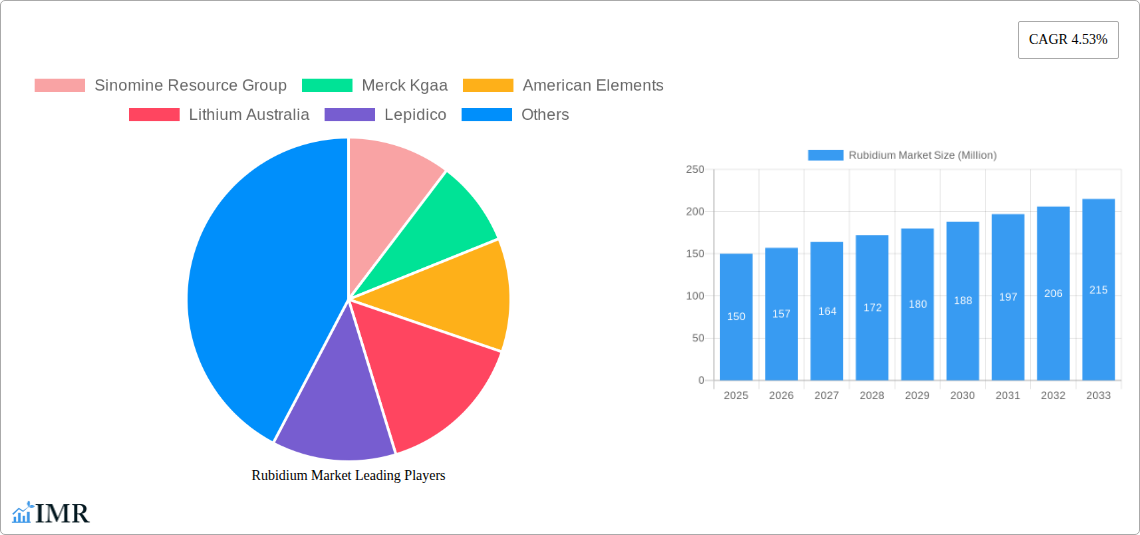
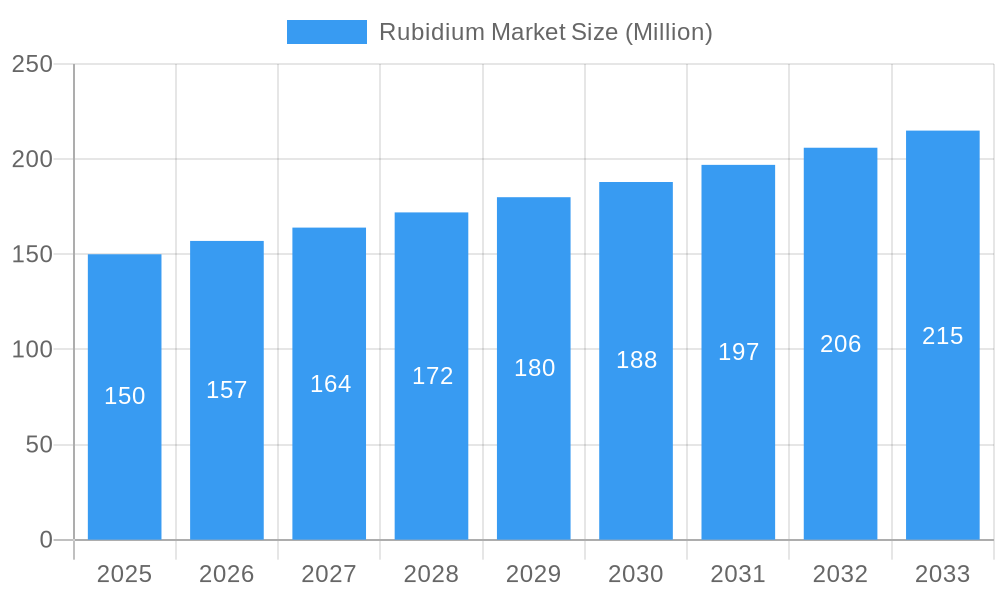
Rubidium Market Market Size (In Million)
The forecast period (2025-2033) anticipates sustained market expansion fueled by technological advancements that broaden rubidium's application in niche sectors. However, the growth trajectory is susceptible to global economic conditions and potential supply chain disruptions. Intensified competition among existing and emerging players will focus on sustainable, cost-effective production processes and geographical market expansion. Future growth opportunities are identified in alternative production processes beyond traditional sources and increased penetration in high-value biomedical research applications. Strategic mergers, acquisitions, and targeted R&D investments are expected to shape the market's future landscape.
Rubidium Market Company Market Share
This comprehensive report analyzes the Rubidium Market, detailing market dynamics, growth trends, regional segmentation, product landscape, key players, and future outlook. The study covers the period from 2019 to 2033, with 2025 designated as the base and estimated year. This analysis is vital for industry professionals, investors, and strategic decision-makers seeking a clear understanding of this evolving market.
Rubidium Market Dynamics & Structure
This section delves into the intricate structure of the Rubidium Market, examining market concentration, technological advancements, regulatory influences, competitive substitutes, and end-user demographics. We analyze the impact of mergers and acquisitions (M&A) activity, providing both quantitative and qualitative insights into the market's competitive landscape. The analysis considers the parent market of specialty chemicals and the child market of rare earth elements, offering a nuanced perspective on market forces.
- Market Concentration: The Rubidium market exhibits a moderately concentrated structure, with a few major players controlling a significant share. We estimate the top 5 players hold approximately xx% of the market share in 2025.
- Technological Innovation: Ongoing research into more efficient extraction and purification methods is driving innovation, alongside the development of new applications. This is met by challenges including the high cost of extraction and purification, leading to limited market penetration.
- Regulatory Frameworks: Government regulations concerning the extraction and use of rubidium vary across regions, influencing market dynamics. Stringent environmental regulations in certain areas add to production costs.
- Competitive Substitutes: The presence of substitute materials for certain rubidium applications poses a challenge, influencing overall market growth and price competitiveness.
- End-User Demographics: The primary end-users include the electronics, biomedical research, and specialty glass sectors. This report details the segment-wise consumption patterns and growth drivers.
- M&A Trends: The report analyzes recent M&A activity, estimating that xx deals were recorded during the historical period (2019-2024), primarily focused on securing resource access and expanding market reach. This trend is expected to continue, potentially leading to further market consolidation.
Rubidium Market Growth Trends & Insights
This section analyzes the historical and projected growth of the Rubidium Market using a robust methodology (XXX). It examines market size evolution, adoption rates, technological advancements, and shifts in consumer behavior. The analysis reveals a steady growth trajectory, driven by increasing demand from various application sectors.
This analysis includes a detailed breakdown of CAGR (Compound Annual Growth Rate) from 2019-2024 and projected CAGR for the forecast period (2025-2033). The report also assesses market penetration rates for different application segments, providing valuable insights into market potential and growth drivers. It incorporates a detailed assessment of technological disruptions and consumer preferences, providing a comprehensive market outlook. The current market size is projected at xx Million units in 2025.
Dominant Regions, Countries, or Segments in Rubidium Market
This section pinpoints the leading regions, countries, and segments within the Rubidium Market, focusing on production processes (Lepidolite, Pollucite, Other Production Processes) and application sectors (Biomedical Research, Electronics, Specialty Glass, Pyrotechnics, Other Application Sectors).
Production Processes:
- Lepidolite: This remains the primary source of rubidium production globally, with xx Million units produced in 2025, driven primarily by its abundance in certain regions. The report details the geographic distribution of Lepidolite reserves and the influence on production capacity.
- Pollucite: Pollucite represents a secondary, though significant source of rubidium, contributing xx Million units in 2025. We analyze the production capacity and its geographical spread.
- Other Production Processes: Other methods contribute a smaller yet notable portion of the market, with an estimated xx Million units in 2025, offering further potential for growth through advancements in extraction techniques.
Application Sectors:
- Electronics: The electronics sector remains the largest consumer of rubidium, with xx Million units consumed in 2025. The rising demand for advanced electronic components is a significant driver of growth in this segment.
- Biomedical Research: Biomedical applications demonstrate strong growth potential, consuming xx Million units in 2025. This is linked to growing investments in research and development.
- Specialty Glass: Specialty glass applications represent a notable segment, with an estimated xx Million units consumed in 2025, driven by demand for high-performance optical materials.
- Pyrotechnics: This segment contributes xx Million units in 2025, with steady, albeit less rapid, growth compared to other sectors.
Rubidium Market Product Landscape
The Rubidium market offers a range of products, primarily differentiated by purity levels and specific applications. High-purity rubidium is crucial for certain applications, particularly in electronics and biomedical research, commanding premium prices. Advances in purification technology are improving product quality and expanding applications. Specific performance metrics like purity, and stability are key differentiators, with manufacturers increasingly focusing on providing customized products to meet specific customer requirements.
Key Drivers, Barriers & Challenges in Rubidium Market
Key Drivers: The increasing demand from the electronics industry, coupled with advancements in rubidium extraction and purification techniques, are key growth drivers. Government support for research and development in related fields adds further impetus.
Challenges & Restraints: The primary challenges include the relatively high cost of production, limited supply compared to demand, and the presence of substitute materials for certain applications. This is aggravated by potential supply chain disruptions and regulatory hurdles in specific regions, impacting market expansion.
Emerging Opportunities in Rubidium Market
The Rubidium market presents significant opportunities in developing applications within emerging technologies like next-generation batteries and advanced materials. Untapped markets in developing economies also offer substantial growth potential, alongside the development of innovative applications in various sectors. The adoption of more efficient and cost-effective production methods will unlock further opportunities for market expansion.
Growth Accelerators in the Rubidium Market Industry
Technological breakthroughs in extraction and purification, strategic partnerships to secure resource supplies, and successful market expansion initiatives, particularly in emerging economies, will be crucial for accelerating market growth in the long term. Growing investments in R&D, and innovative product development will also contribute to market expansion.
Key Players Shaping the Rubidium Market Market
- Sinomine Resource Group
- Merck Kgaa
- American Elements
- Lithium Australia
- Lepidico
- Ganfeng Lithium
- Thermo Fisher Scientific
- Jiangxi Special Electric Motor
- International Lithium Corp
Notable Milestones in Rubidium Market Sector
- December 2022: Aldoro Resources granted rubidium and lithium prospective tenement near Mt Magnet in Western Australia. This development signifies potential expansion of rubidium resources and production capacity.
- August 2021: International Lithium Corp. acquired through staking more than 14,000 hectares of claims in the vicinity of the Raleigh Lake lithium and rubidium project in Ontario, Canada, bringing the Raleigh Lake project area to just over 17,000 hectares (170 sq km). This acquisition significantly expands International Lithium Corp.'s resource base and enhances its market position.
In-Depth Rubidium Market Market Outlook
The Rubidium Market is poised for continued growth driven by the sustained demand from key application sectors, particularly electronics and biomedical research. Strategic investments in R&D, efficient production techniques, and expansion into new markets will drive long-term growth and profitability. The market presents significant opportunities for companies focusing on technological innovation and strategic partnerships. The forecast for 2033 projects a market size of xx Million units, indicating substantial growth potential.
Rubidium Market Segmentation
-
1. Production Process
- 1.1. Lepidolite
- 1.2. Pollucite
- 1.3. Other Production Processes
-
2. Application Sector
- 2.1. Biomedical Research
- 2.2. Electronics
- 2.3. Specialty Glass
- 2.4. Pyrotechnics
- 2.5. Other Application Sectors
Rubidium Market Segmentation By Geography
- 1. Asia Pacific
- 2. North America
- 3. Europe
- 4. Rest of the World
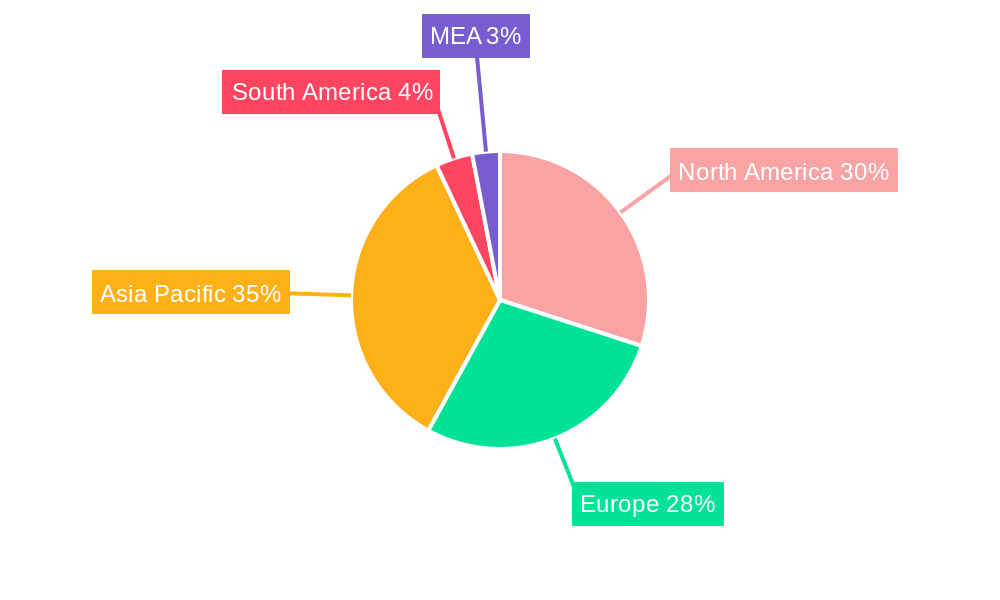
Rubidium Market Regional Market Share
Geographic Coverage of Rubidium Market
Rubidium Market REPORT HIGHLIGHTS
| Aspects | Details |
|---|---|
| Study Period | 2020-2034 |
| Base Year | 2025 |
| Estimated Year | 2026 |
| Forecast Period | 2026-2034 |
| Historical Period | 2020-2025 |
| Growth Rate | CAGR of 5.6% from 2020-2034 |
| Segmentation |
|
Table of Contents
- 1. Introduction
- 1.1. Research Scope
- 1.2. Market Segmentation
- 1.3. Research Objective
- 1.4. Definitions and Assumptions
- 2. Executive Summary
- 2.1. Market Snapshot
- 3. Market Dynamics
- 3.1. Market Drivers
- 3.2. Market Restrains
- 3.3. Market Trends
- 3.4. Market Opportunities
- 4. Market Factor Analysis
- 4.1. Porters Five Forces
- 4.1.1. Bargaining Power of Suppliers
- 4.1.2. Bargaining Power of Buyers
- 4.1.3. Threat of New Entrants
- 4.1.4. Threat of Substitutes
- 4.1.5. Competitive Rivalry
- 4.2. PESTEL analysis
- 4.3. BCG Analysis
- 4.3.1. Stars (High Growth, High Market Share)
- 4.3.2. Cash Cows (Low Growth, High Market Share)
- 4.3.3. Question Mark (High Growth, Low Market Share)
- 4.3.4. Dogs (Low Growth, Low Market Share)
- 4.4. Ansoff Matrix Analysis
- 4.5. Supply Chain Analysis
- 4.6. Regulatory Landscape
- 4.7. Current Market Potential and Opportunity Assessment (TAM–SAM–SOM Framework)
- 4.8. IMR Analyst Note
- 4.1. Porters Five Forces
- 5. Market Analysis, Insights and Forecast 2021-2033
- 5.1. Market Analysis, Insights and Forecast - by Production Process
- 5.1.1. Lepidolite
- 5.1.2. Pollucite
- 5.1.3. Other Production Processes
- 5.2. Market Analysis, Insights and Forecast - by Application Sector
- 5.2.1. Biomedical Research
- 5.2.2. Electronics
- 5.2.3. Specialty Glass
- 5.2.4. Pyrotechnics
- 5.2.5. Other Application Sectors
- 5.3. Market Analysis, Insights and Forecast - by Region
- 5.3.1. Asia Pacific
- 5.3.2. North America
- 5.3.3. Europe
- 5.3.4. Rest of the World
- 5.1. Market Analysis, Insights and Forecast - by Production Process
- 6. Global Rubidium Market Analysis, Insights and Forecast, 2021-2033
- 6.1. Market Analysis, Insights and Forecast - by Production Process
- 6.1.1. Lepidolite
- 6.1.2. Pollucite
- 6.1.3. Other Production Processes
- 6.2. Market Analysis, Insights and Forecast - by Application Sector
- 6.2.1. Biomedical Research
- 6.2.2. Electronics
- 6.2.3. Specialty Glass
- 6.2.4. Pyrotechnics
- 6.2.5. Other Application Sectors
- 6.1. Market Analysis, Insights and Forecast - by Production Process
- 7. Asia Pacific Rubidium Market Analysis, Insights and Forecast, 2020-2032
- 7.1. Market Analysis, Insights and Forecast - by Production Process
- 7.1.1. Lepidolite
- 7.1.2. Pollucite
- 7.1.3. Other Production Processes
- 7.2. Market Analysis, Insights and Forecast - by Application Sector
- 7.2.1. Biomedical Research
- 7.2.2. Electronics
- 7.2.3. Specialty Glass
- 7.2.4. Pyrotechnics
- 7.2.5. Other Application Sectors
- 7.1. Market Analysis, Insights and Forecast - by Production Process
- 8. North America Rubidium Market Analysis, Insights and Forecast, 2020-2032
- 8.1. Market Analysis, Insights and Forecast - by Production Process
- 8.1.1. Lepidolite
- 8.1.2. Pollucite
- 8.1.3. Other Production Processes
- 8.2. Market Analysis, Insights and Forecast - by Application Sector
- 8.2.1. Biomedical Research
- 8.2.2. Electronics
- 8.2.3. Specialty Glass
- 8.2.4. Pyrotechnics
- 8.2.5. Other Application Sectors
- 8.1. Market Analysis, Insights and Forecast - by Production Process
- 9. Europe Rubidium Market Analysis, Insights and Forecast, 2020-2032
- 9.1. Market Analysis, Insights and Forecast - by Production Process
- 9.1.1. Lepidolite
- 9.1.2. Pollucite
- 9.1.3. Other Production Processes
- 9.2. Market Analysis, Insights and Forecast - by Application Sector
- 9.2.1. Biomedical Research
- 9.2.2. Electronics
- 9.2.3. Specialty Glass
- 9.2.4. Pyrotechnics
- 9.2.5. Other Application Sectors
- 9.1. Market Analysis, Insights and Forecast - by Production Process
- 10. Rest of the World Rubidium Market Analysis, Insights and Forecast, 2020-2032
- 10.1. Market Analysis, Insights and Forecast - by Production Process
- 10.1.1. Lepidolite
- 10.1.2. Pollucite
- 10.1.3. Other Production Processes
- 10.2. Market Analysis, Insights and Forecast - by Application Sector
- 10.2.1. Biomedical Research
- 10.2.2. Electronics
- 10.2.3. Specialty Glass
- 10.2.4. Pyrotechnics
- 10.2.5. Other Application Sectors
- 10.1. Market Analysis, Insights and Forecast - by Production Process
- 11. Competitive Analysis
- 11.1. Company Profiles
- 11.1.1 Sinomine Resource Group
- 11.1.1.1. Company Overview
- 11.1.1.2. Products
- 11.1.1.3. Company Financials
- 11.1.1.4. SWOT Analysis
- 11.1.2 Merck Kgaa
- 11.1.2.1. Company Overview
- 11.1.2.2. Products
- 11.1.2.3. Company Financials
- 11.1.2.4. SWOT Analysis
- 11.1.3 American Elements
- 11.1.3.1. Company Overview
- 11.1.3.2. Products
- 11.1.3.3. Company Financials
- 11.1.3.4. SWOT Analysis
- 11.1.4 Lithium Australia
- 11.1.4.1. Company Overview
- 11.1.4.2. Products
- 11.1.4.3. Company Financials
- 11.1.4.4. SWOT Analysis
- 11.1.5 Lepidico
- 11.1.5.1. Company Overview
- 11.1.5.2. Products
- 11.1.5.3. Company Financials
- 11.1.5.4. SWOT Analysis
- 11.1.6 Ganfeng Lithium
- 11.1.6.1. Company Overview
- 11.1.6.2. Products
- 11.1.6.3. Company Financials
- 11.1.6.4. SWOT Analysis
- 11.1.7 Thermo Fisher Scientific
- 11.1.7.1. Company Overview
- 11.1.7.2. Products
- 11.1.7.3. Company Financials
- 11.1.7.4. SWOT Analysis
- 11.1.8 Jiangxi Special Electric Motor
- 11.1.8.1. Company Overview
- 11.1.8.2. Products
- 11.1.8.3. Company Financials
- 11.1.8.4. SWOT Analysis
- 11.1.9 International Lithium Corp
- 11.1.9.1. Company Overview
- 11.1.9.2. Products
- 11.1.9.3. Company Financials
- 11.1.9.4. SWOT Analysis
- 11.1.1 Sinomine Resource Group
- 11.2. Market Entropy
- 11.2.1 Company's Key Areas Served
- 11.2.2 Recent Developments
- 11.3. Company Market Share Analysis 2025
- 11.3.1 Top 5 Companies Market Share Analysis
- 11.3.2 Top 3 Companies Market Share Analysis
- 11.4. List of Potential Customers
- 12. Research Methodology
List of Figures
- Figure 1: Global Rubidium Market Revenue Breakdown (million, %) by Region 2025 & 2033
- Figure 2: Global Rubidium Market Volume Breakdown (K Tons, %) by Region 2025 & 2033
- Figure 3: Asia Pacific Rubidium Market Revenue (million), by Production Process 2025 & 2033
- Figure 4: Asia Pacific Rubidium Market Volume (K Tons), by Production Process 2025 & 2033
- Figure 5: Asia Pacific Rubidium Market Revenue Share (%), by Production Process 2025 & 2033
- Figure 6: Asia Pacific Rubidium Market Volume Share (%), by Production Process 2025 & 2033
- Figure 7: Asia Pacific Rubidium Market Revenue (million), by Application Sector 2025 & 2033
- Figure 8: Asia Pacific Rubidium Market Volume (K Tons), by Application Sector 2025 & 2033
- Figure 9: Asia Pacific Rubidium Market Revenue Share (%), by Application Sector 2025 & 2033
- Figure 10: Asia Pacific Rubidium Market Volume Share (%), by Application Sector 2025 & 2033
- Figure 11: Asia Pacific Rubidium Market Revenue (million), by Country 2025 & 2033
- Figure 12: Asia Pacific Rubidium Market Volume (K Tons), by Country 2025 & 2033
- Figure 13: Asia Pacific Rubidium Market Revenue Share (%), by Country 2025 & 2033
- Figure 14: Asia Pacific Rubidium Market Volume Share (%), by Country 2025 & 2033
- Figure 15: North America Rubidium Market Revenue (million), by Production Process 2025 & 2033
- Figure 16: North America Rubidium Market Volume (K Tons), by Production Process 2025 & 2033
- Figure 17: North America Rubidium Market Revenue Share (%), by Production Process 2025 & 2033
- Figure 18: North America Rubidium Market Volume Share (%), by Production Process 2025 & 2033
- Figure 19: North America Rubidium Market Revenue (million), by Application Sector 2025 & 2033
- Figure 20: North America Rubidium Market Volume (K Tons), by Application Sector 2025 & 2033
- Figure 21: North America Rubidium Market Revenue Share (%), by Application Sector 2025 & 2033
- Figure 22: North America Rubidium Market Volume Share (%), by Application Sector 2025 & 2033
- Figure 23: North America Rubidium Market Revenue (million), by Country 2025 & 2033
- Figure 24: North America Rubidium Market Volume (K Tons), by Country 2025 & 2033
- Figure 25: North America Rubidium Market Revenue Share (%), by Country 2025 & 2033
- Figure 26: North America Rubidium Market Volume Share (%), by Country 2025 & 2033
- Figure 27: Europe Rubidium Market Revenue (million), by Production Process 2025 & 2033
- Figure 28: Europe Rubidium Market Volume (K Tons), by Production Process 2025 & 2033
- Figure 29: Europe Rubidium Market Revenue Share (%), by Production Process 2025 & 2033
- Figure 30: Europe Rubidium Market Volume Share (%), by Production Process 2025 & 2033
- Figure 31: Europe Rubidium Market Revenue (million), by Application Sector 2025 & 2033
- Figure 32: Europe Rubidium Market Volume (K Tons), by Application Sector 2025 & 2033
- Figure 33: Europe Rubidium Market Revenue Share (%), by Application Sector 2025 & 2033
- Figure 34: Europe Rubidium Market Volume Share (%), by Application Sector 2025 & 2033
- Figure 35: Europe Rubidium Market Revenue (million), by Country 2025 & 2033
- Figure 36: Europe Rubidium Market Volume (K Tons), by Country 2025 & 2033
- Figure 37: Europe Rubidium Market Revenue Share (%), by Country 2025 & 2033
- Figure 38: Europe Rubidium Market Volume Share (%), by Country 2025 & 2033
- Figure 39: Rest of the World Rubidium Market Revenue (million), by Production Process 2025 & 2033
- Figure 40: Rest of the World Rubidium Market Volume (K Tons), by Production Process 2025 & 2033
- Figure 41: Rest of the World Rubidium Market Revenue Share (%), by Production Process 2025 & 2033
- Figure 42: Rest of the World Rubidium Market Volume Share (%), by Production Process 2025 & 2033
- Figure 43: Rest of the World Rubidium Market Revenue (million), by Application Sector 2025 & 2033
- Figure 44: Rest of the World Rubidium Market Volume (K Tons), by Application Sector 2025 & 2033
- Figure 45: Rest of the World Rubidium Market Revenue Share (%), by Application Sector 2025 & 2033
- Figure 46: Rest of the World Rubidium Market Volume Share (%), by Application Sector 2025 & 2033
- Figure 47: Rest of the World Rubidium Market Revenue (million), by Country 2025 & 2033
- Figure 48: Rest of the World Rubidium Market Volume (K Tons), by Country 2025 & 2033
- Figure 49: Rest of the World Rubidium Market Revenue Share (%), by Country 2025 & 2033
- Figure 50: Rest of the World Rubidium Market Volume Share (%), by Country 2025 & 2033
List of Tables
- Table 1: Global Rubidium Market Revenue million Forecast, by Production Process 2020 & 2033
- Table 2: Global Rubidium Market Volume K Tons Forecast, by Production Process 2020 & 2033
- Table 3: Global Rubidium Market Revenue million Forecast, by Application Sector 2020 & 2033
- Table 4: Global Rubidium Market Volume K Tons Forecast, by Application Sector 2020 & 2033
- Table 5: Global Rubidium Market Revenue million Forecast, by Region 2020 & 2033
- Table 6: Global Rubidium Market Volume K Tons Forecast, by Region 2020 & 2033
- Table 7: Global Rubidium Market Revenue million Forecast, by Production Process 2020 & 2033
- Table 8: Global Rubidium Market Volume K Tons Forecast, by Production Process 2020 & 2033
- Table 9: Global Rubidium Market Revenue million Forecast, by Application Sector 2020 & 2033
- Table 10: Global Rubidium Market Volume K Tons Forecast, by Application Sector 2020 & 2033
- Table 11: Global Rubidium Market Revenue million Forecast, by Country 2020 & 2033
- Table 12: Global Rubidium Market Volume K Tons Forecast, by Country 2020 & 2033
- Table 13: Global Rubidium Market Revenue million Forecast, by Production Process 2020 & 2033
- Table 14: Global Rubidium Market Volume K Tons Forecast, by Production Process 2020 & 2033
- Table 15: Global Rubidium Market Revenue million Forecast, by Application Sector 2020 & 2033
- Table 16: Global Rubidium Market Volume K Tons Forecast, by Application Sector 2020 & 2033
- Table 17: Global Rubidium Market Revenue million Forecast, by Country 2020 & 2033
- Table 18: Global Rubidium Market Volume K Tons Forecast, by Country 2020 & 2033
- Table 19: Global Rubidium Market Revenue million Forecast, by Production Process 2020 & 2033
- Table 20: Global Rubidium Market Volume K Tons Forecast, by Production Process 2020 & 2033
- Table 21: Global Rubidium Market Revenue million Forecast, by Application Sector 2020 & 2033
- Table 22: Global Rubidium Market Volume K Tons Forecast, by Application Sector 2020 & 2033
- Table 23: Global Rubidium Market Revenue million Forecast, by Country 2020 & 2033
- Table 24: Global Rubidium Market Volume K Tons Forecast, by Country 2020 & 2033
- Table 25: Global Rubidium Market Revenue million Forecast, by Production Process 2020 & 2033
- Table 26: Global Rubidium Market Volume K Tons Forecast, by Production Process 2020 & 2033
- Table 27: Global Rubidium Market Revenue million Forecast, by Application Sector 2020 & 2033
- Table 28: Global Rubidium Market Volume K Tons Forecast, by Application Sector 2020 & 2033
- Table 29: Global Rubidium Market Revenue million Forecast, by Country 2020 & 2033
- Table 30: Global Rubidium Market Volume K Tons Forecast, by Country 2020 & 2033
Frequently Asked Questions
1. What is the projected Compound Annual Growth Rate (CAGR) of the Rubidium Market?
The projected CAGR is approximately 5.6%.
2. Which companies are prominent players in the Rubidium Market?
Key companies in the market include Sinomine Resource Group, Merck Kgaa, American Elements, Lithium Australia, Lepidico, Ganfeng Lithium, Thermo Fisher Scientific, Jiangxi Special Electric Motor, International Lithium Corp.
3. What are the main segments of the Rubidium Market?
The market segments include Production Process, Application Sector.
4. Can you provide details about the market size?
The market size is estimated to be USD 960.32 million as of 2022.
5. What are some drivers contributing to market growth?
Growing Biomedical Applications; Applications in Specialty Glass.
6. What are the notable trends driving market growth?
Specialty Glass to Dominate the Market.
7. Are there any restraints impacting market growth?
Availability and High Cost of Rubidium; Transportation and Storage-Related Safety Difficulties.
8. Can you provide examples of recent developments in the market?
December 2022: Aldoro Resources granted rubidium and lithium prospective tenement near Mt Magnet in Western Australia.
9. What pricing options are available for accessing the report?
Pricing options include single-user, multi-user, and enterprise licenses priced at USD 4750, USD 5250, and USD 8750 respectively.
10. Is the market size provided in terms of value or volume?
The market size is provided in terms of value, measured in million and volume, measured in K Tons.
11. Are there any specific market keywords associated with the report?
Yes, the market keyword associated with the report is "Rubidium Market," which aids in identifying and referencing the specific market segment covered.
12. How do I determine which pricing option suits my needs best?
The pricing options vary based on user requirements and access needs. Individual users may opt for single-user licenses, while businesses requiring broader access may choose multi-user or enterprise licenses for cost-effective access to the report.
13. Are there any additional resources or data provided in the Rubidium Market report?
While the report offers comprehensive insights, it's advisable to review the specific contents or supplementary materials provided to ascertain if additional resources or data are available.
14. How can I stay updated on further developments or reports in the Rubidium Market?
To stay informed about further developments, trends, and reports in the Rubidium Market, consider subscribing to industry newsletters, following relevant companies and organizations, or regularly checking reputable industry news sources and publications.
Methodology
Step 1 - Identification of Relevant Samples Size from Population Database


Step 2 - Approaches for Defining Global Market Size (Value, Volume* & Price*)

Note*: In applicable scenarios
Step 3 - Data Sources
Primary Research
- Web Analytics
- Survey Reports
- Research Institute
- Latest Research Reports
- Opinion Leaders
Secondary Research
- Annual Reports
- White Paper
- Latest Press Release
- Industry Association
- Paid Database
- Investor Presentations

Step 4 - Data Triangulation
Involves using different sources of information in order to increase the validity of a study
These sources are likely to be stakeholders in a program - participants, other researchers, program staff, other community members, and so on.
Then we put all data in single framework & apply various statistical tools to find out the dynamic on the market.
During the analysis stage, feedback from the stakeholder groups would be compared to determine areas of agreement as well as areas of divergence