

Key Insights
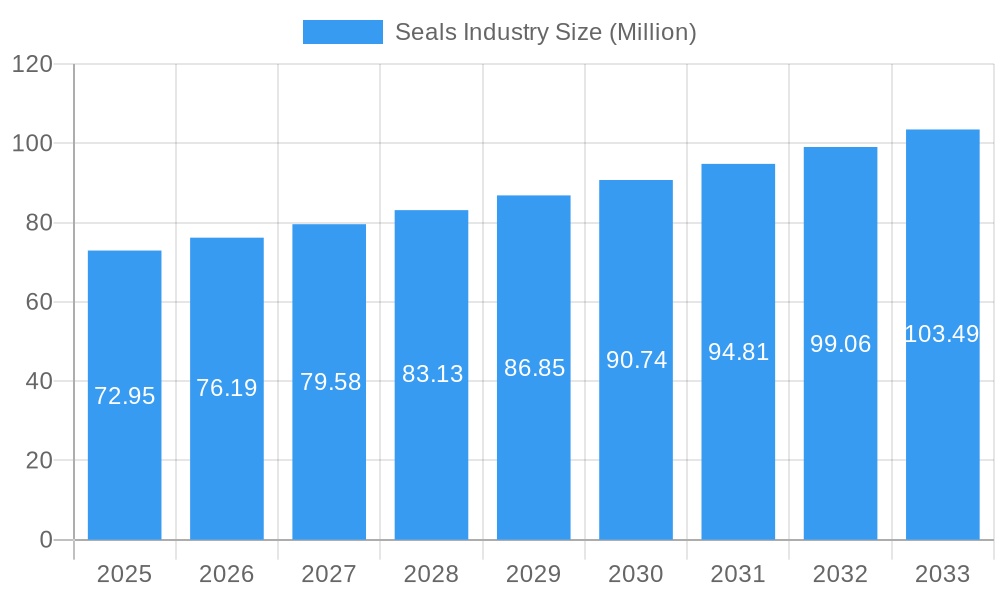
The global seals market, valued at $72.95 million in 2025, is projected to experience robust growth, driven by a compound annual growth rate (CAGR) exceeding 4.00% from 2025 to 2033. This expansion is fueled by several key factors. The burgeoning automotive industry, particularly the increasing demand for electric vehicles and advanced driver-assistance systems (ADAS), necessitates high-performance sealing solutions to ensure efficiency and reliability. Similarly, the growth of the aerospace and oil & gas sectors, demanding advanced materials and leak-proof seals for demanding environments, contributes significantly to market growth. Technological advancements in seal materials, such as the development of more durable and chemically resistant polymers and composites, are further enhancing product performance and driving adoption. Furthermore, stringent environmental regulations are pushing manufacturers towards eco-friendly sealing solutions, creating new opportunities for innovative materials like bio-based polymers. Increased automation in manufacturing processes is also impacting the market, favoring efficient and easily integrable seal designs.
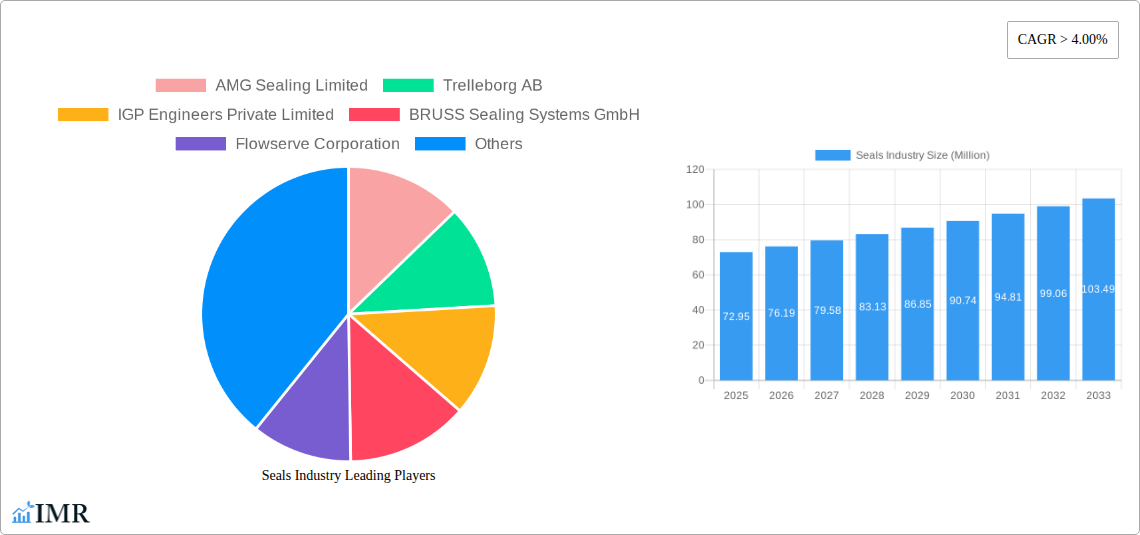
Seals Industry Market Size (In Million)
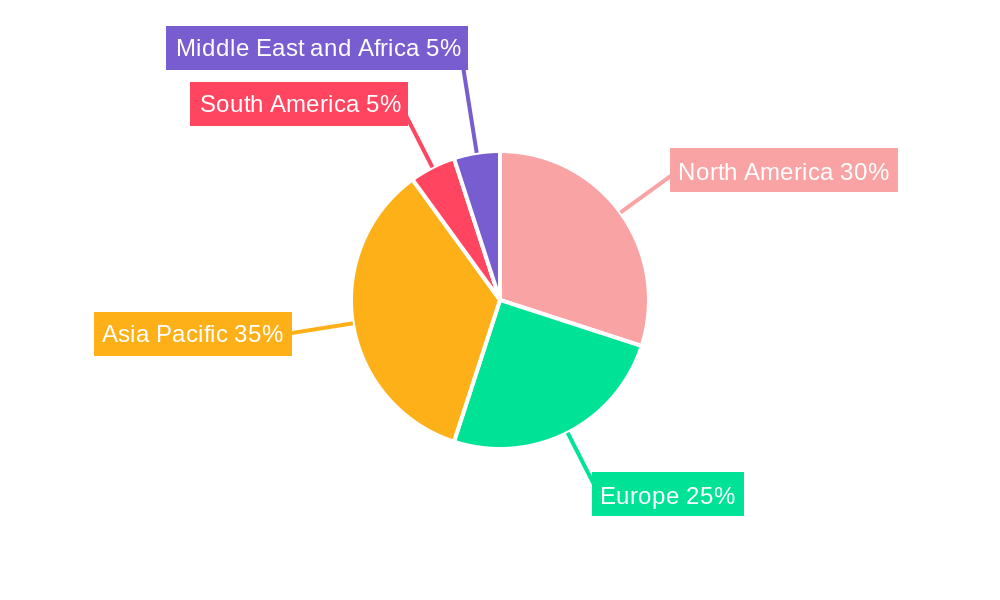
Segment-wise, the automotive application segment currently holds a significant market share, followed by aerospace and oil & gas. Within materials, rubber and PTFE continue to dominate, owing to their versatility and cost-effectiveness, however, graphite and fiber materials are gaining traction due to their superior performance characteristics in high-temperature and high-pressure applications. Geographically, the Asia-Pacific region, driven by strong industrial growth in countries like China and India, is anticipated to witness the fastest growth rate. North America and Europe maintain substantial market shares, propelled by established automotive and industrial sectors. However, emerging markets in South America and the Middle East & Africa present promising opportunities for future expansion as industrialization and infrastructure development accelerate. The competitive landscape is characterized by a mix of established global players and regional manufacturers, leading to ongoing innovation and price competition.
Seals Industry Company Market Share
Seals Industry Market Report: 2019-2033
This comprehensive report provides an in-depth analysis of the global Seals Industry, encompassing market dynamics, growth trends, regional dominance, product landscapes, key players, and future outlook. The study period covers 2019-2033, with 2025 as the base and estimated year. This report is essential for industry professionals, investors, and strategic decision-makers seeking a clear understanding of this dynamic market. The report's parent market is the broader industrial components market, with the child market being the specialized seals segment. Market values are presented in Million units.
Seals Industry Market Dynamics & Structure
The global seals market is characterized by a dynamic interplay of technological innovation, stringent regulatory requirements, and evolving end-user demands. With a projected valuation of **[Insert 2025 Market Value Here] Million** in 2025, the market exhibits a moderately concentrated structure. This landscape features established global leaders alongside agile niche operators, fostering a competitive environment driven by advancements in materials science and sophisticated manufacturing processes. Regulatory frameworks, particularly concerning safety and environmental compliance across critical sectors like automotive, aerospace, and industrial manufacturing, exert significant influence, shaping product development and market entry strategies. The continuous emergence of advanced sealing technologies and substitute solutions presents ongoing challenges and opportunities for innovation. Demand is intrinsically linked to industrial growth and shifts in end-user demographics, with sectors such as automotive, energy, and heavy machinery serving as key indicators of market health. Mergers and acquisitions (M&A) activity, while moderate, remains strategically focused on enhancing product portfolios, expanding technological capabilities, and broadening geographic reach.
- Market Concentration: The top 5 players are estimated to hold approximately **[Insert Top 5 Market Share Percentage Here]**% of the market share in 2025.
- M&A Activity: An estimated **[Insert Number of Deals Here]** M&A deals were recorded between 2019 and 2024, with an average deal value of **[Insert Average Deal Value Here] Million**.
- Innovation Barriers: Significant barriers to innovation include substantial Research & Development (R&D) investments and rigorous, multi-stage testing and validation processes essential for meeting industry-specific performance standards.
- Regulatory Landscape: Compliance with evolving emission standards (e.g., in the automotive sector) and critical safety regulations (e.g., in aerospace and medical applications) is a paramount driver of product innovation, necessitating the development of high-performance, reliable sealing solutions.
Seals Industry Growth Trends & Insights
The global seals market is poised for robust expansion, with projections indicating a market value of **[Insert 2033 Market Value Here] Million** by 2033. This growth trajectory, anticipated to maintain a Compound Annual Growth Rate (CAGR) of approximately **[Insert CAGR Percentage Here]**% from 2025 to 2033, is underpinned by escalating demand across a spectrum of end-use industries. Key sectors such as automotive, aerospace, oil & gas, and renewable energy are significant contributors to this upward trend. Continuous technological advancements are instrumental in driving market penetration, offering seals with enhanced performance characteristics, superior durability, and improved operational efficiency. Furthermore, a growing consumer and industrial preference for high-performance, sustainable, and environmentally friendly sealing solutions is creating new avenues for market growth. The increasing adoption of advanced seal materials, including high-performance polymers like PTFE and specialized elastomers, is a notable trend. Emerging disruptive technologies, such as additive manufacturing (3D printing), are also beginning to influence production methodologies, potentially leading to more cost-effective and customized sealing solutions.
Dominant Regions, Countries, or Segments in Seals Industry
North America currently holds the largest market share in the seals industry, driven by strong automotive and industrial manufacturing sectors. However, Asia-Pacific is projected to experience the highest growth rate, fueled by rapid industrialization and rising infrastructure development. Within the product segments, gaskets represent the largest share, followed by other gaskets (semi-metallic). In terms of materials, rubber remains dominant due to its cost-effectiveness and versatility, although the demand for high-performance materials like PTFE and graphite is growing rapidly in specialized applications. The automotive application segment holds the largest market share, owing to the high volume of vehicles produced globally.
- Key Drivers in North America: Strong automotive and aerospace industries, advanced manufacturing capabilities.
- Key Drivers in Asia-Pacific: Rapid industrialization, infrastructure development, increasing automotive production.
- Key Drivers in Automotive Segment: Rising vehicle production, stricter emission standards.
- Key Drivers in Oil & Gas Segment: Exploration and production activities, pipeline infrastructure development.
Seals Industry Product Landscape
The seals industry presents a highly diversified product landscape, featuring a wide array of gasket and seal types meticulously engineered for specific operational environments and demanding applications. Recent pioneering innovations include the development of advanced, high-temperature resistant seals critical for the aerospace sector, and the introduction of lightweight, high-strength composite seals designed for the rigorous demands of modern automotive applications. The industry's focus on key performance metrics remains sharp, emphasizing exceptional durability, absolute leak-proof integrity, superior chemical resistance, and the ability to withstand extreme operating temperature ranges. Unique selling propositions often revolve around enhanced sealing effectiveness in challenging conditions, significant reductions in friction to improve energy efficiency, and substantial extensions in service life, thereby lowering total cost of ownership for end-users. Technological advancements, particularly in novel material formulations and sophisticated design methodologies, are the linchpins of product differentiation and competitive advantage within this dynamic market.
Key Drivers, Barriers & Challenges in Seals Industry
Key Drivers:
- Growing End-Use Sector Demand: Sustained and increasing demand from critical sectors such as automotive (especially with the growth of EVs), aerospace, oil & gas, and industrial machinery.
- Technological Advancements: Continuous innovation in material science, manufacturing techniques, and product design leading to seals with superior performance, longevity, and efficiency.
- Stringent Regulatory Compliance: Increasingly rigorous safety, environmental, and performance standards across various industries are driving the adoption of advanced sealing materials and sophisticated designs to meet these requirements.
- Focus on Sustainability: Growing emphasis on eco-friendly materials and solutions that reduce environmental impact and improve energy efficiency.
Key Barriers:
- Fluctuations in Raw Material Prices: Volatility in the cost of key raw materials, such as specialized polymers and metals, can significantly impact manufacturing costs and profit margins.
- Intense Market Competition: A highly competitive landscape with numerous established global players and agile emerging companies vying for market share.
- Supply Chain Disruptions: Global events and logistical challenges can lead to disruptions in the supply chain, affecting production schedules and delivery timelines, with an estimated impact of **[Insert Estimated Impact Value Here] Million** on the 2025 market value.
- High Capital Investment: Significant upfront investment required for advanced manufacturing equipment, R&D, and compliance certifications.
Emerging Opportunities in Seals Industry
- Growing demand for sustainable and environmentally friendly seals.
- Expansion into emerging markets with high growth potential (e.g., India, Southeast Asia).
- Development of innovative seal designs for next-generation technologies (e.g., electric vehicles, renewable energy).
Growth Accelerators in the Seals Industry
Long-term growth in the seals industry will be driven by continuous technological innovation, strategic partnerships fostering collaboration and knowledge-sharing, and expansion into new geographic markets. The development of advanced materials with improved performance characteristics will continue to play a significant role. Strategic acquisitions and mergers will enable players to expand their product portfolios and market reach, further accelerating growth.
Key Players Shaping the Seals Industry Market
- AMG Sealing Limited
- Trelleborg AB
- IGP Engineers Private Limited
- BRUSS Sealing Systems GmbH
- Flowserve Corporation
- Dechengwang
- Tenneco Inc
- Phelps
- SKF
- Dana Limited
- Smiths Group plc
- Cooper Standard
- Freudenberg Sealing Technologies
- Dätwyler Holding Inc
- ElringKlinger AG
- John Crane
- Garlock an Enpro Industries Inc
- Saunders
- KLINGER Holding GmbH
Notable Milestones in Seals Industry Sector
- 2020: Freudenberg Sealing Technologies launched a new range of sustainable seals.
- 2021: Trelleborg AB acquired a smaller seal manufacturer, expanding its product portfolio.
- 2022: Significant investments in R&D for advanced seal materials across several key players.
- 2023: New regulations impacting seal material composition in the automotive sector were implemented.
- 2024: Several key players announced partnerships focusing on sustainable manufacturing processes.
In-Depth Seals Industry Market Outlook
The future of the seals industry is bright, with significant growth potential driven by technological advancements, expanding application areas, and increasing demand across various end-use sectors. Strategic investments in R&D, focus on sustainability, and expansion into high-growth markets will be crucial for success. The market is poised to benefit from the growth of related sectors like renewable energy and electric vehicles, creating sustained demand for advanced seal technologies.
Seals Industry Segmentation
-
1. Product
-
1.1. Gaskets
- 1.1.1. Metallic Gasket
- 1.1.2. Rubber Gasket
- 1.1.3. Cork Gasket
- 1.1.4. Non-asbestos Gasket
- 1.1.5. Spiral Wound Gasket
- 1.1.6. Other Gaskets (Semi-Metallic Gasket)
-
1.2. Seals
- 1.2.1. Shaft Seals
- 1.2.2. Molded Seals
- 1.2.3. Motor Vehicle Body Seals
- 1.2.4. Other Seals (Fork Seal and Piston Seal)
-
1.1. Gaskets
-
2. Material
- 2.1. Fiber
- 2.2. Graphite
- 2.3. PTFE
- 2.4. Rubber
- 2.5. Other Materials (Metal, Cork, Polymers and Felt)
-
3. Application
- 3.1. Aerospace
- 3.2. Automotive
- 3.3. Electronics
- 3.4. Oil and Gas
- 3.5. Power Generation
- 3.6. Other Applications (Industrial)
Seals Industry Segmentation By Geography
-
1. Asia Pacific
- 1.1. China
- 1.2. India
- 1.3. Japan
- 1.4. South Korea
- 1.5. Rest of Asia Pacific
-
2. North America
- 2.1. United States
- 2.2. Canada
- 2.3. Mexico
-
3. Europe
- 3.1. Germany
- 3.2. United Kingdom
- 3.3. France
- 3.4. Italy
- 3.5. Rest of Europe
-
4. South America
- 4.1. Brazil
- 4.2. Argentina
- 4.3. Rest of South America
-
5. Middle East and Africa
- 5.1. Saudi Arabia
- 5.2. South Africa
- 5.3. Rest of Middle East and Africa
Seals Industry Regional Market Share
Geographic Coverage of Seals Industry
Seals Industry REPORT HIGHLIGHTS
| Aspects | Details |
|---|---|
| Study Period | 2020-2034 |
| Base Year | 2025 |
| Estimated Year | 2026 |
| Forecast Period | 2026-2034 |
| Historical Period | 2020-2025 |
| Growth Rate | CAGR of > 4.00% from 2020-2034 |
| Segmentation |
|
Table of Contents
- 1. Introduction
- 1.1. Research Scope
- 1.2. Market Segmentation
- 1.3. Research Objective
- 1.4. Definitions and Assumptions
- 2. Executive Summary
- 2.1. Market Snapshot
- 3. Market Dynamics
- 3.1. Market Drivers
- 3.2. Market Restrains
- 3.3. Market Trends
- 3.4. Market Opportunities
- 4. Market Factor Analysis
- 4.1. Porters Five Forces
- 4.1.1. Bargaining Power of Suppliers
- 4.1.2. Bargaining Power of Buyers
- 4.1.3. Threat of New Entrants
- 4.1.4. Threat of Substitutes
- 4.1.5. Competitive Rivalry
- 4.2. PESTEL analysis
- 4.3. BCG Analysis
- 4.3.1. Stars (High Growth, High Market Share)
- 4.3.2. Cash Cows (Low Growth, High Market Share)
- 4.3.3. Question Mark (High Growth, Low Market Share)
- 4.3.4. Dogs (Low Growth, Low Market Share)
- 4.4. Ansoff Matrix Analysis
- 4.5. Supply Chain Analysis
- 4.6. Regulatory Landscape
- 4.7. Current Market Potential and Opportunity Assessment (TAM–SAM–SOM Framework)
- 4.8. IMR Analyst Note
- 4.1. Porters Five Forces
- 5. Market Analysis, Insights and Forecast 2021-2033
- 5.1. Market Analysis, Insights and Forecast - by Product
- 5.1.1. Gaskets
- 5.1.1.1. Metallic Gasket
- 5.1.1.2. Rubber Gasket
- 5.1.1.3. Cork Gasket
- 5.1.1.4. Non-asbestos Gasket
- 5.1.1.5. Spiral Wound Gasket
- 5.1.1.6. Other Gaskets (Semi-Metallic Gasket)
- 5.1.2. Seals
- 5.1.2.1. Shaft Seals
- 5.1.2.2. Molded Seals
- 5.1.2.3. Motor Vehicle Body Seals
- 5.1.2.4. Other Seals (Fork Seal and Piston Seal)
- 5.1.1. Gaskets
- 5.2. Market Analysis, Insights and Forecast - by Material
- 5.2.1. Fiber
- 5.2.2. Graphite
- 5.2.3. PTFE
- 5.2.4. Rubber
- 5.2.5. Other Materials (Metal, Cork, Polymers and Felt)
- 5.3. Market Analysis, Insights and Forecast - by Application
- 5.3.1. Aerospace
- 5.3.2. Automotive
- 5.3.3. Electronics
- 5.3.4. Oil and Gas
- 5.3.5. Power Generation
- 5.3.6. Other Applications (Industrial)
- 5.4. Market Analysis, Insights and Forecast - by Region
- 5.4.1. Asia Pacific
- 5.4.2. North America
- 5.4.3. Europe
- 5.4.4. South America
- 5.4.5. Middle East and Africa
- 5.1. Market Analysis, Insights and Forecast - by Product
- 6. Global Seals Industry Analysis, Insights and Forecast, 2021-2033
- 6.1. Market Analysis, Insights and Forecast - by Product
- 6.1.1. Gaskets
- 6.1.1.1. Metallic Gasket
- 6.1.1.2. Rubber Gasket
- 6.1.1.3. Cork Gasket
- 6.1.1.4. Non-asbestos Gasket
- 6.1.1.5. Spiral Wound Gasket
- 6.1.1.6. Other Gaskets (Semi-Metallic Gasket)
- 6.1.2. Seals
- 6.1.2.1. Shaft Seals
- 6.1.2.2. Molded Seals
- 6.1.2.3. Motor Vehicle Body Seals
- 6.1.2.4. Other Seals (Fork Seal and Piston Seal)
- 6.1.1. Gaskets
- 6.2. Market Analysis, Insights and Forecast - by Material
- 6.2.1. Fiber
- 6.2.2. Graphite
- 6.2.3. PTFE
- 6.2.4. Rubber
- 6.2.5. Other Materials (Metal, Cork, Polymers and Felt)
- 6.3. Market Analysis, Insights and Forecast - by Application
- 6.3.1. Aerospace
- 6.3.2. Automotive
- 6.3.3. Electronics
- 6.3.4. Oil and Gas
- 6.3.5. Power Generation
- 6.3.6. Other Applications (Industrial)
- 6.1. Market Analysis, Insights and Forecast - by Product
- 7. Asia Pacific Seals Industry Analysis, Insights and Forecast, 2020-2032
- 7.1. Market Analysis, Insights and Forecast - by Product
- 7.1.1. Gaskets
- 7.1.1.1. Metallic Gasket
- 7.1.1.2. Rubber Gasket
- 7.1.1.3. Cork Gasket
- 7.1.1.4. Non-asbestos Gasket
- 7.1.1.5. Spiral Wound Gasket
- 7.1.1.6. Other Gaskets (Semi-Metallic Gasket)
- 7.1.2. Seals
- 7.1.2.1. Shaft Seals
- 7.1.2.2. Molded Seals
- 7.1.2.3. Motor Vehicle Body Seals
- 7.1.2.4. Other Seals (Fork Seal and Piston Seal)
- 7.1.1. Gaskets
- 7.2. Market Analysis, Insights and Forecast - by Material
- 7.2.1. Fiber
- 7.2.2. Graphite
- 7.2.3. PTFE
- 7.2.4. Rubber
- 7.2.5. Other Materials (Metal, Cork, Polymers and Felt)
- 7.3. Market Analysis, Insights and Forecast - by Application
- 7.3.1. Aerospace
- 7.3.2. Automotive
- 7.3.3. Electronics
- 7.3.4. Oil and Gas
- 7.3.5. Power Generation
- 7.3.6. Other Applications (Industrial)
- 7.1. Market Analysis, Insights and Forecast - by Product
- 8. North America Seals Industry Analysis, Insights and Forecast, 2020-2032
- 8.1. Market Analysis, Insights and Forecast - by Product
- 8.1.1. Gaskets
- 8.1.1.1. Metallic Gasket
- 8.1.1.2. Rubber Gasket
- 8.1.1.3. Cork Gasket
- 8.1.1.4. Non-asbestos Gasket
- 8.1.1.5. Spiral Wound Gasket
- 8.1.1.6. Other Gaskets (Semi-Metallic Gasket)
- 8.1.2. Seals
- 8.1.2.1. Shaft Seals
- 8.1.2.2. Molded Seals
- 8.1.2.3. Motor Vehicle Body Seals
- 8.1.2.4. Other Seals (Fork Seal and Piston Seal)
- 8.1.1. Gaskets
- 8.2. Market Analysis, Insights and Forecast - by Material
- 8.2.1. Fiber
- 8.2.2. Graphite
- 8.2.3. PTFE
- 8.2.4. Rubber
- 8.2.5. Other Materials (Metal, Cork, Polymers and Felt)
- 8.3. Market Analysis, Insights and Forecast - by Application
- 8.3.1. Aerospace
- 8.3.2. Automotive
- 8.3.3. Electronics
- 8.3.4. Oil and Gas
- 8.3.5. Power Generation
- 8.3.6. Other Applications (Industrial)
- 8.1. Market Analysis, Insights and Forecast - by Product
- 9. Europe Seals Industry Analysis, Insights and Forecast, 2020-2032
- 9.1. Market Analysis, Insights and Forecast - by Product
- 9.1.1. Gaskets
- 9.1.1.1. Metallic Gasket
- 9.1.1.2. Rubber Gasket
- 9.1.1.3. Cork Gasket
- 9.1.1.4. Non-asbestos Gasket
- 9.1.1.5. Spiral Wound Gasket
- 9.1.1.6. Other Gaskets (Semi-Metallic Gasket)
- 9.1.2. Seals
- 9.1.2.1. Shaft Seals
- 9.1.2.2. Molded Seals
- 9.1.2.3. Motor Vehicle Body Seals
- 9.1.2.4. Other Seals (Fork Seal and Piston Seal)
- 9.1.1. Gaskets
- 9.2. Market Analysis, Insights and Forecast - by Material
- 9.2.1. Fiber
- 9.2.2. Graphite
- 9.2.3. PTFE
- 9.2.4. Rubber
- 9.2.5. Other Materials (Metal, Cork, Polymers and Felt)
- 9.3. Market Analysis, Insights and Forecast - by Application
- 9.3.1. Aerospace
- 9.3.2. Automotive
- 9.3.3. Electronics
- 9.3.4. Oil and Gas
- 9.3.5. Power Generation
- 9.3.6. Other Applications (Industrial)
- 9.1. Market Analysis, Insights and Forecast - by Product
- 10. South America Seals Industry Analysis, Insights and Forecast, 2020-2032
- 10.1. Market Analysis, Insights and Forecast - by Product
- 10.1.1. Gaskets
- 10.1.1.1. Metallic Gasket
- 10.1.1.2. Rubber Gasket
- 10.1.1.3. Cork Gasket
- 10.1.1.4. Non-asbestos Gasket
- 10.1.1.5. Spiral Wound Gasket
- 10.1.1.6. Other Gaskets (Semi-Metallic Gasket)
- 10.1.2. Seals
- 10.1.2.1. Shaft Seals
- 10.1.2.2. Molded Seals
- 10.1.2.3. Motor Vehicle Body Seals
- 10.1.2.4. Other Seals (Fork Seal and Piston Seal)
- 10.1.1. Gaskets
- 10.2. Market Analysis, Insights and Forecast - by Material
- 10.2.1. Fiber
- 10.2.2. Graphite
- 10.2.3. PTFE
- 10.2.4. Rubber
- 10.2.5. Other Materials (Metal, Cork, Polymers and Felt)
- 10.3. Market Analysis, Insights and Forecast - by Application
- 10.3.1. Aerospace
- 10.3.2. Automotive
- 10.3.3. Electronics
- 10.3.4. Oil and Gas
- 10.3.5. Power Generation
- 10.3.6. Other Applications (Industrial)
- 10.1. Market Analysis, Insights and Forecast - by Product
- 11. Middle East and Africa Seals Industry Analysis, Insights and Forecast, 2020-2032
- 11.1. Market Analysis, Insights and Forecast - by Product
- 11.1.1. Gaskets
- 11.1.1.1. Metallic Gasket
- 11.1.1.2. Rubber Gasket
- 11.1.1.3. Cork Gasket
- 11.1.1.4. Non-asbestos Gasket
- 11.1.1.5. Spiral Wound Gasket
- 11.1.1.6. Other Gaskets (Semi-Metallic Gasket)
- 11.1.2. Seals
- 11.1.2.1. Shaft Seals
- 11.1.2.2. Molded Seals
- 11.1.2.3. Motor Vehicle Body Seals
- 11.1.2.4. Other Seals (Fork Seal and Piston Seal)
- 11.1.1. Gaskets
- 11.2. Market Analysis, Insights and Forecast - by Material
- 11.2.1. Fiber
- 11.2.2. Graphite
- 11.2.3. PTFE
- 11.2.4. Rubber
- 11.2.5. Other Materials (Metal, Cork, Polymers and Felt)
- 11.3. Market Analysis, Insights and Forecast - by Application
- 11.3.1. Aerospace
- 11.3.2. Automotive
- 11.3.3. Electronics
- 11.3.4. Oil and Gas
- 11.3.5. Power Generation
- 11.3.6. Other Applications (Industrial)
- 11.1. Market Analysis, Insights and Forecast - by Product
- 12. Competitive Analysis
- 12.1. Company Profiles
- 12.1.1 AMG Sealing Limited
- 12.1.1.1. Company Overview
- 12.1.1.2. Products
- 12.1.1.3. Company Financials
- 12.1.1.4. SWOT Analysis
- 12.1.2 Trelleborg AB
- 12.1.2.1. Company Overview
- 12.1.2.2. Products
- 12.1.2.3. Company Financials
- 12.1.2.4. SWOT Analysis
- 12.1.3 IGP Engineers Private Limited
- 12.1.3.1. Company Overview
- 12.1.3.2. Products
- 12.1.3.3. Company Financials
- 12.1.3.4. SWOT Analysis
- 12.1.4 BRUSS Sealing Systems GmbH
- 12.1.4.1. Company Overview
- 12.1.4.2. Products
- 12.1.4.3. Company Financials
- 12.1.4.4. SWOT Analysis
- 12.1.5 Flowserve Corporation
- 12.1.5.1. Company Overview
- 12.1.5.2. Products
- 12.1.5.3. Company Financials
- 12.1.5.4. SWOT Analysis
- 12.1.6 Dechengwang
- 12.1.6.1. Company Overview
- 12.1.6.2. Products
- 12.1.6.3. Company Financials
- 12.1.6.4. SWOT Analysis
- 12.1.7 Tenneco Inc *List Not Exhaustive
- 12.1.7.1. Company Overview
- 12.1.7.2. Products
- 12.1.7.3. Company Financials
- 12.1.7.4. SWOT Analysis
- 12.1.8 Phelps
- 12.1.8.1. Company Overview
- 12.1.8.2. Products
- 12.1.8.3. Company Financials
- 12.1.8.4. SWOT Analysis
- 12.1.9 SKF
- 12.1.9.1. Company Overview
- 12.1.9.2. Products
- 12.1.9.3. Company Financials
- 12.1.9.4. SWOT Analysis
- 12.1.10 Dana Limited
- 12.1.10.1. Company Overview
- 12.1.10.2. Products
- 12.1.10.3. Company Financials
- 12.1.10.4. SWOT Analysis
- 12.1.11 Smiths Group plc
- 12.1.11.1. Company Overview
- 12.1.11.2. Products
- 12.1.11.3. Company Financials
- 12.1.11.4. SWOT Analysis
- 12.1.12 Cooper Standard
- 12.1.12.1. Company Overview
- 12.1.12.2. Products
- 12.1.12.3. Company Financials
- 12.1.12.4. SWOT Analysis
- 12.1.13 Freudenberg Sealing Technologies
- 12.1.13.1. Company Overview
- 12.1.13.2. Products
- 12.1.13.3. Company Financials
- 12.1.13.4. SWOT Analysis
- 12.1.14 Dätwyler Holding Inc
- 12.1.14.1. Company Overview
- 12.1.14.2. Products
- 12.1.14.3. Company Financials
- 12.1.14.4. SWOT Analysis
- 12.1.15 ElringKlinger AG
- 12.1.15.1. Company Overview
- 12.1.15.2. Products
- 12.1.15.3. Company Financials
- 12.1.15.4. SWOT Analysis
- 12.1.16 John Crane
- 12.1.16.1. Company Overview
- 12.1.16.2. Products
- 12.1.16.3. Company Financials
- 12.1.16.4. SWOT Analysis
- 12.1.17 Garlock an Enpro Industries Inc
- 12.1.17.1. Company Overview
- 12.1.17.2. Products
- 12.1.17.3. Company Financials
- 12.1.17.4. SWOT Analysis
- 12.1.18 Saunders
- 12.1.18.1. Company Overview
- 12.1.18.2. Products
- 12.1.18.3. Company Financials
- 12.1.18.4. SWOT Analysis
- 12.1.19 KLINGER Holding GmbH
- 12.1.19.1. Company Overview
- 12.1.19.2. Products
- 12.1.19.3. Company Financials
- 12.1.19.4. SWOT Analysis
- 12.1.1 AMG Sealing Limited
- 12.2. Market Entropy
- 12.2.1 Company's Key Areas Served
- 12.2.2 Recent Developments
- 12.3. Company Market Share Analysis 2025
- 12.3.1 Top 5 Companies Market Share Analysis
- 12.3.2 Top 3 Companies Market Share Analysis
- 12.4. List of Potential Customers
- 13. Research Methodology
List of Figures
- Figure 1: Global Seals Industry Revenue Breakdown (Million, %) by Region 2025 & 2033
- Figure 2: Asia Pacific Seals Industry Revenue (Million), by Product 2025 & 2033
- Figure 3: Asia Pacific Seals Industry Revenue Share (%), by Product 2025 & 2033
- Figure 4: Asia Pacific Seals Industry Revenue (Million), by Material 2025 & 2033
- Figure 5: Asia Pacific Seals Industry Revenue Share (%), by Material 2025 & 2033
- Figure 6: Asia Pacific Seals Industry Revenue (Million), by Application 2025 & 2033
- Figure 7: Asia Pacific Seals Industry Revenue Share (%), by Application 2025 & 2033
- Figure 8: Asia Pacific Seals Industry Revenue (Million), by Country 2025 & 2033
- Figure 9: Asia Pacific Seals Industry Revenue Share (%), by Country 2025 & 2033
- Figure 10: North America Seals Industry Revenue (Million), by Product 2025 & 2033
- Figure 11: North America Seals Industry Revenue Share (%), by Product 2025 & 2033
- Figure 12: North America Seals Industry Revenue (Million), by Material 2025 & 2033
- Figure 13: North America Seals Industry Revenue Share (%), by Material 2025 & 2033
- Figure 14: North America Seals Industry Revenue (Million), by Application 2025 & 2033
- Figure 15: North America Seals Industry Revenue Share (%), by Application 2025 & 2033
- Figure 16: North America Seals Industry Revenue (Million), by Country 2025 & 2033
- Figure 17: North America Seals Industry Revenue Share (%), by Country 2025 & 2033
- Figure 18: Europe Seals Industry Revenue (Million), by Product 2025 & 2033
- Figure 19: Europe Seals Industry Revenue Share (%), by Product 2025 & 2033
- Figure 20: Europe Seals Industry Revenue (Million), by Material 2025 & 2033
- Figure 21: Europe Seals Industry Revenue Share (%), by Material 2025 & 2033
- Figure 22: Europe Seals Industry Revenue (Million), by Application 2025 & 2033
- Figure 23: Europe Seals Industry Revenue Share (%), by Application 2025 & 2033
- Figure 24: Europe Seals Industry Revenue (Million), by Country 2025 & 2033
- Figure 25: Europe Seals Industry Revenue Share (%), by Country 2025 & 2033
- Figure 26: South America Seals Industry Revenue (Million), by Product 2025 & 2033
- Figure 27: South America Seals Industry Revenue Share (%), by Product 2025 & 2033
- Figure 28: South America Seals Industry Revenue (Million), by Material 2025 & 2033
- Figure 29: South America Seals Industry Revenue Share (%), by Material 2025 & 2033
- Figure 30: South America Seals Industry Revenue (Million), by Application 2025 & 2033
- Figure 31: South America Seals Industry Revenue Share (%), by Application 2025 & 2033
- Figure 32: South America Seals Industry Revenue (Million), by Country 2025 & 2033
- Figure 33: South America Seals Industry Revenue Share (%), by Country 2025 & 2033
- Figure 34: Middle East and Africa Seals Industry Revenue (Million), by Product 2025 & 2033
- Figure 35: Middle East and Africa Seals Industry Revenue Share (%), by Product 2025 & 2033
- Figure 36: Middle East and Africa Seals Industry Revenue (Million), by Material 2025 & 2033
- Figure 37: Middle East and Africa Seals Industry Revenue Share (%), by Material 2025 & 2033
- Figure 38: Middle East and Africa Seals Industry Revenue (Million), by Application 2025 & 2033
- Figure 39: Middle East and Africa Seals Industry Revenue Share (%), by Application 2025 & 2033
- Figure 40: Middle East and Africa Seals Industry Revenue (Million), by Country 2025 & 2033
- Figure 41: Middle East and Africa Seals Industry Revenue Share (%), by Country 2025 & 2033
List of Tables
- Table 1: Global Seals Industry Revenue Million Forecast, by Product 2020 & 2033
- Table 2: Global Seals Industry Revenue Million Forecast, by Material 2020 & 2033
- Table 3: Global Seals Industry Revenue Million Forecast, by Application 2020 & 2033
- Table 4: Global Seals Industry Revenue Million Forecast, by Region 2020 & 2033
- Table 5: Global Seals Industry Revenue Million Forecast, by Product 2020 & 2033
- Table 6: Global Seals Industry Revenue Million Forecast, by Material 2020 & 2033
- Table 7: Global Seals Industry Revenue Million Forecast, by Application 2020 & 2033
- Table 8: Global Seals Industry Revenue Million Forecast, by Country 2020 & 2033
- Table 9: China Seals Industry Revenue (Million) Forecast, by Application 2020 & 2033
- Table 10: India Seals Industry Revenue (Million) Forecast, by Application 2020 & 2033
- Table 11: Japan Seals Industry Revenue (Million) Forecast, by Application 2020 & 2033
- Table 12: South Korea Seals Industry Revenue (Million) Forecast, by Application 2020 & 2033
- Table 13: Rest of Asia Pacific Seals Industry Revenue (Million) Forecast, by Application 2020 & 2033
- Table 14: Global Seals Industry Revenue Million Forecast, by Product 2020 & 2033
- Table 15: Global Seals Industry Revenue Million Forecast, by Material 2020 & 2033
- Table 16: Global Seals Industry Revenue Million Forecast, by Application 2020 & 2033
- Table 17: Global Seals Industry Revenue Million Forecast, by Country 2020 & 2033
- Table 18: United States Seals Industry Revenue (Million) Forecast, by Application 2020 & 2033
- Table 19: Canada Seals Industry Revenue (Million) Forecast, by Application 2020 & 2033
- Table 20: Mexico Seals Industry Revenue (Million) Forecast, by Application 2020 & 2033
- Table 21: Global Seals Industry Revenue Million Forecast, by Product 2020 & 2033
- Table 22: Global Seals Industry Revenue Million Forecast, by Material 2020 & 2033
- Table 23: Global Seals Industry Revenue Million Forecast, by Application 2020 & 2033
- Table 24: Global Seals Industry Revenue Million Forecast, by Country 2020 & 2033
- Table 25: Germany Seals Industry Revenue (Million) Forecast, by Application 2020 & 2033
- Table 26: United Kingdom Seals Industry Revenue (Million) Forecast, by Application 2020 & 2033
- Table 27: France Seals Industry Revenue (Million) Forecast, by Application 2020 & 2033
- Table 28: Italy Seals Industry Revenue (Million) Forecast, by Application 2020 & 2033
- Table 29: Rest of Europe Seals Industry Revenue (Million) Forecast, by Application 2020 & 2033
- Table 30: Global Seals Industry Revenue Million Forecast, by Product 2020 & 2033
- Table 31: Global Seals Industry Revenue Million Forecast, by Material 2020 & 2033
- Table 32: Global Seals Industry Revenue Million Forecast, by Application 2020 & 2033
- Table 33: Global Seals Industry Revenue Million Forecast, by Country 2020 & 2033
- Table 34: Brazil Seals Industry Revenue (Million) Forecast, by Application 2020 & 2033
- Table 35: Argentina Seals Industry Revenue (Million) Forecast, by Application 2020 & 2033
- Table 36: Rest of South America Seals Industry Revenue (Million) Forecast, by Application 2020 & 2033
- Table 37: Global Seals Industry Revenue Million Forecast, by Product 2020 & 2033
- Table 38: Global Seals Industry Revenue Million Forecast, by Material 2020 & 2033
- Table 39: Global Seals Industry Revenue Million Forecast, by Application 2020 & 2033
- Table 40: Global Seals Industry Revenue Million Forecast, by Country 2020 & 2033
- Table 41: Saudi Arabia Seals Industry Revenue (Million) Forecast, by Application 2020 & 2033
- Table 42: South Africa Seals Industry Revenue (Million) Forecast, by Application 2020 & 2033
- Table 43: Rest of Middle East and Africa Seals Industry Revenue (Million) Forecast, by Application 2020 & 2033
Frequently Asked Questions
1. What is the projected Compound Annual Growth Rate (CAGR) of the Seals Industry?
The projected CAGR is approximately > 4.00%.
2. Which companies are prominent players in the Seals Industry?
Key companies in the market include AMG Sealing Limited, Trelleborg AB, IGP Engineers Private Limited, BRUSS Sealing Systems GmbH, Flowserve Corporation, Dechengwang, Tenneco Inc *List Not Exhaustive, Phelps, SKF, Dana Limited, Smiths Group plc, Cooper Standard, Freudenberg Sealing Technologies, Dätwyler Holding Inc, ElringKlinger AG, John Crane, Garlock an Enpro Industries Inc, Saunders, KLINGER Holding GmbH.
3. What are the main segments of the Seals Industry?
The market segments include Product, Material, Application.
4. Can you provide details about the market size?
The market size is estimated to be USD 72.95 Million as of 2022.
5. What are some drivers contributing to market growth?
Increase in the Use of Gaskets and Seals in the Oil and Gas Industry; Growing Demand from the Chemical and Petrochemical Sectors; Increasing Demand from the Automotive Industry.
6. What are the notable trends driving market growth?
The Oil and Gas Application is Expected to Dominate the Market.
7. Are there any restraints impacting market growth?
Regular Maintenance and Lubrication; Price Volatility of Raw Materials.
8. Can you provide examples of recent developments in the market?
N/A
9. What pricing options are available for accessing the report?
Pricing options include single-user, multi-user, and enterprise licenses priced at USD 4750, USD 5250, and USD 8750 respectively.
10. Is the market size provided in terms of value or volume?
The market size is provided in terms of value, measured in Million.
11. Are there any specific market keywords associated with the report?
Yes, the market keyword associated with the report is "Seals Industry," which aids in identifying and referencing the specific market segment covered.
12. How do I determine which pricing option suits my needs best?
The pricing options vary based on user requirements and access needs. Individual users may opt for single-user licenses, while businesses requiring broader access may choose multi-user or enterprise licenses for cost-effective access to the report.
13. Are there any additional resources or data provided in the Seals Industry report?
While the report offers comprehensive insights, it's advisable to review the specific contents or supplementary materials provided to ascertain if additional resources or data are available.
14. How can I stay updated on further developments or reports in the Seals Industry?
To stay informed about further developments, trends, and reports in the Seals Industry, consider subscribing to industry newsletters, following relevant companies and organizations, or regularly checking reputable industry news sources and publications.
Methodology
Step 1 - Identification of Relevant Samples Size from Population Database


Step 2 - Approaches for Defining Global Market Size (Value, Volume* & Price*)

Note*: In applicable scenarios
Step 3 - Data Sources
Primary Research
- Web Analytics
- Survey Reports
- Research Institute
- Latest Research Reports
- Opinion Leaders
Secondary Research
- Annual Reports
- White Paper
- Latest Press Release
- Industry Association
- Paid Database
- Investor Presentations

Step 4 - Data Triangulation
Involves using different sources of information in order to increase the validity of a study
These sources are likely to be stakeholders in a program - participants, other researchers, program staff, other community members, and so on.
Then we put all data in single framework & apply various statistical tools to find out the dynamic on the market.
During the analysis stage, feedback from the stakeholder groups would be compared to determine areas of agreement as well as areas of divergence