

Key Insights
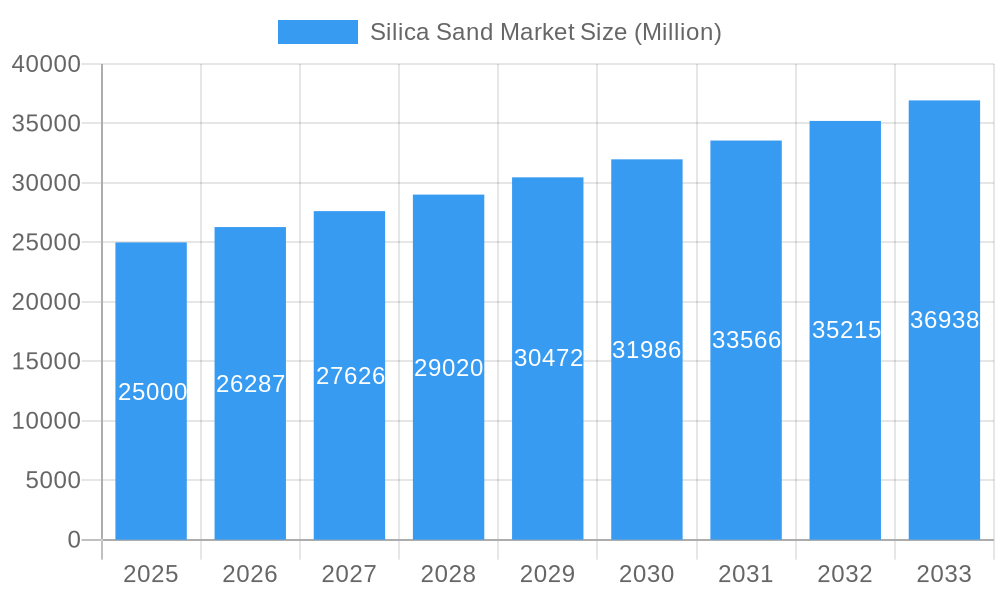
The global silica sand market is projected for significant expansion, driven by its indispensable role in key industries. With a Compound Annual Growth Rate (CAGR) of 4.7% from 2025 to 2033, the market is estimated to reach 25.4 billion by 2033. This growth is primarily propelled by the booming construction and infrastructure sectors, where silica sand is a fundamental material for concrete, mortar, and building composites. The escalating demand for glass in automotive and electronics applications further fuels market expansion. Moreover, the widespread adoption of hydraulic fracturing in oil and gas exploration necessitates substantial silica sand volumes as a proppant, a major growth driver. Advancements in silica sand processing and purification technologies are enhancing product quality and efficiency, broadening its application spectrum. While environmental regulations pose challenges, the market outlook remains robust with consistent growth anticipated across diverse geographic regions.
Silica Sand Market Market Size (In Billion)
Market constraints include volatility in raw material and energy costs impacting production economics. The geographic concentration of silica sand deposits presents logistical hurdles, affecting transportation expenses and accessibility. Intense competition among established entities and new market entrants underscores the need for continuous innovation and operational efficiency to secure market share. Notwithstanding these challenges, the long-term growth trajectory is positive, supported by sustained demand from core industries and emerging opportunities in advanced materials and nanotechnology. Key industry players such as Badger Mining Corporation, U.S. Silica, and Sibelco are strategically positioned to capitalize on these growth prospects through their market presence and technological expertise. Detailed regional analyses will further illuminate market dynamics influenced by infrastructure development, industrial activity, and local regulatory environments.
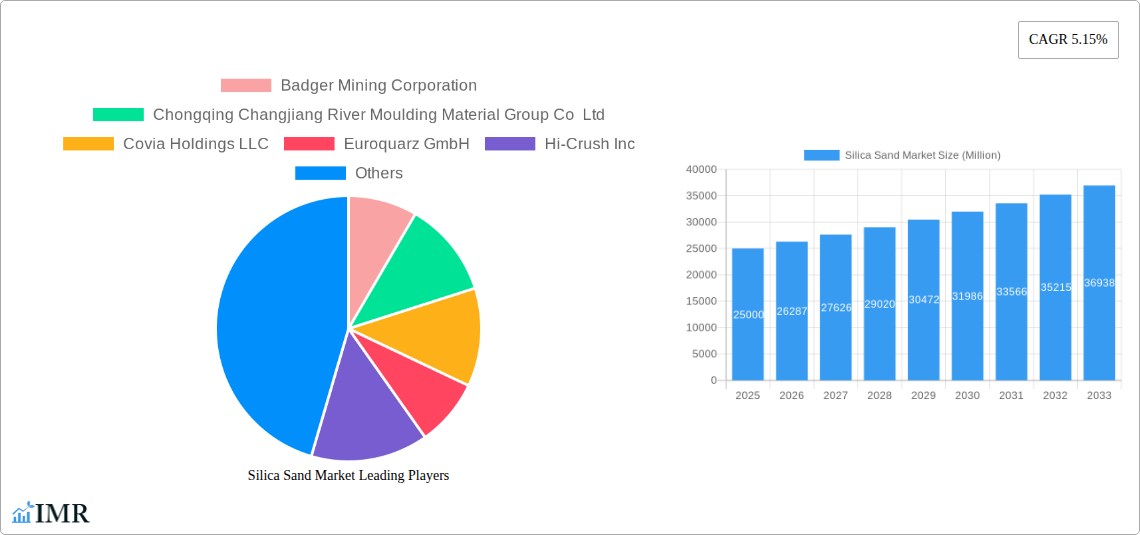
Silica Sand Market Company Market Share
Silica Sand Market: A Comprehensive Report (2019-2033)
This comprehensive report provides a detailed analysis of the global Silica Sand market, encompassing market dynamics, growth trends, regional dominance, product landscape, key players, and future outlook. The report covers the historical period (2019-2024), base year (2025), and forecast period (2025-2033), offering valuable insights for industry professionals, investors, and strategic decision-makers. The market is segmented by application (e.g., glass manufacturing, construction, foundry) and geography. The total market size is estimated to reach xx Million by 2033.
Silica Sand Market Dynamics & Structure
The global silica sand market exhibits a moderately concentrated structure with several major players holding significant market share. Technological advancements, particularly in processing and purification techniques, are key drivers, while stringent environmental regulations and the availability of substitute materials pose challenges. The market is influenced by fluctuating raw material prices and the construction and industrial sectors’ demand. Mergers and acquisitions (M&A) activity is significant, as evidenced by recent deals like Sibelco’s acquisition of EchasaSA.
- Market Concentration: Moderately concentrated, with top 5 players holding approximately xx% market share in 2024.
- Technological Innovation: Focus on enhanced purity, consistent particle size distribution, and sustainable extraction methods.
- Regulatory Framework: Stringent environmental regulations impact extraction and processing operations, influencing costs.
- Competitive Substitutes: Other construction materials and alternative glass components present competitive pressure.
- End-User Demographics: Driven by robust growth in construction, glass manufacturing, and the foundry industry.
- M&A Trends: Increasing consolidation through acquisitions and strategic partnerships to enhance market share and access resources. Deal volume increased by xx% between 2021 and 2022.
Silica Sand Market Growth Trends & Insights
The silica sand market is experiencing steady growth, driven primarily by the increasing demand from the construction, glass manufacturing, and foundry sectors. The market is characterized by a fluctuating supply chain impacted by geopolitical events and raw material prices. Technological advancements leading to higher-quality silica sand are propelling growth. Consumer preference for sustainable materials is also shaping the market landscape, driving demand for ethically sourced and environmentally friendly silica sand. The CAGR for the forecast period (2025-2033) is projected at xx%, with market penetration in emerging economies expected to increase significantly. Specific details on adoption rates and technological disruptions are included in the full report.
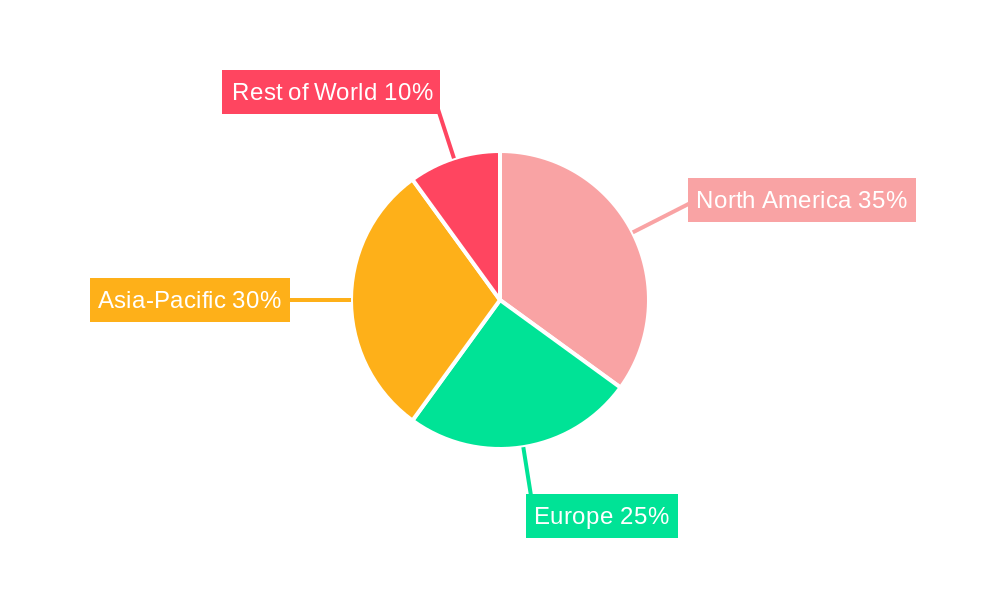
Dominant Regions, Countries, or Segments in Silica Sand Market
The Asia-Pacific region is currently the dominant market for silica sand, driven by rapid infrastructural development and industrial growth in countries like China and India. North America and Europe also hold significant market shares, with growth influenced by the construction sector and specific technological advancements in silica sand applications.
- Asia-Pacific: Strong growth driven by construction boom and industrial expansion. Key drivers include increasing government investment in infrastructure projects and robust economic growth.
- North America: Steady growth fueled by the construction and glass industries, benefiting from established infrastructure and technological innovation.
- Europe: Moderate growth, influenced by stricter environmental regulations and economic factors.
- Other Regions: Emerging markets in South America, Africa, and the Middle East present significant growth potential.
Silica Sand Market Product Landscape
The silica sand market offers a diverse range of products tailored to specific applications. Innovations focus on enhancing purity, particle size consistency, and surface area, improving product performance in various end-uses. Technological advancements, such as improved processing techniques and surface modification methods, are creating unique selling propositions.
Key Drivers, Barriers & Challenges in Silica Sand Market
Key Drivers:
- Increasing demand from the construction and glass industries.
- Technological advancements in silica sand processing and purification.
- Growing infrastructural development in emerging economies.
Key Challenges:
- Fluctuating raw material prices and supply chain disruptions.
- Stringent environmental regulations and associated compliance costs.
- Intense competition among established players and the emergence of new entrants. This pressure results in approximately xx% reduction in average profit margins from 2020 to 2024.
Emerging Opportunities in Silica Sand Market
- Growing demand for high-purity silica sand in specialized applications like electronics and solar energy.
- Expansion into untapped markets in developing regions.
- Development of sustainable and eco-friendly silica sand extraction and processing methods.
Growth Accelerators in the Silica Sand Market Industry
Technological breakthroughs in processing and purification techniques, coupled with strategic partnerships to secure raw material supplies and expand market reach, are key growth accelerators. Furthermore, focused investment in research and development of advanced silica sand applications in high-growth industries will drive market expansion.
Key Players Shaping the Silica Sand Market Market
- Badger Mining Corporation
- Chongqing Changjiang River Moulding Material Group Co Ltd
- Covia Holdings LLC
- Euroquarz GmbH
- Hi-Crush Inc
- JFE Mineral & Alloy Company Ltd
- Mitsubishi Corporation
- PUM GROUP
- Sibelco
- Sil Industrial Minerals
- Source Energy Services
- Superior Silica Sands
- Tochu Corporation
- U S Silica
- *List Not Exhaustive
Notable Milestones in Silica Sand Market Sector
- July 2022: Sibelco acquired EchasaSA, expanding its silica sand production capacity in Spain.
- April 2022: Source Energy Services increased its frac sand production by 400,000 metric tons.
In-Depth Silica Sand Market Market Outlook
The silica sand market is poised for continued growth, driven by technological advancements, expanding applications in diverse industries, and increased infrastructure development globally. Strategic partnerships and acquisitions will further shape market dynamics, creating opportunities for both established players and new entrants. The long-term potential for growth is substantial, particularly in emerging economies and specialized applications.
Silica Sand Market Segmentation
-
1. End-user Industry
- 1.1. Glass Manufacturing
- 1.2. Foundry
- 1.3. Chemical Production
- 1.4. Construction
- 1.5. Paints and Coatings
- 1.6. Ceramics and Refractories
- 1.7. Filtration
- 1.8. Oil and Gas
- 1.9. Other End-user Industries
Silica Sand Market Segmentation By Geography
-
1. Asia Pacific
- 1.1. China
- 1.2. India
- 1.3. Japan
- 1.4. South Korea
- 1.5. Rest of Asia Pacific
-
2. North America
- 2.1. United States
- 2.2. Canada
- 2.3. Mexico
-
3. Europe
- 3.1. Germany
- 3.2. United Kingdom
- 3.3. Italy
- 3.4. France
- 3.5. Rest of Europe
-
4. South America
- 4.1. Brazil
- 4.2. Argentina
- 4.3. Rest of South America
-
5. Middle East and Africa
- 5.1. Saudi Arabia
- 5.2. South Africa
- 5.3. Rest of Middle East and Africa
Silica Sand Market Regional Market Share
Geographic Coverage of Silica Sand Market
Silica Sand Market REPORT HIGHLIGHTS
| Aspects | Details |
|---|---|
| Study Period | 2020-2034 |
| Base Year | 2025 |
| Estimated Year | 2026 |
| Forecast Period | 2026-2034 |
| Historical Period | 2020-2025 |
| Growth Rate | CAGR of 4.7% from 2020-2034 |
| Segmentation |
|
Table of Contents
- 1. Introduction
- 1.1. Research Scope
- 1.2. Market Segmentation
- 1.3. Research Objective
- 1.4. Definitions and Assumptions
- 2. Executive Summary
- 2.1. Market Snapshot
- 3. Market Dynamics
- 3.1. Market Drivers
- 3.2. Market Restrains
- 3.3. Market Trends
- 3.4. Market Opportunities
- 4. Market Factor Analysis
- 4.1. Porters Five Forces
- 4.1.1. Bargaining Power of Suppliers
- 4.1.2. Bargaining Power of Buyers
- 4.1.3. Threat of New Entrants
- 4.1.4. Threat of Substitutes
- 4.1.5. Competitive Rivalry
- 4.2. PESTEL analysis
- 4.3. BCG Analysis
- 4.3.1. Stars (High Growth, High Market Share)
- 4.3.2. Cash Cows (Low Growth, High Market Share)
- 4.3.3. Question Mark (High Growth, Low Market Share)
- 4.3.4. Dogs (Low Growth, Low Market Share)
- 4.4. Ansoff Matrix Analysis
- 4.5. Supply Chain Analysis
- 4.6. Regulatory Landscape
- 4.7. Current Market Potential and Opportunity Assessment (TAM–SAM–SOM Framework)
- 4.8. IMR Analyst Note
- 4.1. Porters Five Forces
- 5. Market Analysis, Insights and Forecast 2021-2033
- 5.1. Market Analysis, Insights and Forecast - by End-user Industry
- 5.1.1. Glass Manufacturing
- 5.1.2. Foundry
- 5.1.3. Chemical Production
- 5.1.4. Construction
- 5.1.5. Paints and Coatings
- 5.1.6. Ceramics and Refractories
- 5.1.7. Filtration
- 5.1.8. Oil and Gas
- 5.1.9. Other End-user Industries
- 5.2. Market Analysis, Insights and Forecast - by Region
- 5.2.1. Asia Pacific
- 5.2.2. North America
- 5.2.3. Europe
- 5.2.4. South America
- 5.2.5. Middle East and Africa
- 5.1. Market Analysis, Insights and Forecast - by End-user Industry
- 6. Global Silica Sand Market Analysis, Insights and Forecast, 2021-2033
- 6.1. Market Analysis, Insights and Forecast - by End-user Industry
- 6.1.1. Glass Manufacturing
- 6.1.2. Foundry
- 6.1.3. Chemical Production
- 6.1.4. Construction
- 6.1.5. Paints and Coatings
- 6.1.6. Ceramics and Refractories
- 6.1.7. Filtration
- 6.1.8. Oil and Gas
- 6.1.9. Other End-user Industries
- 6.1. Market Analysis, Insights and Forecast - by End-user Industry
- 7. Asia Pacific Silica Sand Market Analysis, Insights and Forecast, 2020-2032
- 7.1. Market Analysis, Insights and Forecast - by End-user Industry
- 7.1.1. Glass Manufacturing
- 7.1.2. Foundry
- 7.1.3. Chemical Production
- 7.1.4. Construction
- 7.1.5. Paints and Coatings
- 7.1.6. Ceramics and Refractories
- 7.1.7. Filtration
- 7.1.8. Oil and Gas
- 7.1.9. Other End-user Industries
- 7.1. Market Analysis, Insights and Forecast - by End-user Industry
- 8. North America Silica Sand Market Analysis, Insights and Forecast, 2020-2032
- 8.1. Market Analysis, Insights and Forecast - by End-user Industry
- 8.1.1. Glass Manufacturing
- 8.1.2. Foundry
- 8.1.3. Chemical Production
- 8.1.4. Construction
- 8.1.5. Paints and Coatings
- 8.1.6. Ceramics and Refractories
- 8.1.7. Filtration
- 8.1.8. Oil and Gas
- 8.1.9. Other End-user Industries
- 8.1. Market Analysis, Insights and Forecast - by End-user Industry
- 9. Europe Silica Sand Market Analysis, Insights and Forecast, 2020-2032
- 9.1. Market Analysis, Insights and Forecast - by End-user Industry
- 9.1.1. Glass Manufacturing
- 9.1.2. Foundry
- 9.1.3. Chemical Production
- 9.1.4. Construction
- 9.1.5. Paints and Coatings
- 9.1.6. Ceramics and Refractories
- 9.1.7. Filtration
- 9.1.8. Oil and Gas
- 9.1.9. Other End-user Industries
- 9.1. Market Analysis, Insights and Forecast - by End-user Industry
- 10. South America Silica Sand Market Analysis, Insights and Forecast, 2020-2032
- 10.1. Market Analysis, Insights and Forecast - by End-user Industry
- 10.1.1. Glass Manufacturing
- 10.1.2. Foundry
- 10.1.3. Chemical Production
- 10.1.4. Construction
- 10.1.5. Paints and Coatings
- 10.1.6. Ceramics and Refractories
- 10.1.7. Filtration
- 10.1.8. Oil and Gas
- 10.1.9. Other End-user Industries
- 10.1. Market Analysis, Insights and Forecast - by End-user Industry
- 11. Middle East and Africa Silica Sand Market Analysis, Insights and Forecast, 2020-2032
- 11.1. Market Analysis, Insights and Forecast - by End-user Industry
- 11.1.1. Glass Manufacturing
- 11.1.2. Foundry
- 11.1.3. Chemical Production
- 11.1.4. Construction
- 11.1.5. Paints and Coatings
- 11.1.6. Ceramics and Refractories
- 11.1.7. Filtration
- 11.1.8. Oil and Gas
- 11.1.9. Other End-user Industries
- 11.1. Market Analysis, Insights and Forecast - by End-user Industry
- 12. Competitive Analysis
- 12.1. Company Profiles
- 12.1.1 Badger Mining Corporation
- 12.1.1.1. Company Overview
- 12.1.1.2. Products
- 12.1.1.3. Company Financials
- 12.1.1.4. SWOT Analysis
- 12.1.2 Chongqing Changjiang River Moulding Material Group Co Ltd
- 12.1.2.1. Company Overview
- 12.1.2.2. Products
- 12.1.2.3. Company Financials
- 12.1.2.4. SWOT Analysis
- 12.1.3 Covia Holdings LLC
- 12.1.3.1. Company Overview
- 12.1.3.2. Products
- 12.1.3.3. Company Financials
- 12.1.3.4. SWOT Analysis
- 12.1.4 Euroquarz GmbH
- 12.1.4.1. Company Overview
- 12.1.4.2. Products
- 12.1.4.3. Company Financials
- 12.1.4.4. SWOT Analysis
- 12.1.5 Hi-Crush Inc
- 12.1.5.1. Company Overview
- 12.1.5.2. Products
- 12.1.5.3. Company Financials
- 12.1.5.4. SWOT Analysis
- 12.1.6 JFE Mineral & Alloy Company Ltd
- 12.1.6.1. Company Overview
- 12.1.6.2. Products
- 12.1.6.3. Company Financials
- 12.1.6.4. SWOT Analysis
- 12.1.7 Mitsubishi Corporation
- 12.1.7.1. Company Overview
- 12.1.7.2. Products
- 12.1.7.3. Company Financials
- 12.1.7.4. SWOT Analysis
- 12.1.8 PUM GROUP
- 12.1.8.1. Company Overview
- 12.1.8.2. Products
- 12.1.8.3. Company Financials
- 12.1.8.4. SWOT Analysis
- 12.1.9 Sibelco
- 12.1.9.1. Company Overview
- 12.1.9.2. Products
- 12.1.9.3. Company Financials
- 12.1.9.4. SWOT Analysis
- 12.1.10 Sil Industrial Minerals
- 12.1.10.1. Company Overview
- 12.1.10.2. Products
- 12.1.10.3. Company Financials
- 12.1.10.4. SWOT Analysis
- 12.1.11 Source Energy Services
- 12.1.11.1. Company Overview
- 12.1.11.2. Products
- 12.1.11.3. Company Financials
- 12.1.11.4. SWOT Analysis
- 12.1.12 Superior Silica Sands
- 12.1.12.1. Company Overview
- 12.1.12.2. Products
- 12.1.12.3. Company Financials
- 12.1.12.4. SWOT Analysis
- 12.1.13 Tochu Corporation
- 12.1.13.1. Company Overview
- 12.1.13.2. Products
- 12.1.13.3. Company Financials
- 12.1.13.4. SWOT Analysis
- 12.1.14 U S Silica*List Not Exhaustive
- 12.1.14.1. Company Overview
- 12.1.14.2. Products
- 12.1.14.3. Company Financials
- 12.1.14.4. SWOT Analysis
- 12.1.1 Badger Mining Corporation
- 12.2. Market Entropy
- 12.2.1 Company's Key Areas Served
- 12.2.2 Recent Developments
- 12.3. Company Market Share Analysis 2025
- 12.3.1 Top 5 Companies Market Share Analysis
- 12.3.2 Top 3 Companies Market Share Analysis
- 12.4. List of Potential Customers
- 13. Research Methodology
List of Figures
- Figure 1: Global Silica Sand Market Revenue Breakdown (billion, %) by Region 2025 & 2033
- Figure 2: Asia Pacific Silica Sand Market Revenue (billion), by End-user Industry 2025 & 2033
- Figure 3: Asia Pacific Silica Sand Market Revenue Share (%), by End-user Industry 2025 & 2033
- Figure 4: Asia Pacific Silica Sand Market Revenue (billion), by Country 2025 & 2033
- Figure 5: Asia Pacific Silica Sand Market Revenue Share (%), by Country 2025 & 2033
- Figure 6: North America Silica Sand Market Revenue (billion), by End-user Industry 2025 & 2033
- Figure 7: North America Silica Sand Market Revenue Share (%), by End-user Industry 2025 & 2033
- Figure 8: North America Silica Sand Market Revenue (billion), by Country 2025 & 2033
- Figure 9: North America Silica Sand Market Revenue Share (%), by Country 2025 & 2033
- Figure 10: Europe Silica Sand Market Revenue (billion), by End-user Industry 2025 & 2033
- Figure 11: Europe Silica Sand Market Revenue Share (%), by End-user Industry 2025 & 2033
- Figure 12: Europe Silica Sand Market Revenue (billion), by Country 2025 & 2033
- Figure 13: Europe Silica Sand Market Revenue Share (%), by Country 2025 & 2033
- Figure 14: South America Silica Sand Market Revenue (billion), by End-user Industry 2025 & 2033
- Figure 15: South America Silica Sand Market Revenue Share (%), by End-user Industry 2025 & 2033
- Figure 16: South America Silica Sand Market Revenue (billion), by Country 2025 & 2033
- Figure 17: South America Silica Sand Market Revenue Share (%), by Country 2025 & 2033
- Figure 18: Middle East and Africa Silica Sand Market Revenue (billion), by End-user Industry 2025 & 2033
- Figure 19: Middle East and Africa Silica Sand Market Revenue Share (%), by End-user Industry 2025 & 2033
- Figure 20: Middle East and Africa Silica Sand Market Revenue (billion), by Country 2025 & 2033
- Figure 21: Middle East and Africa Silica Sand Market Revenue Share (%), by Country 2025 & 2033
List of Tables
- Table 1: Global Silica Sand Market Revenue billion Forecast, by End-user Industry 2020 & 2033
- Table 2: Global Silica Sand Market Revenue billion Forecast, by Region 2020 & 2033
- Table 3: Global Silica Sand Market Revenue billion Forecast, by End-user Industry 2020 & 2033
- Table 4: Global Silica Sand Market Revenue billion Forecast, by Country 2020 & 2033
- Table 5: China Silica Sand Market Revenue (billion) Forecast, by Application 2020 & 2033
- Table 6: India Silica Sand Market Revenue (billion) Forecast, by Application 2020 & 2033
- Table 7: Japan Silica Sand Market Revenue (billion) Forecast, by Application 2020 & 2033
- Table 8: South Korea Silica Sand Market Revenue (billion) Forecast, by Application 2020 & 2033
- Table 9: Rest of Asia Pacific Silica Sand Market Revenue (billion) Forecast, by Application 2020 & 2033
- Table 10: Global Silica Sand Market Revenue billion Forecast, by End-user Industry 2020 & 2033
- Table 11: Global Silica Sand Market Revenue billion Forecast, by Country 2020 & 2033
- Table 12: United States Silica Sand Market Revenue (billion) Forecast, by Application 2020 & 2033
- Table 13: Canada Silica Sand Market Revenue (billion) Forecast, by Application 2020 & 2033
- Table 14: Mexico Silica Sand Market Revenue (billion) Forecast, by Application 2020 & 2033
- Table 15: Global Silica Sand Market Revenue billion Forecast, by End-user Industry 2020 & 2033
- Table 16: Global Silica Sand Market Revenue billion Forecast, by Country 2020 & 2033
- Table 17: Germany Silica Sand Market Revenue (billion) Forecast, by Application 2020 & 2033
- Table 18: United Kingdom Silica Sand Market Revenue (billion) Forecast, by Application 2020 & 2033
- Table 19: Italy Silica Sand Market Revenue (billion) Forecast, by Application 2020 & 2033
- Table 20: France Silica Sand Market Revenue (billion) Forecast, by Application 2020 & 2033
- Table 21: Rest of Europe Silica Sand Market Revenue (billion) Forecast, by Application 2020 & 2033
- Table 22: Global Silica Sand Market Revenue billion Forecast, by End-user Industry 2020 & 2033
- Table 23: Global Silica Sand Market Revenue billion Forecast, by Country 2020 & 2033
- Table 24: Brazil Silica Sand Market Revenue (billion) Forecast, by Application 2020 & 2033
- Table 25: Argentina Silica Sand Market Revenue (billion) Forecast, by Application 2020 & 2033
- Table 26: Rest of South America Silica Sand Market Revenue (billion) Forecast, by Application 2020 & 2033
- Table 27: Global Silica Sand Market Revenue billion Forecast, by End-user Industry 2020 & 2033
- Table 28: Global Silica Sand Market Revenue billion Forecast, by Country 2020 & 2033
- Table 29: Saudi Arabia Silica Sand Market Revenue (billion) Forecast, by Application 2020 & 2033
- Table 30: South Africa Silica Sand Market Revenue (billion) Forecast, by Application 2020 & 2033
- Table 31: Rest of Middle East and Africa Silica Sand Market Revenue (billion) Forecast, by Application 2020 & 2033
Frequently Asked Questions
1. What is the projected Compound Annual Growth Rate (CAGR) of the Silica Sand Market?
The projected CAGR is approximately 4.7%.
2. Which companies are prominent players in the Silica Sand Market?
Key companies in the market include Badger Mining Corporation, Chongqing Changjiang River Moulding Material Group Co Ltd, Covia Holdings LLC, Euroquarz GmbH, Hi-Crush Inc, JFE Mineral & Alloy Company Ltd, Mitsubishi Corporation, PUM GROUP, Sibelco, Sil Industrial Minerals, Source Energy Services, Superior Silica Sands, Tochu Corporation, U S Silica*List Not Exhaustive.
3. What are the main segments of the Silica Sand Market?
The market segments include End-user Industry.
4. Can you provide details about the market size?
The market size is estimated to be USD 25.4 billion as of 2022.
5. What are some drivers contributing to market growth?
Increasing Demand from the Foundry Industry; Growing Demand from the Glass Industry.
6. What are the notable trends driving market growth?
Oil and Gas Industry to Dominate the Market.
7. Are there any restraints impacting market growth?
Increasing Demand from the Foundry Industry; Growing Demand from the Glass Industry.
8. Can you provide examples of recent developments in the market?
July 2022: Sibelco acquired EchasaSA, a mining company that mines silica sand from the Laminoriaquarry near Vitoria in the Basque Country in northern Spain, 160 kilometers from Sibelco's nearest silica sand quarry in Ariya.
9. What pricing options are available for accessing the report?
Pricing options include single-user, multi-user, and enterprise licenses priced at USD 4750, USD 5250, and USD 8750 respectively.
10. Is the market size provided in terms of value or volume?
The market size is provided in terms of value, measured in billion.
11. Are there any specific market keywords associated with the report?
Yes, the market keyword associated with the report is "Silica Sand Market," which aids in identifying and referencing the specific market segment covered.
12. How do I determine which pricing option suits my needs best?
The pricing options vary based on user requirements and access needs. Individual users may opt for single-user licenses, while businesses requiring broader access may choose multi-user or enterprise licenses for cost-effective access to the report.
13. Are there any additional resources or data provided in the Silica Sand Market report?
While the report offers comprehensive insights, it's advisable to review the specific contents or supplementary materials provided to ascertain if additional resources or data are available.
14. How can I stay updated on further developments or reports in the Silica Sand Market?
To stay informed about further developments, trends, and reports in the Silica Sand Market, consider subscribing to industry newsletters, following relevant companies and organizations, or regularly checking reputable industry news sources and publications.
Methodology
Step 1 - Identification of Relevant Samples Size from Population Database


Step 2 - Approaches for Defining Global Market Size (Value, Volume* & Price*)

Note*: In applicable scenarios
Step 3 - Data Sources
Primary Research
- Web Analytics
- Survey Reports
- Research Institute
- Latest Research Reports
- Opinion Leaders
Secondary Research
- Annual Reports
- White Paper
- Latest Press Release
- Industry Association
- Paid Database
- Investor Presentations

Step 4 - Data Triangulation
Involves using different sources of information in order to increase the validity of a study
These sources are likely to be stakeholders in a program - participants, other researchers, program staff, other community members, and so on.
Then we put all data in single framework & apply various statistical tools to find out the dynamic on the market.
During the analysis stage, feedback from the stakeholder groups would be compared to determine areas of agreement as well as areas of divergence