

Key Insights
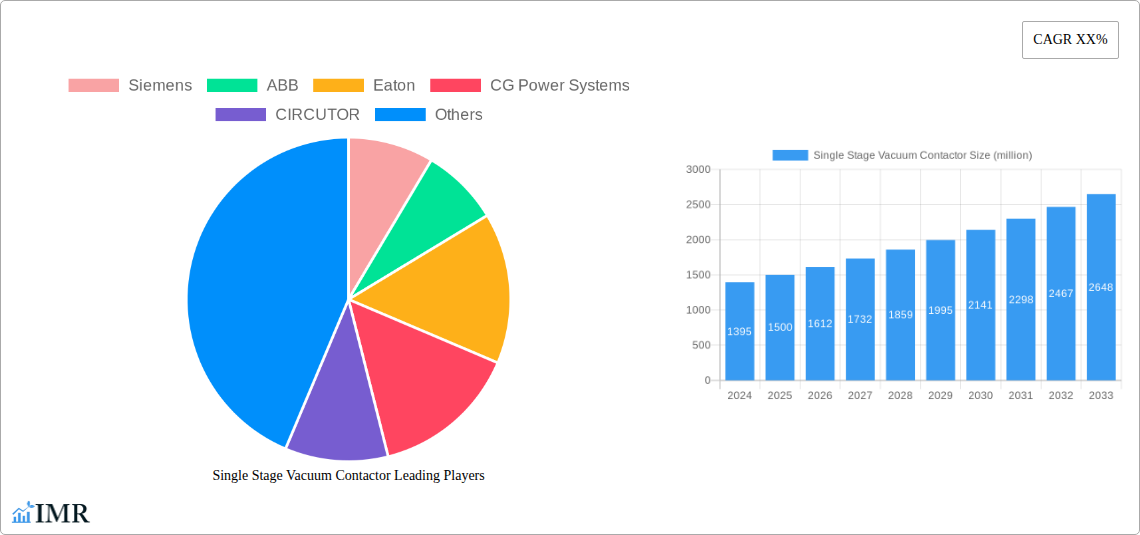
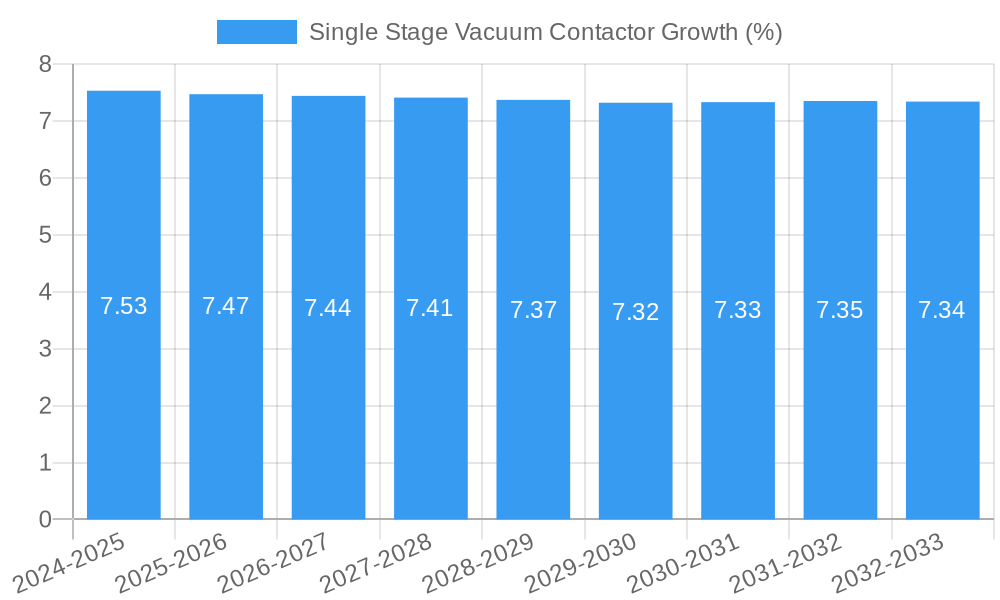
The global Single Stage Vacuum Contactor market is poised for substantial growth, projected to reach an estimated value of $1,500 million by 2025, with a compound annual growth rate (CAGR) of 7.5% expected from 2025 to 2033. This robust expansion is primarily fueled by the increasing demand across critical industrial sectors such as the metallurgical and petrochemical industries, where reliable and efficient electrical switching is paramount. These industries rely heavily on vacuum contactors for their high durability, arc-quenching capabilities, and suitability for frequent switching operations, especially in demanding environments. Furthermore, the growing infrastructure development and urbanization globally, particularly in regions like Asia Pacific and North America, is driving demand for advanced electrical equipment, including single stage vacuum contactors, for power distribution and control systems in buildings and industrial complexes.
The market dynamics are shaped by several key trends, including advancements in vacuum interrupter technology, leading to more compact and energy-efficient contactors. The integration of smart technologies and IoT capabilities is also emerging as a significant trend, enabling remote monitoring, diagnostics, and predictive maintenance of these critical components, thereby enhancing operational efficiency and reducing downtime. However, the market faces certain restraints, such as the initial high cost of advanced vacuum contactors compared to traditional switchgear, and the stringent regulatory standards for electrical safety that necessitate significant investment in research and development. Key players like Siemens, ABB, and Eaton are at the forefront of innovation, offering a diverse range of electromagnetic, permanent magnet, and pneumatic contactors to cater to varied application needs, including the architectural sector and other specialized applications.
Single Stage Vacuum Contactor Market: In-Depth Analysis and Future Outlook (2019-2033)
This comprehensive report delves into the global Single Stage Vacuum Contactor market, providing an exhaustive analysis of market dynamics, growth trends, key players, and future opportunities. Covering the period from 2019 to 2033, with a base year of 2025, this report offers critical insights for industry professionals, investors, and stakeholders. We explore parent and child market segments to provide a holistic understanding of market penetration and potential.
Single Stage Vacuum Contactor Market Dynamics & Structure
The global Single Stage Vacuum Contactor market is characterized by moderate concentration, with leading players like Siemens, ABB, and Eaton holding significant market shares. Technological innovation is a primary driver, with continuous advancements in vacuum interrupter technology and automation capabilities enhancing performance and reliability. Regulatory frameworks, particularly those pertaining to electrical safety standards and environmental impact, play a crucial role in shaping product development and market entry. Competitive product substitutes, such as traditional air break contactors and SF6 gas insulated switchgear, present a degree of competitive pressure, necessitating constant innovation and cost optimization. End-user demographics span across critical industrial sectors, with a growing demand from the metallurgical, petrochemical, and infrastructure development segments. Mergers and acquisitions (M&A) trends are also evident, as larger companies seek to consolidate their market position and expand their product portfolios. For instance, the M&A volume in the broader electrical components sector reached an estimated 850 million units in 2023, indicating a strategic consolidation phase. Key innovation drivers include the need for energy efficiency, enhanced safety, and reduced maintenance, pushing manufacturers to develop more robust and intelligent vacuum contactors. Barriers to innovation often stem from the high cost of R&D for advanced vacuum technology and the stringent testing and certification processes.
- Market Concentration: Moderate, with top 3 players holding approximately 45% market share.
- Technological Innovation Drivers: Increased demand for energy efficiency, enhanced electrical safety, and smart grid integration.
- Regulatory Frameworks: Stringent safety standards (e.g., IEC, UL) and environmental regulations influence product design.
- Competitive Product Substitutes: Air break contactors, SF6 gas insulated switchgear.
- End-User Demographics: Industrial sectors including metallurgical, petrochemical, construction, and power distribution.
- M&A Trends: Growing consolidation driven by the need for economies of scale and expanded market reach.
Single Stage Vacuum Contactor Growth Trends & Insights
The global Single Stage Vacuum Contactor market is poised for substantial growth, projected to expand at a Compound Annual Growth Rate (CAGR) of approximately 5.8% during the forecast period of 2025–2033. This growth is underpinned by the increasing adoption of renewable energy sources, the expansion of industrial infrastructure globally, and the rising demand for reliable and efficient electrical switching solutions. Market size is estimated to reach nearly 1.5 billion units by 2033, up from an estimated 950 million units in 2024. Technological disruptions, such as the development of more compact and energy-efficient vacuum interrupters, are further fueling market penetration. Consumer behavior shifts are also contributing, with a greater emphasis on predictive maintenance and remote monitoring capabilities, driving the demand for smart vacuum contactors with integrated diagnostics. The metallurgical industry, a significant consumer, is expected to grow at a CAGR of 6.2%, driven by increased demand for steel and alloys. Similarly, the petrochemical sector's growth, estimated at 5.5% CAGR, will necessitate robust and reliable switching equipment. The overall adoption rate of vacuum contactors in industrial applications is steadily increasing as their advantages in terms of lifespan, arc suppression, and reduced maintenance become more widely recognized. Furthermore, the ongoing infrastructure development in emerging economies is creating substantial opportunities for market expansion. The market penetration in new industrial installations is estimated to reach 75% by 2030, up from approximately 60% in 2024.
Dominant Regions, Countries, or Segments in Single Stage Vacuum Contactor
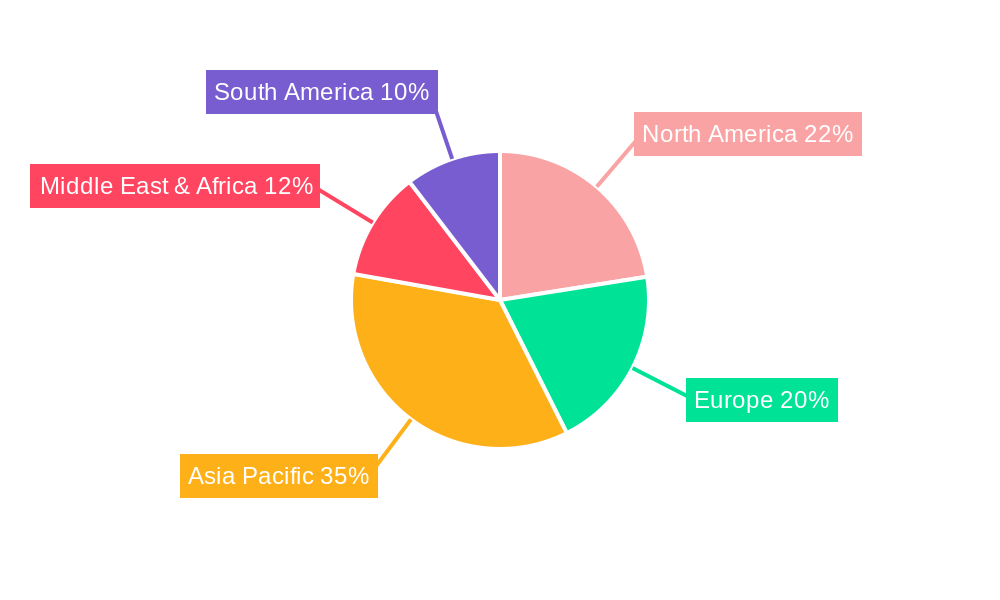
The Metallurgical Industry segment is identified as the dominant force driving growth in the global Single Stage Vacuum Contactor market. This dominance is attributed to the industry's high energy consumption and the critical need for reliable, high-capacity switching solutions in applications such as arc furnaces, induction furnaces, and rolling mills. The segment is expected to command a market share of approximately 30% by 2030. North America and Europe currently lead in terms of market share, with established industrial bases and stringent safety regulations. However, the Asia Pacific region, particularly China and India, is exhibiting the fastest growth rate, driven by significant investments in infrastructure and industrial modernization.
Dominant Segment: Metallurgical Industry
- Key Drivers: High energy demand in smelting and refining processes, requirement for heavy-duty switching, and increasing production of metals for infrastructure and automotive sectors.
- Market Share: Estimated 30% of the total market by 2030.
- Growth Potential: High, fueled by ongoing industrial expansion and technological upgrades.
Dominant Application (within Metallurgical): Electric Arc Furnaces (EAFs) and Induction Furnaces.
- Market Penetration: EAFs represent a significant portion of the demand for heavy-duty single-stage vacuum contactors.
Dominant Type: Electromagnetic Contactors are projected to hold the largest market share due to their established reliability and widespread adoption, followed by Permanent Magnet Contactors which are gaining traction due to their enhanced energy efficiency and reduced maintenance.
- Market Share (Electromagnetic): Estimated 55%
- Market Share (Permanent Magnet): Estimated 35%
Leading Region: Asia Pacific, driven by rapid industrialization and infrastructure development, is expected to be the fastest-growing region.
- Key Drivers: Government initiatives promoting manufacturing, increasing FDI, and a growing demand for power distribution and control equipment.
- Growth Rate: Projected CAGR of 6.5% for the region.
Leading Country: China, due to its massive industrial base and ongoing infrastructure projects, is a key market.
- Contribution: Estimated to contribute over 25% of the global market revenue by 2030.
Single Stage Vacuum Contactor Product Landscape
The Single Stage Vacuum Contactor market is characterized by continuous product innovation, focusing on enhanced performance, reliability, and energy efficiency. Manufacturers are developing contactors with improved vacuum interrupter technology, leading to longer operational life and reduced maintenance requirements. Key applications span across various industrial sectors, including high-power switching in metallurgical furnaces, petrochemical plants, and robust control systems for large machinery. Performance metrics such as dielectric strength, current carrying capacity, and arc extinction capabilities are constantly being optimized. Unique selling propositions include enhanced safety features, compact designs, and integration with smart grid technologies for remote monitoring and control. Technological advancements are also geared towards reducing contact resistance and minimizing energy loss during switching operations.
Key Drivers, Barriers & Challenges in Single Stage Vacuum Contactor
Key Drivers:
- Industrial Growth: Expansion of manufacturing, mining, and energy sectors globally.
- Technological Advancements: Development of more efficient, reliable, and compact vacuum interrupters.
- Energy Efficiency Initiatives: Demand for solutions that reduce energy consumption and operational costs.
- Safety Regulations: Increasingly stringent electrical safety standards driving the adoption of advanced switching technology.
- Infrastructure Development: Government investments in power grids and industrial facilities.
Barriers & Challenges:
- High Initial Cost: Compared to traditional contactors, vacuum contactors can have a higher upfront investment.
- Competition from Substitutes: Availability of established and lower-cost alternatives.
- Technical Expertise for Installation & Maintenance: Requires specialized knowledge for optimal performance.
- Supply Chain Disruptions: Potential impact on the availability of critical components like vacuum interrupters.
- Regulatory Hurdles: Navigating diverse and evolving international safety and environmental standards can be complex. Quantifiable impact of regulatory compliance costs can add up to 5-7% to production expenses.
Emerging Opportunities in Single Stage Vacuum Contactor
Emerging opportunities in the Single Stage Vacuum Contactor market lie in the increasing demand for automation and smart grid integration. The development of "smart" contactors with built-in IoT capabilities for real-time monitoring, diagnostics, and predictive maintenance presents a significant growth avenue. Untapped markets in developing economies undergoing rapid industrialization offer substantial potential. Innovative applications in renewable energy systems, such as high-capacity switching for solar and wind farms, are also on the rise. Evolving consumer preferences for more sustainable and energy-efficient electrical solutions further fuel the demand for advanced vacuum contactor technologies.
Growth Accelerators in the Single Stage Vacuum Contactor Industry
Growth accelerators for the Single Stage Vacuum Contactor industry include significant technological breakthroughs in vacuum interrupter design, leading to enhanced durability and reduced failure rates. Strategic partnerships between contactor manufacturers and renewable energy providers are expanding market reach. Furthermore, aggressive market expansion strategies by key players into emerging economies, coupled with government incentives for industrial modernization and energy efficiency, are significantly propelling long-term growth. The increasing adoption of electric vehicles and the associated charging infrastructure also presents an indirect growth driver.
Key Players Shaping the Single Stage Vacuum Contactor Market
- Siemens
- ABB
- Eaton
- CG Power Systems
- CIRCUTOR
- Ross Engineering
- VitzroEM Co.,Ltd.
- Tianshui 213 Electrical Apparatus Group CO.,LTD.
- Wenzhou Vacem Technology Co.,Ltd
- GREEGOO ELECTRIC CO LTD
- ZHEJIANG BSB ELECTRICAL APPLIANCES CO.,LTD
- Zhejiang Farady Powertech Co.,Ltd
- Crompton Greaves
Notable Milestones in Single Stage Vacuum Contactor Sector
- 2019: ABB launches a new generation of medium-voltage vacuum contactors with enhanced lifespan and improved thermal management.
- 2020: Eaton acquires a specialized vacuum interrupter manufacturer, strengthening its product portfolio.
- 2021: Siemens introduces smart vacuum contactors with integrated IoT capabilities for remote monitoring.
- 2022: CG Power Systems expands its manufacturing capacity for vacuum contactors to meet growing industrial demand in Asia.
- 2023: The global market for advanced vacuum switching technologies sees an investment surge of over 300 million units in R&D.
- 2024: CIRCUTOR unveils a new series of compact vacuum contactors for specialized industrial applications.
In-Depth Single Stage Vacuum Contactor Market Outlook
The future outlook for the Single Stage Vacuum Contactor market is exceptionally positive, driven by a confluence of sustained industrial growth, continuous technological innovation, and increasing global emphasis on energy efficiency and electrical safety. Growth accelerators such as advancements in vacuum interrupter technology, strategic collaborations, and aggressive market expansion strategies in emerging economies are expected to fuel robust demand. Key strategic opportunities lie in catering to the evolving needs of sectors like renewable energy, electric vehicle charging infrastructure, and the digitalization of industrial processes, which will necessitate reliable and intelligent switching solutions. The market is projected to experience sustained growth, with significant potential for increased market penetration and value creation for stakeholders.
Single Stage Vacuum Contactor Segmentation
-
1. Application
- 1.1. Metallurgical Industry
- 1.2. Petrochemical Industry
- 1.3. Achitechive
- 1.4. Others
-
2. Types
- 2.1. Electromagnetic Contactor
- 2.2. Permanent Magnet Contactor
- 2.3. Pneumatic Contactor
Single Stage Vacuum Contactor Segmentation By Geography
-
1. North America
- 1.1. United States
- 1.2. Canada
- 1.3. Mexico
-
2. South America
- 2.1. Brazil
- 2.2. Argentina
- 2.3. Rest of South America
-
3. Europe
- 3.1. United Kingdom
- 3.2. Germany
- 3.3. France
- 3.4. Italy
- 3.5. Spain
- 3.6. Russia
- 3.7. Benelux
- 3.8. Nordics
- 3.9. Rest of Europe
-
4. Middle East & Africa
- 4.1. Turkey
- 4.2. Israel
- 4.3. GCC
- 4.4. North Africa
- 4.5. South Africa
- 4.6. Rest of Middle East & Africa
-
5. Asia Pacific
- 5.1. China
- 5.2. India
- 5.3. Japan
- 5.4. South Korea
- 5.5. ASEAN
- 5.6. Oceania
- 5.7. Rest of Asia Pacific
Single Stage Vacuum Contactor REPORT HIGHLIGHTS
| Aspects | Details |
|---|---|
| Study Period | 2019-2033 |
| Base Year | 2024 |
| Estimated Year | 2025 |
| Forecast Period | 2025-2033 |
| Historical Period | 2019-2024 |
| Growth Rate | CAGR of XX% from 2019-2033 |
| Segmentation |
|
Table of Contents
- 1. Introduction
- 1.1. Research Scope
- 1.2. Market Segmentation
- 1.3. Research Methodology
- 1.4. Definitions and Assumptions
- 2. Executive Summary
- 2.1. Introduction
- 3. Market Dynamics
- 3.1. Introduction
- 3.2. Market Drivers
- 3.3. Market Restrains
- 3.4. Market Trends
- 4. Market Factor Analysis
- 4.1. Porters Five Forces
- 4.2. Supply/Value Chain
- 4.3. PESTEL analysis
- 4.4. Market Entropy
- 4.5. Patent/Trademark Analysis
- 5. Global Single Stage Vacuum Contactor Analysis, Insights and Forecast, 2019-2031
- 5.1. Market Analysis, Insights and Forecast - by Application
- 5.1.1. Metallurgical Industry
- 5.1.2. Petrochemical Industry
- 5.1.3. Achitechive
- 5.1.4. Others
- 5.2. Market Analysis, Insights and Forecast - by Types
- 5.2.1. Electromagnetic Contactor
- 5.2.2. Permanent Magnet Contactor
- 5.2.3. Pneumatic Contactor
- 5.3. Market Analysis, Insights and Forecast - by Region
- 5.3.1. North America
- 5.3.2. South America
- 5.3.3. Europe
- 5.3.4. Middle East & Africa
- 5.3.5. Asia Pacific
- 5.1. Market Analysis, Insights and Forecast - by Application
- 6. North America Single Stage Vacuum Contactor Analysis, Insights and Forecast, 2019-2031
- 6.1. Market Analysis, Insights and Forecast - by Application
- 6.1.1. Metallurgical Industry
- 6.1.2. Petrochemical Industry
- 6.1.3. Achitechive
- 6.1.4. Others
- 6.2. Market Analysis, Insights and Forecast - by Types
- 6.2.1. Electromagnetic Contactor
- 6.2.2. Permanent Magnet Contactor
- 6.2.3. Pneumatic Contactor
- 6.1. Market Analysis, Insights and Forecast - by Application
- 7. South America Single Stage Vacuum Contactor Analysis, Insights and Forecast, 2019-2031
- 7.1. Market Analysis, Insights and Forecast - by Application
- 7.1.1. Metallurgical Industry
- 7.1.2. Petrochemical Industry
- 7.1.3. Achitechive
- 7.1.4. Others
- 7.2. Market Analysis, Insights and Forecast - by Types
- 7.2.1. Electromagnetic Contactor
- 7.2.2. Permanent Magnet Contactor
- 7.2.3. Pneumatic Contactor
- 7.1. Market Analysis, Insights and Forecast - by Application
- 8. Europe Single Stage Vacuum Contactor Analysis, Insights and Forecast, 2019-2031
- 8.1. Market Analysis, Insights and Forecast - by Application
- 8.1.1. Metallurgical Industry
- 8.1.2. Petrochemical Industry
- 8.1.3. Achitechive
- 8.1.4. Others
- 8.2. Market Analysis, Insights and Forecast - by Types
- 8.2.1. Electromagnetic Contactor
- 8.2.2. Permanent Magnet Contactor
- 8.2.3. Pneumatic Contactor
- 8.1. Market Analysis, Insights and Forecast - by Application
- 9. Middle East & Africa Single Stage Vacuum Contactor Analysis, Insights and Forecast, 2019-2031
- 9.1. Market Analysis, Insights and Forecast - by Application
- 9.1.1. Metallurgical Industry
- 9.1.2. Petrochemical Industry
- 9.1.3. Achitechive
- 9.1.4. Others
- 9.2. Market Analysis, Insights and Forecast - by Types
- 9.2.1. Electromagnetic Contactor
- 9.2.2. Permanent Magnet Contactor
- 9.2.3. Pneumatic Contactor
- 9.1. Market Analysis, Insights and Forecast - by Application
- 10. Asia Pacific Single Stage Vacuum Contactor Analysis, Insights and Forecast, 2019-2031
- 10.1. Market Analysis, Insights and Forecast - by Application
- 10.1.1. Metallurgical Industry
- 10.1.2. Petrochemical Industry
- 10.1.3. Achitechive
- 10.1.4. Others
- 10.2. Market Analysis, Insights and Forecast - by Types
- 10.2.1. Electromagnetic Contactor
- 10.2.2. Permanent Magnet Contactor
- 10.2.3. Pneumatic Contactor
- 10.1. Market Analysis, Insights and Forecast - by Application
- 11. Competitive Analysis
- 11.1. Global Market Share Analysis 2024
- 11.2. Company Profiles
- 11.2.1 Siemens
- 11.2.1.1. Overview
- 11.2.1.2. Products
- 11.2.1.3. SWOT Analysis
- 11.2.1.4. Recent Developments
- 11.2.1.5. Financials (Based on Availability)
- 11.2.2 ABB
- 11.2.2.1. Overview
- 11.2.2.2. Products
- 11.2.2.3. SWOT Analysis
- 11.2.2.4. Recent Developments
- 11.2.2.5. Financials (Based on Availability)
- 11.2.3 Eaton
- 11.2.3.1. Overview
- 11.2.3.2. Products
- 11.2.3.3. SWOT Analysis
- 11.2.3.4. Recent Developments
- 11.2.3.5. Financials (Based on Availability)
- 11.2.4 CG Power Systems
- 11.2.4.1. Overview
- 11.2.4.2. Products
- 11.2.4.3. SWOT Analysis
- 11.2.4.4. Recent Developments
- 11.2.4.5. Financials (Based on Availability)
- 11.2.5 CIRCUTOR
- 11.2.5.1. Overview
- 11.2.5.2. Products
- 11.2.5.3. SWOT Analysis
- 11.2.5.4. Recent Developments
- 11.2.5.5. Financials (Based on Availability)
- 11.2.6 Ross Engineering
- 11.2.6.1. Overview
- 11.2.6.2. Products
- 11.2.6.3. SWOT Analysis
- 11.2.6.4. Recent Developments
- 11.2.6.5. Financials (Based on Availability)
- 11.2.7 VitzroEM Co.
- 11.2.7.1. Overview
- 11.2.7.2. Products
- 11.2.7.3. SWOT Analysis
- 11.2.7.4. Recent Developments
- 11.2.7.5. Financials (Based on Availability)
- 11.2.8 Ltd.
- 11.2.8.1. Overview
- 11.2.8.2. Products
- 11.2.8.3. SWOT Analysis
- 11.2.8.4. Recent Developments
- 11.2.8.5. Financials (Based on Availability)
- 11.2.9 Tianshui 213 Electrical Apparatus Group CO.
- 11.2.9.1. Overview
- 11.2.9.2. Products
- 11.2.9.3. SWOT Analysis
- 11.2.9.4. Recent Developments
- 11.2.9.5. Financials (Based on Availability)
- 11.2.10 LTD.
- 11.2.10.1. Overview
- 11.2.10.2. Products
- 11.2.10.3. SWOT Analysis
- 11.2.10.4. Recent Developments
- 11.2.10.5. Financials (Based on Availability)
- 11.2.11 Wenzhou Vacem Technology Co.
- 11.2.11.1. Overview
- 11.2.11.2. Products
- 11.2.11.3. SWOT Analysis
- 11.2.11.4. Recent Developments
- 11.2.11.5. Financials (Based on Availability)
- 11.2.12 Ltd
- 11.2.12.1. Overview
- 11.2.12.2. Products
- 11.2.12.3. SWOT Analysis
- 11.2.12.4. Recent Developments
- 11.2.12.5. Financials (Based on Availability)
- 11.2.13 GREEGOO ELECTRIC CO LTD
- 11.2.13.1. Overview
- 11.2.13.2. Products
- 11.2.13.3. SWOT Analysis
- 11.2.13.4. Recent Developments
- 11.2.13.5. Financials (Based on Availability)
- 11.2.14 ZHEJIANG BSB ELECTRICAL APPLIANCES CO.
- 11.2.14.1. Overview
- 11.2.14.2. Products
- 11.2.14.3. SWOT Analysis
- 11.2.14.4. Recent Developments
- 11.2.14.5. Financials (Based on Availability)
- 11.2.15 LTD
- 11.2.15.1. Overview
- 11.2.15.2. Products
- 11.2.15.3. SWOT Analysis
- 11.2.15.4. Recent Developments
- 11.2.15.5. Financials (Based on Availability)
- 11.2.16 Zhejiang Farady Powertech Co.
- 11.2.16.1. Overview
- 11.2.16.2. Products
- 11.2.16.3. SWOT Analysis
- 11.2.16.4. Recent Developments
- 11.2.16.5. Financials (Based on Availability)
- 11.2.17 Ltd
- 11.2.17.1. Overview
- 11.2.17.2. Products
- 11.2.17.3. SWOT Analysis
- 11.2.17.4. Recent Developments
- 11.2.17.5. Financials (Based on Availability)
- 11.2.18 Crompton Greaves
- 11.2.18.1. Overview
- 11.2.18.2. Products
- 11.2.18.3. SWOT Analysis
- 11.2.18.4. Recent Developments
- 11.2.18.5. Financials (Based on Availability)
- 11.2.1 Siemens
List of Figures
- Figure 1: Global Single Stage Vacuum Contactor Revenue Breakdown (million, %) by Region 2024 & 2032
- Figure 2: Global Single Stage Vacuum Contactor Volume Breakdown (K, %) by Region 2024 & 2032
- Figure 3: North America Single Stage Vacuum Contactor Revenue (million), by Application 2024 & 2032
- Figure 4: North America Single Stage Vacuum Contactor Volume (K), by Application 2024 & 2032
- Figure 5: North America Single Stage Vacuum Contactor Revenue Share (%), by Application 2024 & 2032
- Figure 6: North America Single Stage Vacuum Contactor Volume Share (%), by Application 2024 & 2032
- Figure 7: North America Single Stage Vacuum Contactor Revenue (million), by Types 2024 & 2032
- Figure 8: North America Single Stage Vacuum Contactor Volume (K), by Types 2024 & 2032
- Figure 9: North America Single Stage Vacuum Contactor Revenue Share (%), by Types 2024 & 2032
- Figure 10: North America Single Stage Vacuum Contactor Volume Share (%), by Types 2024 & 2032
- Figure 11: North America Single Stage Vacuum Contactor Revenue (million), by Country 2024 & 2032
- Figure 12: North America Single Stage Vacuum Contactor Volume (K), by Country 2024 & 2032
- Figure 13: North America Single Stage Vacuum Contactor Revenue Share (%), by Country 2024 & 2032
- Figure 14: North America Single Stage Vacuum Contactor Volume Share (%), by Country 2024 & 2032
- Figure 15: South America Single Stage Vacuum Contactor Revenue (million), by Application 2024 & 2032
- Figure 16: South America Single Stage Vacuum Contactor Volume (K), by Application 2024 & 2032
- Figure 17: South America Single Stage Vacuum Contactor Revenue Share (%), by Application 2024 & 2032
- Figure 18: South America Single Stage Vacuum Contactor Volume Share (%), by Application 2024 & 2032
- Figure 19: South America Single Stage Vacuum Contactor Revenue (million), by Types 2024 & 2032
- Figure 20: South America Single Stage Vacuum Contactor Volume (K), by Types 2024 & 2032
- Figure 21: South America Single Stage Vacuum Contactor Revenue Share (%), by Types 2024 & 2032
- Figure 22: South America Single Stage Vacuum Contactor Volume Share (%), by Types 2024 & 2032
- Figure 23: South America Single Stage Vacuum Contactor Revenue (million), by Country 2024 & 2032
- Figure 24: South America Single Stage Vacuum Contactor Volume (K), by Country 2024 & 2032
- Figure 25: South America Single Stage Vacuum Contactor Revenue Share (%), by Country 2024 & 2032
- Figure 26: South America Single Stage Vacuum Contactor Volume Share (%), by Country 2024 & 2032
- Figure 27: Europe Single Stage Vacuum Contactor Revenue (million), by Application 2024 & 2032
- Figure 28: Europe Single Stage Vacuum Contactor Volume (K), by Application 2024 & 2032
- Figure 29: Europe Single Stage Vacuum Contactor Revenue Share (%), by Application 2024 & 2032
- Figure 30: Europe Single Stage Vacuum Contactor Volume Share (%), by Application 2024 & 2032
- Figure 31: Europe Single Stage Vacuum Contactor Revenue (million), by Types 2024 & 2032
- Figure 32: Europe Single Stage Vacuum Contactor Volume (K), by Types 2024 & 2032
- Figure 33: Europe Single Stage Vacuum Contactor Revenue Share (%), by Types 2024 & 2032
- Figure 34: Europe Single Stage Vacuum Contactor Volume Share (%), by Types 2024 & 2032
- Figure 35: Europe Single Stage Vacuum Contactor Revenue (million), by Country 2024 & 2032
- Figure 36: Europe Single Stage Vacuum Contactor Volume (K), by Country 2024 & 2032
- Figure 37: Europe Single Stage Vacuum Contactor Revenue Share (%), by Country 2024 & 2032
- Figure 38: Europe Single Stage Vacuum Contactor Volume Share (%), by Country 2024 & 2032
- Figure 39: Middle East & Africa Single Stage Vacuum Contactor Revenue (million), by Application 2024 & 2032
- Figure 40: Middle East & Africa Single Stage Vacuum Contactor Volume (K), by Application 2024 & 2032
- Figure 41: Middle East & Africa Single Stage Vacuum Contactor Revenue Share (%), by Application 2024 & 2032
- Figure 42: Middle East & Africa Single Stage Vacuum Contactor Volume Share (%), by Application 2024 & 2032
- Figure 43: Middle East & Africa Single Stage Vacuum Contactor Revenue (million), by Types 2024 & 2032
- Figure 44: Middle East & Africa Single Stage Vacuum Contactor Volume (K), by Types 2024 & 2032
- Figure 45: Middle East & Africa Single Stage Vacuum Contactor Revenue Share (%), by Types 2024 & 2032
- Figure 46: Middle East & Africa Single Stage Vacuum Contactor Volume Share (%), by Types 2024 & 2032
- Figure 47: Middle East & Africa Single Stage Vacuum Contactor Revenue (million), by Country 2024 & 2032
- Figure 48: Middle East & Africa Single Stage Vacuum Contactor Volume (K), by Country 2024 & 2032
- Figure 49: Middle East & Africa Single Stage Vacuum Contactor Revenue Share (%), by Country 2024 & 2032
- Figure 50: Middle East & Africa Single Stage Vacuum Contactor Volume Share (%), by Country 2024 & 2032
- Figure 51: Asia Pacific Single Stage Vacuum Contactor Revenue (million), by Application 2024 & 2032
- Figure 52: Asia Pacific Single Stage Vacuum Contactor Volume (K), by Application 2024 & 2032
- Figure 53: Asia Pacific Single Stage Vacuum Contactor Revenue Share (%), by Application 2024 & 2032
- Figure 54: Asia Pacific Single Stage Vacuum Contactor Volume Share (%), by Application 2024 & 2032
- Figure 55: Asia Pacific Single Stage Vacuum Contactor Revenue (million), by Types 2024 & 2032
- Figure 56: Asia Pacific Single Stage Vacuum Contactor Volume (K), by Types 2024 & 2032
- Figure 57: Asia Pacific Single Stage Vacuum Contactor Revenue Share (%), by Types 2024 & 2032
- Figure 58: Asia Pacific Single Stage Vacuum Contactor Volume Share (%), by Types 2024 & 2032
- Figure 59: Asia Pacific Single Stage Vacuum Contactor Revenue (million), by Country 2024 & 2032
- Figure 60: Asia Pacific Single Stage Vacuum Contactor Volume (K), by Country 2024 & 2032
- Figure 61: Asia Pacific Single Stage Vacuum Contactor Revenue Share (%), by Country 2024 & 2032
- Figure 62: Asia Pacific Single Stage Vacuum Contactor Volume Share (%), by Country 2024 & 2032
List of Tables
- Table 1: Global Single Stage Vacuum Contactor Revenue million Forecast, by Region 2019 & 2032
- Table 2: Global Single Stage Vacuum Contactor Volume K Forecast, by Region 2019 & 2032
- Table 3: Global Single Stage Vacuum Contactor Revenue million Forecast, by Application 2019 & 2032
- Table 4: Global Single Stage Vacuum Contactor Volume K Forecast, by Application 2019 & 2032
- Table 5: Global Single Stage Vacuum Contactor Revenue million Forecast, by Types 2019 & 2032
- Table 6: Global Single Stage Vacuum Contactor Volume K Forecast, by Types 2019 & 2032
- Table 7: Global Single Stage Vacuum Contactor Revenue million Forecast, by Region 2019 & 2032
- Table 8: Global Single Stage Vacuum Contactor Volume K Forecast, by Region 2019 & 2032
- Table 9: Global Single Stage Vacuum Contactor Revenue million Forecast, by Application 2019 & 2032
- Table 10: Global Single Stage Vacuum Contactor Volume K Forecast, by Application 2019 & 2032
- Table 11: Global Single Stage Vacuum Contactor Revenue million Forecast, by Types 2019 & 2032
- Table 12: Global Single Stage Vacuum Contactor Volume K Forecast, by Types 2019 & 2032
- Table 13: Global Single Stage Vacuum Contactor Revenue million Forecast, by Country 2019 & 2032
- Table 14: Global Single Stage Vacuum Contactor Volume K Forecast, by Country 2019 & 2032
- Table 15: United States Single Stage Vacuum Contactor Revenue (million) Forecast, by Application 2019 & 2032
- Table 16: United States Single Stage Vacuum Contactor Volume (K) Forecast, by Application 2019 & 2032
- Table 17: Canada Single Stage Vacuum Contactor Revenue (million) Forecast, by Application 2019 & 2032
- Table 18: Canada Single Stage Vacuum Contactor Volume (K) Forecast, by Application 2019 & 2032
- Table 19: Mexico Single Stage Vacuum Contactor Revenue (million) Forecast, by Application 2019 & 2032
- Table 20: Mexico Single Stage Vacuum Contactor Volume (K) Forecast, by Application 2019 & 2032
- Table 21: Global Single Stage Vacuum Contactor Revenue million Forecast, by Application 2019 & 2032
- Table 22: Global Single Stage Vacuum Contactor Volume K Forecast, by Application 2019 & 2032
- Table 23: Global Single Stage Vacuum Contactor Revenue million Forecast, by Types 2019 & 2032
- Table 24: Global Single Stage Vacuum Contactor Volume K Forecast, by Types 2019 & 2032
- Table 25: Global Single Stage Vacuum Contactor Revenue million Forecast, by Country 2019 & 2032
- Table 26: Global Single Stage Vacuum Contactor Volume K Forecast, by Country 2019 & 2032
- Table 27: Brazil Single Stage Vacuum Contactor Revenue (million) Forecast, by Application 2019 & 2032
- Table 28: Brazil Single Stage Vacuum Contactor Volume (K) Forecast, by Application 2019 & 2032
- Table 29: Argentina Single Stage Vacuum Contactor Revenue (million) Forecast, by Application 2019 & 2032
- Table 30: Argentina Single Stage Vacuum Contactor Volume (K) Forecast, by Application 2019 & 2032
- Table 31: Rest of South America Single Stage Vacuum Contactor Revenue (million) Forecast, by Application 2019 & 2032
- Table 32: Rest of South America Single Stage Vacuum Contactor Volume (K) Forecast, by Application 2019 & 2032
- Table 33: Global Single Stage Vacuum Contactor Revenue million Forecast, by Application 2019 & 2032
- Table 34: Global Single Stage Vacuum Contactor Volume K Forecast, by Application 2019 & 2032
- Table 35: Global Single Stage Vacuum Contactor Revenue million Forecast, by Types 2019 & 2032
- Table 36: Global Single Stage Vacuum Contactor Volume K Forecast, by Types 2019 & 2032
- Table 37: Global Single Stage Vacuum Contactor Revenue million Forecast, by Country 2019 & 2032
- Table 38: Global Single Stage Vacuum Contactor Volume K Forecast, by Country 2019 & 2032
- Table 39: United Kingdom Single Stage Vacuum Contactor Revenue (million) Forecast, by Application 2019 & 2032
- Table 40: United Kingdom Single Stage Vacuum Contactor Volume (K) Forecast, by Application 2019 & 2032
- Table 41: Germany Single Stage Vacuum Contactor Revenue (million) Forecast, by Application 2019 & 2032
- Table 42: Germany Single Stage Vacuum Contactor Volume (K) Forecast, by Application 2019 & 2032
- Table 43: France Single Stage Vacuum Contactor Revenue (million) Forecast, by Application 2019 & 2032
- Table 44: France Single Stage Vacuum Contactor Volume (K) Forecast, by Application 2019 & 2032
- Table 45: Italy Single Stage Vacuum Contactor Revenue (million) Forecast, by Application 2019 & 2032
- Table 46: Italy Single Stage Vacuum Contactor Volume (K) Forecast, by Application 2019 & 2032
- Table 47: Spain Single Stage Vacuum Contactor Revenue (million) Forecast, by Application 2019 & 2032
- Table 48: Spain Single Stage Vacuum Contactor Volume (K) Forecast, by Application 2019 & 2032
- Table 49: Russia Single Stage Vacuum Contactor Revenue (million) Forecast, by Application 2019 & 2032
- Table 50: Russia Single Stage Vacuum Contactor Volume (K) Forecast, by Application 2019 & 2032
- Table 51: Benelux Single Stage Vacuum Contactor Revenue (million) Forecast, by Application 2019 & 2032
- Table 52: Benelux Single Stage Vacuum Contactor Volume (K) Forecast, by Application 2019 & 2032
- Table 53: Nordics Single Stage Vacuum Contactor Revenue (million) Forecast, by Application 2019 & 2032
- Table 54: Nordics Single Stage Vacuum Contactor Volume (K) Forecast, by Application 2019 & 2032
- Table 55: Rest of Europe Single Stage Vacuum Contactor Revenue (million) Forecast, by Application 2019 & 2032
- Table 56: Rest of Europe Single Stage Vacuum Contactor Volume (K) Forecast, by Application 2019 & 2032
- Table 57: Global Single Stage Vacuum Contactor Revenue million Forecast, by Application 2019 & 2032
- Table 58: Global Single Stage Vacuum Contactor Volume K Forecast, by Application 2019 & 2032
- Table 59: Global Single Stage Vacuum Contactor Revenue million Forecast, by Types 2019 & 2032
- Table 60: Global Single Stage Vacuum Contactor Volume K Forecast, by Types 2019 & 2032
- Table 61: Global Single Stage Vacuum Contactor Revenue million Forecast, by Country 2019 & 2032
- Table 62: Global Single Stage Vacuum Contactor Volume K Forecast, by Country 2019 & 2032
- Table 63: Turkey Single Stage Vacuum Contactor Revenue (million) Forecast, by Application 2019 & 2032
- Table 64: Turkey Single Stage Vacuum Contactor Volume (K) Forecast, by Application 2019 & 2032
- Table 65: Israel Single Stage Vacuum Contactor Revenue (million) Forecast, by Application 2019 & 2032
- Table 66: Israel Single Stage Vacuum Contactor Volume (K) Forecast, by Application 2019 & 2032
- Table 67: GCC Single Stage Vacuum Contactor Revenue (million) Forecast, by Application 2019 & 2032
- Table 68: GCC Single Stage Vacuum Contactor Volume (K) Forecast, by Application 2019 & 2032
- Table 69: North Africa Single Stage Vacuum Contactor Revenue (million) Forecast, by Application 2019 & 2032
- Table 70: North Africa Single Stage Vacuum Contactor Volume (K) Forecast, by Application 2019 & 2032
- Table 71: South Africa Single Stage Vacuum Contactor Revenue (million) Forecast, by Application 2019 & 2032
- Table 72: South Africa Single Stage Vacuum Contactor Volume (K) Forecast, by Application 2019 & 2032
- Table 73: Rest of Middle East & Africa Single Stage Vacuum Contactor Revenue (million) Forecast, by Application 2019 & 2032
- Table 74: Rest of Middle East & Africa Single Stage Vacuum Contactor Volume (K) Forecast, by Application 2019 & 2032
- Table 75: Global Single Stage Vacuum Contactor Revenue million Forecast, by Application 2019 & 2032
- Table 76: Global Single Stage Vacuum Contactor Volume K Forecast, by Application 2019 & 2032
- Table 77: Global Single Stage Vacuum Contactor Revenue million Forecast, by Types 2019 & 2032
- Table 78: Global Single Stage Vacuum Contactor Volume K Forecast, by Types 2019 & 2032
- Table 79: Global Single Stage Vacuum Contactor Revenue million Forecast, by Country 2019 & 2032
- Table 80: Global Single Stage Vacuum Contactor Volume K Forecast, by Country 2019 & 2032
- Table 81: China Single Stage Vacuum Contactor Revenue (million) Forecast, by Application 2019 & 2032
- Table 82: China Single Stage Vacuum Contactor Volume (K) Forecast, by Application 2019 & 2032
- Table 83: India Single Stage Vacuum Contactor Revenue (million) Forecast, by Application 2019 & 2032
- Table 84: India Single Stage Vacuum Contactor Volume (K) Forecast, by Application 2019 & 2032
- Table 85: Japan Single Stage Vacuum Contactor Revenue (million) Forecast, by Application 2019 & 2032
- Table 86: Japan Single Stage Vacuum Contactor Volume (K) Forecast, by Application 2019 & 2032
- Table 87: South Korea Single Stage Vacuum Contactor Revenue (million) Forecast, by Application 2019 & 2032
- Table 88: South Korea Single Stage Vacuum Contactor Volume (K) Forecast, by Application 2019 & 2032
- Table 89: ASEAN Single Stage Vacuum Contactor Revenue (million) Forecast, by Application 2019 & 2032
- Table 90: ASEAN Single Stage Vacuum Contactor Volume (K) Forecast, by Application 2019 & 2032
- Table 91: Oceania Single Stage Vacuum Contactor Revenue (million) Forecast, by Application 2019 & 2032
- Table 92: Oceania Single Stage Vacuum Contactor Volume (K) Forecast, by Application 2019 & 2032
- Table 93: Rest of Asia Pacific Single Stage Vacuum Contactor Revenue (million) Forecast, by Application 2019 & 2032
- Table 94: Rest of Asia Pacific Single Stage Vacuum Contactor Volume (K) Forecast, by Application 2019 & 2032
Frequently Asked Questions
1. What is the projected Compound Annual Growth Rate (CAGR) of the Single Stage Vacuum Contactor?
The projected CAGR is approximately XX%.
2. Which companies are prominent players in the Single Stage Vacuum Contactor?
Key companies in the market include Siemens, ABB, Eaton, CG Power Systems, CIRCUTOR, Ross Engineering, VitzroEM Co., Ltd., Tianshui 213 Electrical Apparatus Group CO., LTD., Wenzhou Vacem Technology Co., Ltd, GREEGOO ELECTRIC CO LTD, ZHEJIANG BSB ELECTRICAL APPLIANCES CO., LTD, Zhejiang Farady Powertech Co., Ltd, Crompton Greaves.
3. What are the main segments of the Single Stage Vacuum Contactor?
The market segments include Application, Types.
4. Can you provide details about the market size?
The market size is estimated to be USD XXX million as of 2022.
5. What are some drivers contributing to market growth?
N/A
6. What are the notable trends driving market growth?
N/A
7. Are there any restraints impacting market growth?
N/A
8. Can you provide examples of recent developments in the market?
N/A
9. What pricing options are available for accessing the report?
Pricing options include single-user, multi-user, and enterprise licenses priced at USD 3950.00, USD 5925.00, and USD 7900.00 respectively.
10. Is the market size provided in terms of value or volume?
The market size is provided in terms of value, measured in million and volume, measured in K.
11. Are there any specific market keywords associated with the report?
Yes, the market keyword associated with the report is "Single Stage Vacuum Contactor," which aids in identifying and referencing the specific market segment covered.
12. How do I determine which pricing option suits my needs best?
The pricing options vary based on user requirements and access needs. Individual users may opt for single-user licenses, while businesses requiring broader access may choose multi-user or enterprise licenses for cost-effective access to the report.
13. Are there any additional resources or data provided in the Single Stage Vacuum Contactor report?
While the report offers comprehensive insights, it's advisable to review the specific contents or supplementary materials provided to ascertain if additional resources or data are available.
14. How can I stay updated on further developments or reports in the Single Stage Vacuum Contactor?
To stay informed about further developments, trends, and reports in the Single Stage Vacuum Contactor, consider subscribing to industry newsletters, following relevant companies and organizations, or regularly checking reputable industry news sources and publications.
Methodology
Step 1 - Identification of Relevant Samples Size from Population Database


Step 2 - Approaches for Defining Global Market Size (Value, Volume* & Price*)

Note*: In applicable scenarios
Step 3 - Data Sources
Primary Research
- Web Analytics
- Survey Reports
- Research Institute
- Latest Research Reports
- Opinion Leaders
Secondary Research
- Annual Reports
- White Paper
- Latest Press Release
- Industry Association
- Paid Database
- Investor Presentations

Step 4 - Data Triangulation
Involves using different sources of information in order to increase the validity of a study
These sources are likely to be stakeholders in a program - participants, other researchers, program staff, other community members, and so on.
Then we put all data in single framework & apply various statistical tools to find out the dynamic on the market.
During the analysis stage, feedback from the stakeholder groups would be compared to determine areas of agreement as well as areas of divergence
