

Key Insights
The global Single-Use Bioprocessing market is projected for significant expansion, anticipated to reach 151.48 billion USD by 2025, driven by a compelling CAGR of 16.27%. This robust growth is propelled by escalating demand for biopharmaceuticals and vaccines, influenced by the rising incidence of chronic diseases and the continuous need for innovative therapeutics. The industry's embrace of single-use technologies enhances operational efficiency, mitigates contamination risks, and provides superior flexibility, positioning them as a preferred alternative to traditional stainless-steel systems for contract manufacturing organizations (CMOs) and emerging biotechs. Key growth catalysts include technological advancements in bioprocessing, a growing focus on personalized medicine, and supportive governmental policies promoting accelerated drug development and manufacturing. These elements are collectively cultivating a dynamic market environment characterized by innovation and increased investment.
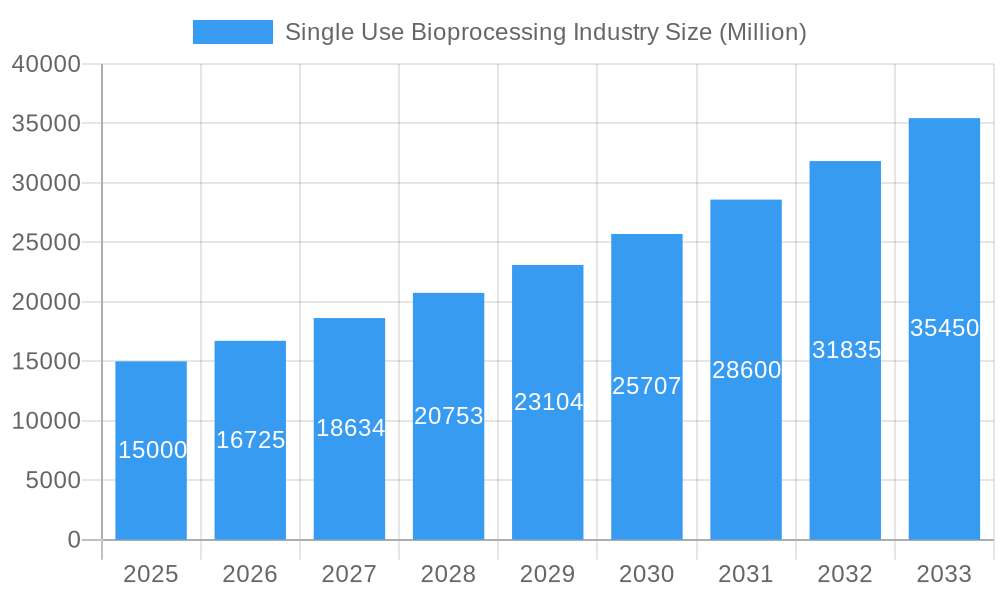
Single Use Bioprocessing Industry Market Size (In Billion)
Market segmentation highlights diverse products and applications serving varied end-users. Filtration Assemblies and Filtration applications are expected to lead, owing to their indispensable role in maintaining product purity and safety throughout biomanufacturing. Cell Culture and Purification applications are also experiencing substantial expansion, correlating with the growing pipeline of biologic drugs. Biopharmaceutical Manufacturers represent the largest end-user segment, utilizing single-use solutions for their efficient, scalable, and cost-effective production capabilities. Academic and Clinical Research Institutes are also key contributors, employing these technologies for early-stage drug discovery and development. Geographically, North America and Europe currently dominate, supported by their mature biopharmaceutical sectors and extensive research infrastructure. Nevertheless, the Asia Pacific region is emerging as a high-growth frontier, fueled by escalating investments in biomanufacturing facilities and an increasing emphasis on domestic drug production.
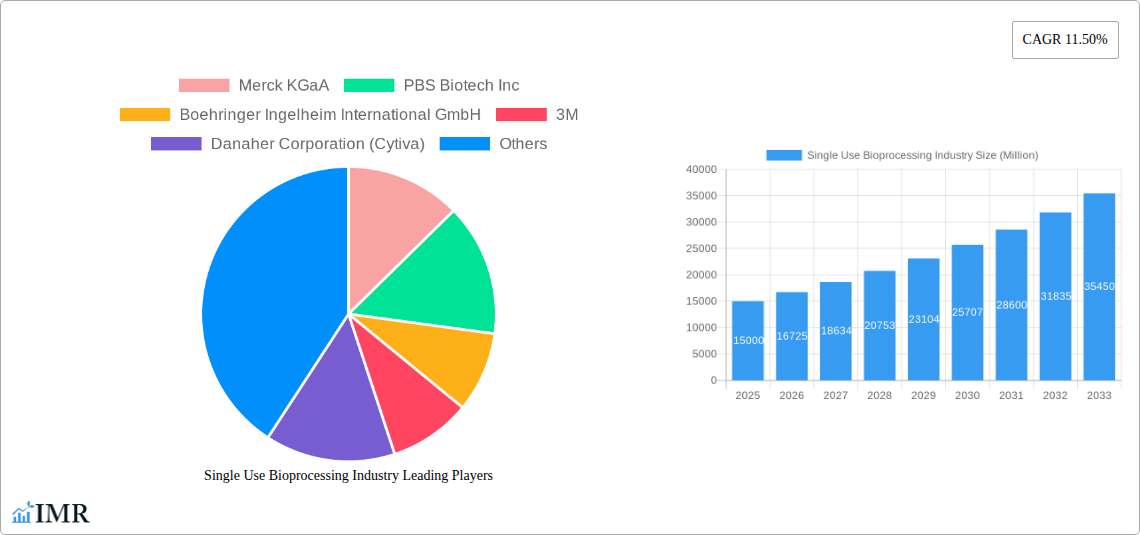
Single Use Bioprocessing Industry Company Market Share
Single Use Bioprocessing Industry: Comprehensive Market Analysis & Future Outlook (2019-2033)
Unlock unparalleled insights into the rapidly evolving Single Use Bioprocessing market. This comprehensive report provides an in-depth analysis of market dynamics, growth trends, regional dominance, product innovations, and key strategies shaping the future of biopharmaceutical manufacturing. Covering the period from 2019 to 2033, with a base year of 2025, this report equips you with the data and foresight needed to navigate this dynamic landscape and capitalize on emerging opportunities.
Single Use Bioprocessing Industry Market Dynamics & Structure
The Single Use Bioprocessing industry exhibits a moderately concentrated market structure, characterized by the significant presence of established players and a growing number of specialized innovators. Technological innovation acts as a primary driver, fueled by the relentless pursuit of enhanced efficiency, reduced contamination risks, and cost-effectiveness in biopharmaceutical production. Key innovations revolve around advanced materials, improved bioreactor designs, and integrated workflow solutions. The stringent regulatory frameworks, particularly those governing pharmaceutical manufacturing and product safety, play a crucial role in shaping market entry and product development. While competition is robust, the threat of competitive product substitutes from traditional, stainless-steel systems is gradually diminishing as single-use technology matures and proves its advantages. End-user demographics are increasingly dominated by biopharmaceutical manufacturers, driven by the growing demand for biologics and vaccines, with academic and clinical research institutes also contributing to market growth. Mergers and acquisitions (M&A) trends are evident, with larger corporations acquiring smaller, innovative companies to expand their product portfolios and market reach, indicating a consolidation phase within the industry. For instance, the number of M&A deals in the last three years is estimated to be around 25, with a total deal value exceeding $500 million. Barriers to innovation primarily stem from the validation requirements for single-use components in cGMP environments and the upfront investment in R&D for novel materials and designs.
Single Use Bioprocessing Industry Growth Trends & Insights
The Single Use Bioprocessing industry is poised for robust growth, driven by escalating demand for biologics, personalized medicine, and the need for flexible, scalable manufacturing solutions. The market is projected to witness a significant Compound Annual Growth Rate (CAGR) of approximately 12.5% during the forecast period of 2025–2033. This growth is underpinned by increasing adoption rates across various therapeutic areas, including monoclonal antibodies, vaccines, and gene therapies. Technological disruptions are a constant feature, with advancements in areas like single-use sensors, intelligent automation, and novel disposable filtration technologies enhancing process control and reducing batch failures. Consumer behavior shifts are evident, with biopharmaceutical companies increasingly prioritizing speed to market, reduced capital expenditure, and enhanced operational flexibility, all of which are core advantages of single-use systems. The market penetration of single-use technologies in upstream and downstream bioprocessing is expanding significantly, moving from niche applications to mainstream adoption. For instance, the market size is estimated to reach approximately $25,000 million by 2033, up from an estimated $9,000 million in 2025. The historical period (2019-2024) has laid a strong foundation, with consistent growth driven by early adopters and the proven benefits of single-use solutions in reducing cross-contamination and accelerating process development timelines. The market is evolving from a focus on disposable bags and bioreactors to more integrated, end-to-end single-use workflow solutions.
Dominant Regions, Countries, or Segments in Single Use Bioprocessing Industry
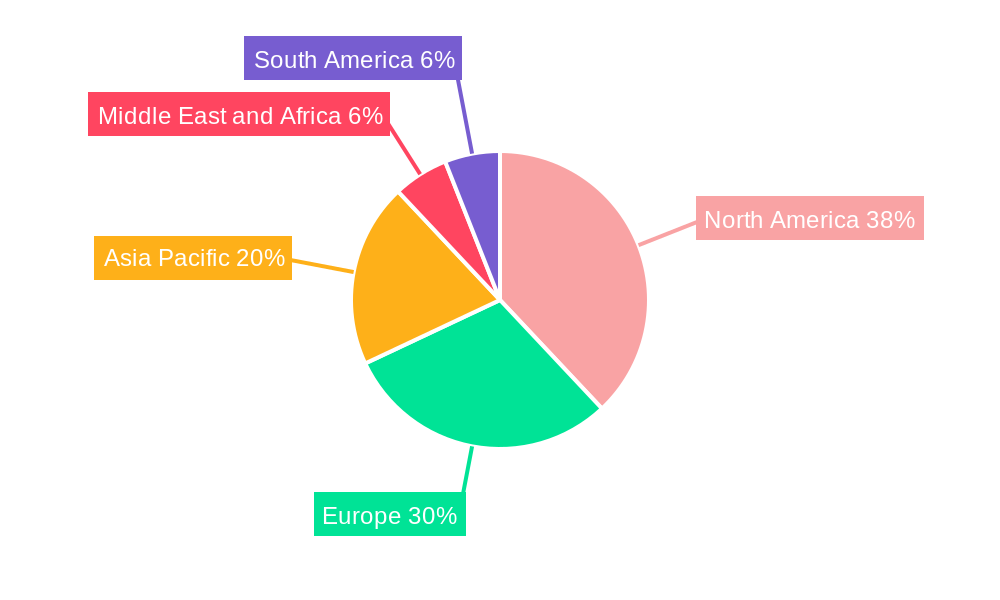
North America, particularly the United States, stands as the dominant region in the Single Use Bioprocessing industry. This dominance is fueled by several key drivers: a robust biopharmaceutical manufacturing sector with a high concentration of leading drug developers, significant government investment in life sciences research and development, and a well-established regulatory framework that supports the adoption of advanced manufacturing technologies. The region’s strong academic and clinical research infrastructure also contributes significantly to the demand for single-use solutions for experimental and pilot-scale production.
Within the product segments, Disposable/Single-use Bioreactors are currently driving market growth. Their increasing sophistication, scalability, and suitability for a wide range of cell culture applications, from small-scale research to large-scale commercial production, make them indispensable for biologics manufacturing. The estimated market share for disposable bioreactors is around 30% of the total single-use bioprocessing market. Media Bags and Containers also represent a substantial segment, crucial for media preparation, storage, and transport, with an estimated market share of 25%. Filtration Assemblies are vital for downstream processing and purification, holding an estimated 20% market share.
In terms of applications, Cell Culture is the primary application driving demand for single-use bioprocessing technologies, accounting for an estimated 45% of the market. This is directly linked to the increasing production of monoclonal antibodies and other cell-based therapies. Filtration processes, essential for both upstream and downstream steps, represent another significant application, with an estimated 30% market share. Purification processes, crucial for isolating and refining biopharmaceutical products, constitute approximately 20% of the application market share.
The Biopharmaceutical Manufacturers segment is overwhelmingly the largest end-user, contributing an estimated 75% to the overall market revenue. Their need for flexible, efficient, and contamination-free manufacturing processes makes single-use solutions an attractive proposition. Academic and Clinical Research Institutes represent a smaller but growing end-user segment, estimated at 20%, utilizing single-use technologies for early-stage research, process development, and small-scale clinical trials.
The growth potential in North America is further amplified by supportive economic policies and a proactive approach to adopting new manufacturing technologies. The presence of major biopharmaceutical hubs, coupled with substantial R&D funding, ensures a continuous demand for cutting-edge bioprocessing solutions.
Single Use Bioprocessing Industry Product Landscape
The Single Use Bioprocessing product landscape is characterized by continuous innovation aimed at enhancing performance, scalability, and ease of use. Key product innovations include advanced, multi-layered film technologies for improved barrier properties in media bags and containers, reducing leachables and extractables. Disposable bioreactors are evolving with integrated sensors for real-time process monitoring and control, offering precise parameter management for cell culture. Novel single-use mixers are designed for enhanced shear sensitivity and efficient homogenization, crucial for sensitive biologics. Filtration assemblies are seeing advancements in membrane technologies, offering higher throughput and improved impurity removal. The unique selling proposition of these products lies in their ability to minimize cross-contamination, reduce validation and cleaning efforts, and provide rapid deployment for flexible manufacturing strategies, ultimately accelerating drug development timelines.
Key Drivers, Barriers & Challenges in Single Use Bioprocessing Industry
Key Drivers:
- Growing Biologics Market: The expanding demand for monoclonal antibodies, vaccines, and advanced therapies is a primary catalyst, necessitating flexible and scalable manufacturing.
- Technological Advancements: Innovations in materials science, sensor technology, and automation are enhancing the performance and efficiency of single-use systems.
- Reduced Capital Expenditure: Single-use solutions offer a lower upfront investment compared to traditional stainless-steel infrastructure, appealing to startups and established companies alike.
- Flexibility and Speed to Market: The ability to rapidly scale up or down production and reduce validation timelines accelerates drug development and commercialization.
- Contamination Control: The inherent sterility of single-use components significantly reduces the risk of cross-contamination, ensuring product quality and patient safety.
Barriers & Challenges:
- Waste Generation and Environmental Concerns: The disposable nature of these products raises concerns about plastic waste, driving the need for sustainable solutions and recycling initiatives. This is a significant challenge, estimated to increase waste disposal costs by 5-10% for manufacturers.
- Supply Chain Vulnerabilities: Reliance on specific suppliers for critical components can lead to disruptions, as highlighted by recent global supply chain issues. The lead times for certain critical single-use components can extend to over 6 months.
- Regulatory Scrutiny and Validation: Stringent regulatory requirements for leachables and extractables necessitate extensive validation processes, adding time and cost to product adoption.
- Cost of Consumables: While upfront capital investment is lower, the ongoing cost of disposable consumables can become significant for large-scale, continuous manufacturing processes.
- Scalability Limitations for Very Large Volumes: For extremely large-volume production, traditional stainless-steel systems may still offer cost advantages and a more established infrastructure.
Emerging Opportunities in Single Use Bioprocessing Industry
Emerging opportunities in the Single Use Bioprocessing industry lie in the development of more sustainable and eco-friendly disposable solutions, such as biodegradable materials or enhanced recycling programs, addressing growing environmental concerns. The expansion of single-use technologies into novel therapeutic areas, including cell and gene therapies, presents a significant growth avenue. Furthermore, the integration of advanced automation and artificial intelligence (AI) into single-use workflows offers opportunities for enhanced process control, data analytics, and predictive maintenance. The growing trend of decentralized manufacturing and the rise of Contract Development and Manufacturing Organizations (CDMOs) also present substantial opportunities for single-use solution providers.
Growth Accelerators in the Single Use Bioprocessing Industry Industry
The long-term growth of the Single Use Bioprocessing industry is being significantly accelerated by several key catalysts. Technological breakthroughs in materials science, leading to more robust, inert, and cost-effective disposable components, are continuously pushing the boundaries of what's possible. Strategic partnerships between single-use technology providers and biopharmaceutical companies, focused on co-development and customized solutions, are fostering innovation and market adoption. Furthermore, market expansion strategies targeting emerging economies with growing biopharmaceutical sectors, alongside increased government incentives for domestic drug manufacturing, are creating new avenues for growth. The development of modular and scalable single-use manufacturing platforms also plays a crucial role in accelerating the deployment of new therapies.
Key Players Shaping the Single Use Bioprocessing Industry Market
- Merck KGaA
- PBS Biotech Inc
- Boehringer Ingelheim International GmbH
- 3M
- Danaher Corporation (Cytiva)
- Distek Inc
- Eppendorf AG
- Sartorius AG
- CESCO Bioengineering Co Ltd
- ABEC Inc
- Celltainer Biotech BV
- OmniBRx Biotechnologies
- Thermo Fisher Scientific
Notable Milestones in Single Use Bioprocessing Industry Sector
- October 2022: PharmNXT Biotech launched its first integrated manufacturing unit in Pune to provide single-use bioprocessing solutions. With this launch, the facility addresses the challenges to biologics manufacturing in India.
- October 2022: Single Use Support GmbH, an Austrian solution provider, expanded its product portfolio with new single-use bioprocess containers under the brand name IRIS. This expansion assists the company in the robust storage and shipping of drug substances with IRIS single-use bags in RoSS Shell.
In-Depth Single Use Bioprocessing Industry Market Outlook
The future outlook for the Single Use Bioprocessing industry is exceptionally promising, driven by ongoing innovation and expanding applications. Growth accelerators such as the development of fully integrated, automated single-use manufacturing suites, coupled with advanced data analytics and AI for process optimization, will be pivotal. Strategic partnerships and collaborations will continue to foster the development of bespoke solutions for complex biologics and personalized medicines. The increasing adoption of single-use technologies in emerging markets, supported by favorable government policies and growing biopharmaceutical investments, will further fuel market expansion. Opportunities in areas like continuous manufacturing and the growing demand for biosimilars will also contribute to sustained growth. The industry is poised for significant transformation, with single-use solutions becoming the cornerstone of flexible, efficient, and sustainable biopharmaceutical manufacturing.
Single Use Bioprocessing Industry Segmentation
-
1. Product
- 1.1. Filtration Assemblies
- 1.2. Media Bags and Containers
- 1.3. Disposable/Single-use Bioreactors
- 1.4. Disposable Mixers
- 1.5. Other Products
-
2. Application
- 2.1. Filtration
- 2.2. Cell Culture
- 2.3. Purification
- 2.4. Other Applications
-
3. End User
- 3.1. Biopharmaceutical Manufacturers
- 3.2. Academic and Clinical Research Institutes
- 3.3. Other End Users
Single Use Bioprocessing Industry Segmentation By Geography
-
1. North America
- 1.1. United States
- 1.2. Canada
- 1.3. Mexico
-
2. Europe
- 2.1. Germany
- 2.2. United Kingdom
- 2.3. France
- 2.4. Italy
- 2.5. Spain
- 2.6. Rest of Europe
-
3. Asia Pacific
- 3.1. China
- 3.2. Japan
- 3.3. India
- 3.4. Australia
- 3.5. South Korea
- 3.6. Rest of Asia Pacific
-
4. Middle East and Africa
- 4.1. GCC
- 4.2. South Africa
- 4.3. Rest of Middle East and Africa
-
5. South America
- 5.1. Brazil
- 5.2. Argentina
- 5.3. Rest of South America
Single Use Bioprocessing Industry Regional Market Share
Geographic Coverage of Single Use Bioprocessing Industry
Single Use Bioprocessing Industry REPORT HIGHLIGHTS
| Aspects | Details |
|---|---|
| Study Period | 2020-2034 |
| Base Year | 2025 |
| Estimated Year | 2026 |
| Forecast Period | 2026-2034 |
| Historical Period | 2020-2025 |
| Growth Rate | CAGR of 16.27% from 2020-2034 |
| Segmentation |
|
Table of Contents
- 1. Introduction
- 1.1. Research Scope
- 1.2. Market Segmentation
- 1.3. Research Methodology
- 1.4. Definitions and Assumptions
- 2. Executive Summary
- 2.1. Introduction
- 3. Market Dynamics
- 3.1. Introduction
- 3.2. Market Drivers
- 3.2.1. Faster Implementation and Lower Risk of Product Cross-contamination; Increasing Demand for Biopharmaceuticals; Lower Costs and Lesser Environmental Impact of Single-use Bioprocessing Technologies
- 3.3. Market Restrains
- 3.3.1. Issues Related to Leachables and Extractables
- 3.4. Market Trends
- 3.4.1. Biopharmaceutical Manufacturer Segment is Expected to Witness Significant Growth Over the Forecast Period
- 4. Market Factor Analysis
- 4.1. Porters Five Forces
- 4.2. Supply/Value Chain
- 4.3. PESTEL analysis
- 4.4. Market Entropy
- 4.5. Patent/Trademark Analysis
- 5. Global Single Use Bioprocessing Industry Analysis, Insights and Forecast, 2020-2032
- 5.1. Market Analysis, Insights and Forecast - by Product
- 5.1.1. Filtration Assemblies
- 5.1.2. Media Bags and Containers
- 5.1.3. Disposable/Single-use Bioreactors
- 5.1.4. Disposable Mixers
- 5.1.5. Other Products
- 5.2. Market Analysis, Insights and Forecast - by Application
- 5.2.1. Filtration
- 5.2.2. Cell Culture
- 5.2.3. Purification
- 5.2.4. Other Applications
- 5.3. Market Analysis, Insights and Forecast - by End User
- 5.3.1. Biopharmaceutical Manufacturers
- 5.3.2. Academic and Clinical Research Institutes
- 5.3.3. Other End Users
- 5.4. Market Analysis, Insights and Forecast - by Region
- 5.4.1. North America
- 5.4.2. Europe
- 5.4.3. Asia Pacific
- 5.4.4. Middle East and Africa
- 5.4.5. South America
- 5.1. Market Analysis, Insights and Forecast - by Product
- 6. North America Single Use Bioprocessing Industry Analysis, Insights and Forecast, 2020-2032
- 6.1. Market Analysis, Insights and Forecast - by Product
- 6.1.1. Filtration Assemblies
- 6.1.2. Media Bags and Containers
- 6.1.3. Disposable/Single-use Bioreactors
- 6.1.4. Disposable Mixers
- 6.1.5. Other Products
- 6.2. Market Analysis, Insights and Forecast - by Application
- 6.2.1. Filtration
- 6.2.2. Cell Culture
- 6.2.3. Purification
- 6.2.4. Other Applications
- 6.3. Market Analysis, Insights and Forecast - by End User
- 6.3.1. Biopharmaceutical Manufacturers
- 6.3.2. Academic and Clinical Research Institutes
- 6.3.3. Other End Users
- 6.1. Market Analysis, Insights and Forecast - by Product
- 7. Europe Single Use Bioprocessing Industry Analysis, Insights and Forecast, 2020-2032
- 7.1. Market Analysis, Insights and Forecast - by Product
- 7.1.1. Filtration Assemblies
- 7.1.2. Media Bags and Containers
- 7.1.3. Disposable/Single-use Bioreactors
- 7.1.4. Disposable Mixers
- 7.1.5. Other Products
- 7.2. Market Analysis, Insights and Forecast - by Application
- 7.2.1. Filtration
- 7.2.2. Cell Culture
- 7.2.3. Purification
- 7.2.4. Other Applications
- 7.3. Market Analysis, Insights and Forecast - by End User
- 7.3.1. Biopharmaceutical Manufacturers
- 7.3.2. Academic and Clinical Research Institutes
- 7.3.3. Other End Users
- 7.1. Market Analysis, Insights and Forecast - by Product
- 8. Asia Pacific Single Use Bioprocessing Industry Analysis, Insights and Forecast, 2020-2032
- 8.1. Market Analysis, Insights and Forecast - by Product
- 8.1.1. Filtration Assemblies
- 8.1.2. Media Bags and Containers
- 8.1.3. Disposable/Single-use Bioreactors
- 8.1.4. Disposable Mixers
- 8.1.5. Other Products
- 8.2. Market Analysis, Insights and Forecast - by Application
- 8.2.1. Filtration
- 8.2.2. Cell Culture
- 8.2.3. Purification
- 8.2.4. Other Applications
- 8.3. Market Analysis, Insights and Forecast - by End User
- 8.3.1. Biopharmaceutical Manufacturers
- 8.3.2. Academic and Clinical Research Institutes
- 8.3.3. Other End Users
- 8.1. Market Analysis, Insights and Forecast - by Product
- 9. Middle East and Africa Single Use Bioprocessing Industry Analysis, Insights and Forecast, 2020-2032
- 9.1. Market Analysis, Insights and Forecast - by Product
- 9.1.1. Filtration Assemblies
- 9.1.2. Media Bags and Containers
- 9.1.3. Disposable/Single-use Bioreactors
- 9.1.4. Disposable Mixers
- 9.1.5. Other Products
- 9.2. Market Analysis, Insights and Forecast - by Application
- 9.2.1. Filtration
- 9.2.2. Cell Culture
- 9.2.3. Purification
- 9.2.4. Other Applications
- 9.3. Market Analysis, Insights and Forecast - by End User
- 9.3.1. Biopharmaceutical Manufacturers
- 9.3.2. Academic and Clinical Research Institutes
- 9.3.3. Other End Users
- 9.1. Market Analysis, Insights and Forecast - by Product
- 10. South America Single Use Bioprocessing Industry Analysis, Insights and Forecast, 2020-2032
- 10.1. Market Analysis, Insights and Forecast - by Product
- 10.1.1. Filtration Assemblies
- 10.1.2. Media Bags and Containers
- 10.1.3. Disposable/Single-use Bioreactors
- 10.1.4. Disposable Mixers
- 10.1.5. Other Products
- 10.2. Market Analysis, Insights and Forecast - by Application
- 10.2.1. Filtration
- 10.2.2. Cell Culture
- 10.2.3. Purification
- 10.2.4. Other Applications
- 10.3. Market Analysis, Insights and Forecast - by End User
- 10.3.1. Biopharmaceutical Manufacturers
- 10.3.2. Academic and Clinical Research Institutes
- 10.3.3. Other End Users
- 10.1. Market Analysis, Insights and Forecast - by Product
- 11. Competitive Analysis
- 11.1. Global Market Share Analysis 2025
- 11.2. Company Profiles
- 11.2.1 Merck KGaA
- 11.2.1.1. Overview
- 11.2.1.2. Products
- 11.2.1.3. SWOT Analysis
- 11.2.1.4. Recent Developments
- 11.2.1.5. Financials (Based on Availability)
- 11.2.2 PBS Biotech Inc
- 11.2.2.1. Overview
- 11.2.2.2. Products
- 11.2.2.3. SWOT Analysis
- 11.2.2.4. Recent Developments
- 11.2.2.5. Financials (Based on Availability)
- 11.2.3 Boehringer Ingelheim International GmbH
- 11.2.3.1. Overview
- 11.2.3.2. Products
- 11.2.3.3. SWOT Analysis
- 11.2.3.4. Recent Developments
- 11.2.3.5. Financials (Based on Availability)
- 11.2.4 3M
- 11.2.4.1. Overview
- 11.2.4.2. Products
- 11.2.4.3. SWOT Analysis
- 11.2.4.4. Recent Developments
- 11.2.4.5. Financials (Based on Availability)
- 11.2.5 Danaher Corporation (Cytiva)
- 11.2.5.1. Overview
- 11.2.5.2. Products
- 11.2.5.3. SWOT Analysis
- 11.2.5.4. Recent Developments
- 11.2.5.5. Financials (Based on Availability)
- 11.2.6 Distek Inc
- 11.2.6.1. Overview
- 11.2.6.2. Products
- 11.2.6.3. SWOT Analysis
- 11.2.6.4. Recent Developments
- 11.2.6.5. Financials (Based on Availability)
- 11.2.7 Eppendorf AG
- 11.2.7.1. Overview
- 11.2.7.2. Products
- 11.2.7.3. SWOT Analysis
- 11.2.7.4. Recent Developments
- 11.2.7.5. Financials (Based on Availability)
- 11.2.8 Sartorius AG
- 11.2.8.1. Overview
- 11.2.8.2. Products
- 11.2.8.3. SWOT Analysis
- 11.2.8.4. Recent Developments
- 11.2.8.5. Financials (Based on Availability)
- 11.2.9 CESCO Bioengineering Co Ltd
- 11.2.9.1. Overview
- 11.2.9.2. Products
- 11.2.9.3. SWOT Analysis
- 11.2.9.4. Recent Developments
- 11.2.9.5. Financials (Based on Availability)
- 11.2.10 ABEC Inc
- 11.2.10.1. Overview
- 11.2.10.2. Products
- 11.2.10.3. SWOT Analysis
- 11.2.10.4. Recent Developments
- 11.2.10.5. Financials (Based on Availability)
- 11.2.11 Celltainer Biotech BV
- 11.2.11.1. Overview
- 11.2.11.2. Products
- 11.2.11.3. SWOT Analysis
- 11.2.11.4. Recent Developments
- 11.2.11.5. Financials (Based on Availability)
- 11.2.12 OmniBRx Biotechnologies
- 11.2.12.1. Overview
- 11.2.12.2. Products
- 11.2.12.3. SWOT Analysis
- 11.2.12.4. Recent Developments
- 11.2.12.5. Financials (Based on Availability)
- 11.2.13 Thermo Fisher Scientific
- 11.2.13.1. Overview
- 11.2.13.2. Products
- 11.2.13.3. SWOT Analysis
- 11.2.13.4. Recent Developments
- 11.2.13.5. Financials (Based on Availability)
- 11.2.1 Merck KGaA
List of Figures
- Figure 1: Global Single Use Bioprocessing Industry Revenue Breakdown (billion, %) by Region 2025 & 2033
- Figure 2: North America Single Use Bioprocessing Industry Revenue (billion), by Product 2025 & 2033
- Figure 3: North America Single Use Bioprocessing Industry Revenue Share (%), by Product 2025 & 2033
- Figure 4: North America Single Use Bioprocessing Industry Revenue (billion), by Application 2025 & 2033
- Figure 5: North America Single Use Bioprocessing Industry Revenue Share (%), by Application 2025 & 2033
- Figure 6: North America Single Use Bioprocessing Industry Revenue (billion), by End User 2025 & 2033
- Figure 7: North America Single Use Bioprocessing Industry Revenue Share (%), by End User 2025 & 2033
- Figure 8: North America Single Use Bioprocessing Industry Revenue (billion), by Country 2025 & 2033
- Figure 9: North America Single Use Bioprocessing Industry Revenue Share (%), by Country 2025 & 2033
- Figure 10: Europe Single Use Bioprocessing Industry Revenue (billion), by Product 2025 & 2033
- Figure 11: Europe Single Use Bioprocessing Industry Revenue Share (%), by Product 2025 & 2033
- Figure 12: Europe Single Use Bioprocessing Industry Revenue (billion), by Application 2025 & 2033
- Figure 13: Europe Single Use Bioprocessing Industry Revenue Share (%), by Application 2025 & 2033
- Figure 14: Europe Single Use Bioprocessing Industry Revenue (billion), by End User 2025 & 2033
- Figure 15: Europe Single Use Bioprocessing Industry Revenue Share (%), by End User 2025 & 2033
- Figure 16: Europe Single Use Bioprocessing Industry Revenue (billion), by Country 2025 & 2033
- Figure 17: Europe Single Use Bioprocessing Industry Revenue Share (%), by Country 2025 & 2033
- Figure 18: Asia Pacific Single Use Bioprocessing Industry Revenue (billion), by Product 2025 & 2033
- Figure 19: Asia Pacific Single Use Bioprocessing Industry Revenue Share (%), by Product 2025 & 2033
- Figure 20: Asia Pacific Single Use Bioprocessing Industry Revenue (billion), by Application 2025 & 2033
- Figure 21: Asia Pacific Single Use Bioprocessing Industry Revenue Share (%), by Application 2025 & 2033
- Figure 22: Asia Pacific Single Use Bioprocessing Industry Revenue (billion), by End User 2025 & 2033
- Figure 23: Asia Pacific Single Use Bioprocessing Industry Revenue Share (%), by End User 2025 & 2033
- Figure 24: Asia Pacific Single Use Bioprocessing Industry Revenue (billion), by Country 2025 & 2033
- Figure 25: Asia Pacific Single Use Bioprocessing Industry Revenue Share (%), by Country 2025 & 2033
- Figure 26: Middle East and Africa Single Use Bioprocessing Industry Revenue (billion), by Product 2025 & 2033
- Figure 27: Middle East and Africa Single Use Bioprocessing Industry Revenue Share (%), by Product 2025 & 2033
- Figure 28: Middle East and Africa Single Use Bioprocessing Industry Revenue (billion), by Application 2025 & 2033
- Figure 29: Middle East and Africa Single Use Bioprocessing Industry Revenue Share (%), by Application 2025 & 2033
- Figure 30: Middle East and Africa Single Use Bioprocessing Industry Revenue (billion), by End User 2025 & 2033
- Figure 31: Middle East and Africa Single Use Bioprocessing Industry Revenue Share (%), by End User 2025 & 2033
- Figure 32: Middle East and Africa Single Use Bioprocessing Industry Revenue (billion), by Country 2025 & 2033
- Figure 33: Middle East and Africa Single Use Bioprocessing Industry Revenue Share (%), by Country 2025 & 2033
- Figure 34: South America Single Use Bioprocessing Industry Revenue (billion), by Product 2025 & 2033
- Figure 35: South America Single Use Bioprocessing Industry Revenue Share (%), by Product 2025 & 2033
- Figure 36: South America Single Use Bioprocessing Industry Revenue (billion), by Application 2025 & 2033
- Figure 37: South America Single Use Bioprocessing Industry Revenue Share (%), by Application 2025 & 2033
- Figure 38: South America Single Use Bioprocessing Industry Revenue (billion), by End User 2025 & 2033
- Figure 39: South America Single Use Bioprocessing Industry Revenue Share (%), by End User 2025 & 2033
- Figure 40: South America Single Use Bioprocessing Industry Revenue (billion), by Country 2025 & 2033
- Figure 41: South America Single Use Bioprocessing Industry Revenue Share (%), by Country 2025 & 2033
List of Tables
- Table 1: Global Single Use Bioprocessing Industry Revenue billion Forecast, by Product 2020 & 2033
- Table 2: Global Single Use Bioprocessing Industry Revenue billion Forecast, by Application 2020 & 2033
- Table 3: Global Single Use Bioprocessing Industry Revenue billion Forecast, by End User 2020 & 2033
- Table 4: Global Single Use Bioprocessing Industry Revenue billion Forecast, by Region 2020 & 2033
- Table 5: Global Single Use Bioprocessing Industry Revenue billion Forecast, by Product 2020 & 2033
- Table 6: Global Single Use Bioprocessing Industry Revenue billion Forecast, by Application 2020 & 2033
- Table 7: Global Single Use Bioprocessing Industry Revenue billion Forecast, by End User 2020 & 2033
- Table 8: Global Single Use Bioprocessing Industry Revenue billion Forecast, by Country 2020 & 2033
- Table 9: United States Single Use Bioprocessing Industry Revenue (billion) Forecast, by Application 2020 & 2033
- Table 10: Canada Single Use Bioprocessing Industry Revenue (billion) Forecast, by Application 2020 & 2033
- Table 11: Mexico Single Use Bioprocessing Industry Revenue (billion) Forecast, by Application 2020 & 2033
- Table 12: Global Single Use Bioprocessing Industry Revenue billion Forecast, by Product 2020 & 2033
- Table 13: Global Single Use Bioprocessing Industry Revenue billion Forecast, by Application 2020 & 2033
- Table 14: Global Single Use Bioprocessing Industry Revenue billion Forecast, by End User 2020 & 2033
- Table 15: Global Single Use Bioprocessing Industry Revenue billion Forecast, by Country 2020 & 2033
- Table 16: Germany Single Use Bioprocessing Industry Revenue (billion) Forecast, by Application 2020 & 2033
- Table 17: United Kingdom Single Use Bioprocessing Industry Revenue (billion) Forecast, by Application 2020 & 2033
- Table 18: France Single Use Bioprocessing Industry Revenue (billion) Forecast, by Application 2020 & 2033
- Table 19: Italy Single Use Bioprocessing Industry Revenue (billion) Forecast, by Application 2020 & 2033
- Table 20: Spain Single Use Bioprocessing Industry Revenue (billion) Forecast, by Application 2020 & 2033
- Table 21: Rest of Europe Single Use Bioprocessing Industry Revenue (billion) Forecast, by Application 2020 & 2033
- Table 22: Global Single Use Bioprocessing Industry Revenue billion Forecast, by Product 2020 & 2033
- Table 23: Global Single Use Bioprocessing Industry Revenue billion Forecast, by Application 2020 & 2033
- Table 24: Global Single Use Bioprocessing Industry Revenue billion Forecast, by End User 2020 & 2033
- Table 25: Global Single Use Bioprocessing Industry Revenue billion Forecast, by Country 2020 & 2033
- Table 26: China Single Use Bioprocessing Industry Revenue (billion) Forecast, by Application 2020 & 2033
- Table 27: Japan Single Use Bioprocessing Industry Revenue (billion) Forecast, by Application 2020 & 2033
- Table 28: India Single Use Bioprocessing Industry Revenue (billion) Forecast, by Application 2020 & 2033
- Table 29: Australia Single Use Bioprocessing Industry Revenue (billion) Forecast, by Application 2020 & 2033
- Table 30: South Korea Single Use Bioprocessing Industry Revenue (billion) Forecast, by Application 2020 & 2033
- Table 31: Rest of Asia Pacific Single Use Bioprocessing Industry Revenue (billion) Forecast, by Application 2020 & 2033
- Table 32: Global Single Use Bioprocessing Industry Revenue billion Forecast, by Product 2020 & 2033
- Table 33: Global Single Use Bioprocessing Industry Revenue billion Forecast, by Application 2020 & 2033
- Table 34: Global Single Use Bioprocessing Industry Revenue billion Forecast, by End User 2020 & 2033
- Table 35: Global Single Use Bioprocessing Industry Revenue billion Forecast, by Country 2020 & 2033
- Table 36: GCC Single Use Bioprocessing Industry Revenue (billion) Forecast, by Application 2020 & 2033
- Table 37: South Africa Single Use Bioprocessing Industry Revenue (billion) Forecast, by Application 2020 & 2033
- Table 38: Rest of Middle East and Africa Single Use Bioprocessing Industry Revenue (billion) Forecast, by Application 2020 & 2033
- Table 39: Global Single Use Bioprocessing Industry Revenue billion Forecast, by Product 2020 & 2033
- Table 40: Global Single Use Bioprocessing Industry Revenue billion Forecast, by Application 2020 & 2033
- Table 41: Global Single Use Bioprocessing Industry Revenue billion Forecast, by End User 2020 & 2033
- Table 42: Global Single Use Bioprocessing Industry Revenue billion Forecast, by Country 2020 & 2033
- Table 43: Brazil Single Use Bioprocessing Industry Revenue (billion) Forecast, by Application 2020 & 2033
- Table 44: Argentina Single Use Bioprocessing Industry Revenue (billion) Forecast, by Application 2020 & 2033
- Table 45: Rest of South America Single Use Bioprocessing Industry Revenue (billion) Forecast, by Application 2020 & 2033
Frequently Asked Questions
1. What is the projected Compound Annual Growth Rate (CAGR) of the Single Use Bioprocessing Industry?
The projected CAGR is approximately 16.27%.
2. Which companies are prominent players in the Single Use Bioprocessing Industry?
Key companies in the market include Merck KGaA, PBS Biotech Inc, Boehringer Ingelheim International GmbH, 3M, Danaher Corporation (Cytiva), Distek Inc, Eppendorf AG, Sartorius AG, CESCO Bioengineering Co Ltd, ABEC Inc, Celltainer Biotech BV, OmniBRx Biotechnologies, Thermo Fisher Scientific.
3. What are the main segments of the Single Use Bioprocessing Industry?
The market segments include Product, Application, End User.
4. Can you provide details about the market size?
The market size is estimated to be USD 151.48 billion as of 2022.
5. What are some drivers contributing to market growth?
Faster Implementation and Lower Risk of Product Cross-contamination; Increasing Demand for Biopharmaceuticals; Lower Costs and Lesser Environmental Impact of Single-use Bioprocessing Technologies.
6. What are the notable trends driving market growth?
Biopharmaceutical Manufacturer Segment is Expected to Witness Significant Growth Over the Forecast Period.
7. Are there any restraints impacting market growth?
Issues Related to Leachables and Extractables.
8. Can you provide examples of recent developments in the market?
October 2022: PharmNXT Biotech launched its first integrated manufacturing unit in Pune to provide single-use bioprocessing solutions. With this launch, the facility addresses the challenges to biologics manufacturing in India.
9. What pricing options are available for accessing the report?
Pricing options include single-user, multi-user, and enterprise licenses priced at USD 4750, USD 5250, and USD 8750 respectively.
10. Is the market size provided in terms of value or volume?
The market size is provided in terms of value, measured in billion.
11. Are there any specific market keywords associated with the report?
Yes, the market keyword associated with the report is "Single Use Bioprocessing Industry," which aids in identifying and referencing the specific market segment covered.
12. How do I determine which pricing option suits my needs best?
The pricing options vary based on user requirements and access needs. Individual users may opt for single-user licenses, while businesses requiring broader access may choose multi-user or enterprise licenses for cost-effective access to the report.
13. Are there any additional resources or data provided in the Single Use Bioprocessing Industry report?
While the report offers comprehensive insights, it's advisable to review the specific contents or supplementary materials provided to ascertain if additional resources or data are available.
14. How can I stay updated on further developments or reports in the Single Use Bioprocessing Industry?
To stay informed about further developments, trends, and reports in the Single Use Bioprocessing Industry, consider subscribing to industry newsletters, following relevant companies and organizations, or regularly checking reputable industry news sources and publications.
Methodology
Step 1 - Identification of Relevant Samples Size from Population Database


Step 2 - Approaches for Defining Global Market Size (Value, Volume* & Price*)

Note*: In applicable scenarios
Step 3 - Data Sources
Primary Research
- Web Analytics
- Survey Reports
- Research Institute
- Latest Research Reports
- Opinion Leaders
Secondary Research
- Annual Reports
- White Paper
- Latest Press Release
- Industry Association
- Paid Database
- Investor Presentations

Step 4 - Data Triangulation
Involves using different sources of information in order to increase the validity of a study
These sources are likely to be stakeholders in a program - participants, other researchers, program staff, other community members, and so on.
Then we put all data in single framework & apply various statistical tools to find out the dynamic on the market.
During the analysis stage, feedback from the stakeholder groups would be compared to determine areas of agreement as well as areas of divergence