

Key Insights
The South American water treatment chemicals market is poised for significant expansion, driven by rapid industrialization, urbanization, and increasingly stringent environmental regulations. This dynamic sector is projected to achieve a compound annual growth rate (CAGR) of 7.4%, with an estimated market size of $2.9 billion in the base year 2024. Key growth drivers include the escalating demand for safe potable water in burgeoning urban centers, the agricultural sector's need for advanced irrigation solutions, and the critical requirement for effective wastewater treatment to combat pollution. Heightened awareness of water scarcity and its associated health impacts is also spurring investment in sophisticated water treatment technologies and, consequently, specialized chemicals. Leading companies such as Nouryon, Ecolab, Solenis, and Kemira are actively expanding their regional footprint through strategic alliances and innovative product development, catering to diverse applications in municipal water, industrial processes, and power generation.
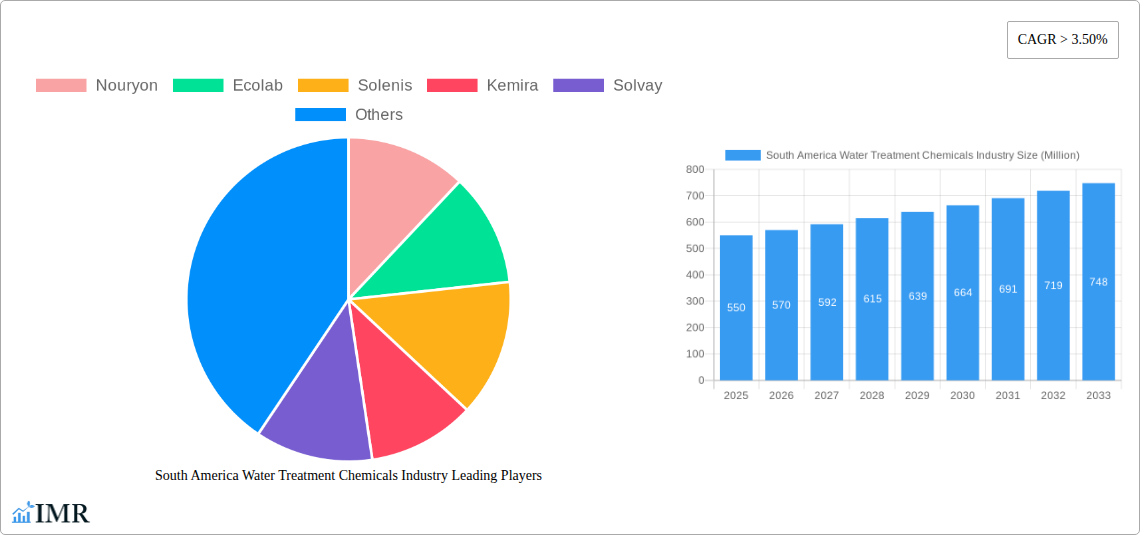
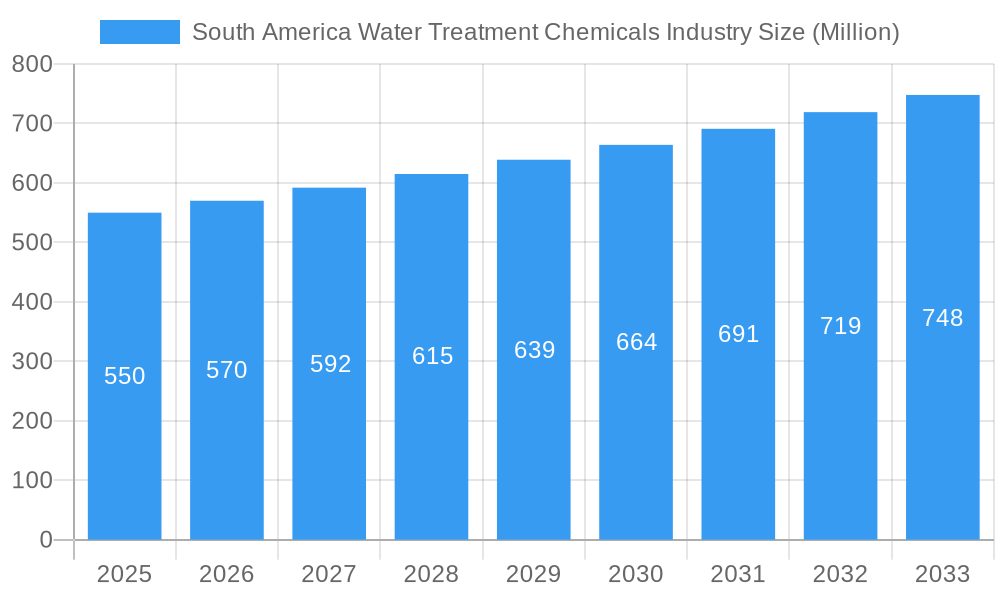
South America Water Treatment Chemicals Industry Market Size (In Billion)
While economic volatility in select South American economies, regional infrastructure deficits, and fluctuating raw material prices present potential headwinds, the long-term market outlook remains exceptionally strong. Sustained government investment in water infrastructure and growing private sector engagement in water management initiatives provide a robust foundation for continued growth. The market is further delineated by chemical types, including coagulants, flocculants, and disinfectants, and application segments such as municipal and industrial uses. The forecast period through 2033 indicates sustained expansion, solidifying the South American water treatment chemicals market as a compelling investment opportunity.
South America Water Treatment Chemicals Industry Company Market Share
South America Water Treatment Chemicals Market: A Comprehensive Report (2019-2033)
This in-depth report provides a comprehensive analysis of the South America water treatment chemicals market, encompassing market dynamics, growth trends, regional performance, key players, and future outlook. The study period covers 2019-2033, with 2025 as the base and estimated year. The report offers invaluable insights for industry professionals, investors, and strategic decision-makers seeking to navigate this dynamic market. Market values are presented in million units.
South America Water Treatment Chemicals Industry Market Dynamics & Structure
This section analyzes the market concentration, technological innovation, regulatory landscape, competitive substitutes, end-user demographics, and mergers & acquisitions (M&A) activity within the South American water treatment chemicals industry. The market is moderately concentrated, with a few major players holding significant market share, while smaller companies focus on niche segments. Technological innovation is driven by the need for more efficient and sustainable water treatment solutions, particularly in addressing water scarcity challenges. Stringent environmental regulations are shaping product development and adoption. Competitive pressure comes from substitute technologies and increasing price competition. End-user demographics are diverse, spanning municipal water treatment, industrial applications, and the agricultural sector. M&A activity is driven by consolidation efforts and the pursuit of technological expertise.
- Market Concentration: Moderate, with top 5 players holding approximately xx% market share in 2025 (estimated).
- Technological Innovation Drivers: Sustainability concerns, stricter environmental regulations, and demand for advanced treatment solutions.
- Regulatory Framework: Varying across South American countries, generally focused on water quality and environmental protection.
- Competitive Product Substitutes: Alternative treatment technologies like membrane filtration and advanced oxidation processes.
- End-User Demographics: Municipal water utilities (xx%), industrial users (xx%), and agricultural sector (xx%).
- M&A Trends: Consolidation expected to continue, driven by economies of scale and access to technology. Estimated xx M&A deals between 2019-2024.
South America Water Treatment Chemicals Industry Growth Trends & Insights
The South American water treatment chemicals market has witnessed significant growth over the past few years, driven by factors such as increasing industrialization, urbanization, and stringent environmental regulations. This section provides a detailed analysis of market size evolution, adoption rates, technological disruptions, and shifts in consumer behavior using detailed data analysis and projections through 2033. The market is expected to exhibit a CAGR of xx% during the forecast period (2025-2033), with notable growth in specific segments like industrial water treatment and agricultural applications. Technological advancements, such as nanotechnology and AI-driven optimization, are transforming market dynamics and influencing adoption rates. Consumer behavior is shifting towards sustainable and environmentally friendly water treatment solutions. Market penetration of advanced treatment technologies is gradually increasing.
Dominant Regions, Countries, or Segments in South America Water Treatment Chemicals Industry
Brazil, Mexico, and Colombia represent the largest markets within South America. This section analyzes the dominant regions and segments driving market growth. Factors contributing to regional dominance include robust economic growth, expanding industrial sectors, supportive government policies, and investments in water infrastructure. The industrial segment holds the largest share, followed by municipal and agricultural segments. Significant opportunities exist in less-developed regions, with potential for accelerated growth driven by infrastructure investments and rising demand.
- Key Drivers in Brazil: Strong industrial base, significant investments in water infrastructure, and government initiatives.
- Key Drivers in Mexico: Rapid industrialization, increasing population, and growing demand for clean water.
- Key Drivers in Colombia: Expanding mining and agriculture sectors, along with efforts to improve water quality.
- Dominant Segment: Industrial water treatment, driven by high demand from various industries.
South America Water Treatment Chemicals Industry Product Landscape
The product landscape is characterized by a wide range of chemicals, including coagulants, flocculants, disinfectants, and corrosion inhibitors. Innovations focus on improving efficiency, reducing environmental impact, and enhancing performance. Unique selling propositions often center on enhanced efficacy, reduced dosage requirements, and improved sustainability profiles. Advancements in polymer chemistry and nanotechnology are driving the development of next-generation water treatment solutions.
Key Drivers, Barriers & Challenges in South America Water Treatment Chemicals Industry
Key Drivers:
- Increasing urbanization and industrialization leading to higher water demand.
- Stringent environmental regulations emphasizing water quality and pollution control.
- Growing investments in water infrastructure projects.
Challenges and Restraints:
- Economic fluctuations impacting investment decisions in water treatment infrastructure.
- Supply chain disruptions affecting raw material availability and pricing.
- Competition from alternative water treatment technologies.
Emerging Opportunities in South America Water Treatment Chemicals Industry
Emerging opportunities exist in untapped markets within the region, such as smaller municipalities and rural areas. Innovative applications of water treatment technologies in emerging sectors, such as desalination and wastewater reuse, offer significant growth potential. The evolving consumer preference for sustainable solutions drives the demand for eco-friendly water treatment chemicals.
Growth Accelerators in the South America Water Treatment Chemicals Industry Industry
Technological breakthroughs in water treatment processes are a major growth driver. Strategic partnerships between chemical manufacturers and water treatment companies are facilitating market expansion. Government initiatives and policy support focusing on water security and environmental protection contribute to the industry's growth.
Notable Milestones in South America Water Treatment Chemicals Industry Sector
- 2021: Launch of a new generation of biodegradable coagulant by [Company Name].
- 2022: Acquisition of [Company A] by [Company B], expanding market presence in [Country].
- 2023: Introduction of stricter environmental regulations in [Country], driving adoption of advanced treatment solutions.
In-Depth South America Water Treatment Chemicals Industry Market Outlook
The South American water treatment chemicals market is poised for substantial growth over the next decade, driven by a confluence of factors, including robust economic growth, investments in water infrastructure, and increasingly stringent environmental regulations. Strategic partnerships, technological innovation, and expansion into untapped markets will play a critical role in shaping the industry's future. Opportunities exist in developing sustainable and efficient water treatment solutions, catering to the specific needs of various end-user segments.
South America Water Treatment Chemicals Industry Segmentation
-
1. Product Type
- 1.1. Flocculant & Coagulants
- 1.2. Biocides & Disinfectants
- 1.3. Defoamers & Defoaming Agents
- 1.4. pH & Adjusters & Softeners
- 1.5. Scale & Corrosion Inhibitors
- 1.6. Others
-
2. End-user Industry
- 2.1. Power
- 2.2. Oil & Gas
- 2.3. Chemical Manufcaturing
- 2.4. Mining & Mineral Processing
- 2.5. Mining and Mineral Processing
- 2.6. Food & Beverage
- 2.7. Pulp & Ppaer
- 2.8. Others
-
3. Geography
- 3.1. Brazil
- 3.2. Argentina
- 3.3. Rest of South America
South America Water Treatment Chemicals Industry Segmentation By Geography
- 1. Brazil
- 2. Argentina
- 3. Rest of South America
South America Water Treatment Chemicals Industry Regional Market Share
Geographic Coverage of South America Water Treatment Chemicals Industry
South America Water Treatment Chemicals Industry REPORT HIGHLIGHTS
| Aspects | Details |
|---|---|
| Study Period | 2020-2034 |
| Base Year | 2025 |
| Estimated Year | 2026 |
| Forecast Period | 2026-2034 |
| Historical Period | 2020-2025 |
| Growth Rate | CAGR of 7.4% from 2020-2034 |
| Segmentation |
|
Table of Contents
- 1. Introduction
- 1.1. Research Scope
- 1.2. Market Segmentation
- 1.3. Research Objective
- 1.4. Definitions and Assumptions
- 2. Executive Summary
- 2.1. Market Snapshot
- 3. Market Dynamics
- 3.1. Market Drivers
- 3.2. Market Restrains
- 3.3. Market Trends
- 3.4. Market Opportunities
- 4. Market Factor Analysis
- 4.1. Porters Five Forces
- 4.1.1. Bargaining Power of Suppliers
- 4.1.2. Bargaining Power of Buyers
- 4.1.3. Threat of New Entrants
- 4.1.4. Threat of Substitutes
- 4.1.5. Competitive Rivalry
- 4.2. PESTEL analysis
- 4.3. BCG Analysis
- 4.3.1. Stars (High Growth, High Market Share)
- 4.3.2. Cash Cows (Low Growth, High Market Share)
- 4.3.3. Question Mark (High Growth, Low Market Share)
- 4.3.4. Dogs (Low Growth, Low Market Share)
- 4.4. Ansoff Matrix Analysis
- 4.5. Supply Chain Analysis
- 4.6. Regulatory Landscape
- 4.7. Current Market Potential and Opportunity Assessment (TAM–SAM–SOM Framework)
- 4.8. IMR Analyst Note
- 4.1. Porters Five Forces
- 5. Market Analysis, Insights and Forecast 2021-2033
- 5.1. Market Analysis, Insights and Forecast - by Product Type
- 5.1.1. Flocculant & Coagulants
- 5.1.2. Biocides & Disinfectants
- 5.1.3. Defoamers & Defoaming Agents
- 5.1.4. pH & Adjusters & Softeners
- 5.1.5. Scale & Corrosion Inhibitors
- 5.1.6. Others
- 5.2. Market Analysis, Insights and Forecast - by End-user Industry
- 5.2.1. Power
- 5.2.2. Oil & Gas
- 5.2.3. Chemical Manufcaturing
- 5.2.4. Mining & Mineral Processing
- 5.2.5. Mining and Mineral Processing
- 5.2.6. Food & Beverage
- 5.2.7. Pulp & Ppaer
- 5.2.8. Others
- 5.3. Market Analysis, Insights and Forecast - by Geography
- 5.3.1. Brazil
- 5.3.2. Argentina
- 5.3.3. Rest of South America
- 5.4. Market Analysis, Insights and Forecast - by Region
- 5.4.1. Brazil
- 5.4.2. Argentina
- 5.4.3. Rest of South America
- 5.1. Market Analysis, Insights and Forecast - by Product Type
- 6. Global South America Water Treatment Chemicals Industry Analysis, Insights and Forecast, 2021-2033
- 6.1. Market Analysis, Insights and Forecast - by Product Type
- 6.1.1. Flocculant & Coagulants
- 6.1.2. Biocides & Disinfectants
- 6.1.3. Defoamers & Defoaming Agents
- 6.1.4. pH & Adjusters & Softeners
- 6.1.5. Scale & Corrosion Inhibitors
- 6.1.6. Others
- 6.2. Market Analysis, Insights and Forecast - by End-user Industry
- 6.2.1. Power
- 6.2.2. Oil & Gas
- 6.2.3. Chemical Manufcaturing
- 6.2.4. Mining & Mineral Processing
- 6.2.5. Mining and Mineral Processing
- 6.2.6. Food & Beverage
- 6.2.7. Pulp & Ppaer
- 6.2.8. Others
- 6.3. Market Analysis, Insights and Forecast - by Geography
- 6.3.1. Brazil
- 6.3.2. Argentina
- 6.3.3. Rest of South America
- 6.1. Market Analysis, Insights and Forecast - by Product Type
- 7. Brazil South America Water Treatment Chemicals Industry Analysis, Insights and Forecast, 2020-2032
- 7.1. Market Analysis, Insights and Forecast - by Product Type
- 7.1.1. Flocculant & Coagulants
- 7.1.2. Biocides & Disinfectants
- 7.1.3. Defoamers & Defoaming Agents
- 7.1.4. pH & Adjusters & Softeners
- 7.1.5. Scale & Corrosion Inhibitors
- 7.1.6. Others
- 7.2. Market Analysis, Insights and Forecast - by End-user Industry
- 7.2.1. Power
- 7.2.2. Oil & Gas
- 7.2.3. Chemical Manufcaturing
- 7.2.4. Mining & Mineral Processing
- 7.2.5. Mining and Mineral Processing
- 7.2.6. Food & Beverage
- 7.2.7. Pulp & Ppaer
- 7.2.8. Others
- 7.3. Market Analysis, Insights and Forecast - by Geography
- 7.3.1. Brazil
- 7.3.2. Argentina
- 7.3.3. Rest of South America
- 7.1. Market Analysis, Insights and Forecast - by Product Type
- 8. Argentina South America Water Treatment Chemicals Industry Analysis, Insights and Forecast, 2020-2032
- 8.1. Market Analysis, Insights and Forecast - by Product Type
- 8.1.1. Flocculant & Coagulants
- 8.1.2. Biocides & Disinfectants
- 8.1.3. Defoamers & Defoaming Agents
- 8.1.4. pH & Adjusters & Softeners
- 8.1.5. Scale & Corrosion Inhibitors
- 8.1.6. Others
- 8.2. Market Analysis, Insights and Forecast - by End-user Industry
- 8.2.1. Power
- 8.2.2. Oil & Gas
- 8.2.3. Chemical Manufcaturing
- 8.2.4. Mining & Mineral Processing
- 8.2.5. Mining and Mineral Processing
- 8.2.6. Food & Beverage
- 8.2.7. Pulp & Ppaer
- 8.2.8. Others
- 8.3. Market Analysis, Insights and Forecast - by Geography
- 8.3.1. Brazil
- 8.3.2. Argentina
- 8.3.3. Rest of South America
- 8.1. Market Analysis, Insights and Forecast - by Product Type
- 9. Rest of South America South America Water Treatment Chemicals Industry Analysis, Insights and Forecast, 2020-2032
- 9.1. Market Analysis, Insights and Forecast - by Product Type
- 9.1.1. Flocculant & Coagulants
- 9.1.2. Biocides & Disinfectants
- 9.1.3. Defoamers & Defoaming Agents
- 9.1.4. pH & Adjusters & Softeners
- 9.1.5. Scale & Corrosion Inhibitors
- 9.1.6. Others
- 9.2. Market Analysis, Insights and Forecast - by End-user Industry
- 9.2.1. Power
- 9.2.2. Oil & Gas
- 9.2.3. Chemical Manufcaturing
- 9.2.4. Mining & Mineral Processing
- 9.2.5. Mining and Mineral Processing
- 9.2.6. Food & Beverage
- 9.2.7. Pulp & Ppaer
- 9.2.8. Others
- 9.3. Market Analysis, Insights and Forecast - by Geography
- 9.3.1. Brazil
- 9.3.2. Argentina
- 9.3.3. Rest of South America
- 9.1. Market Analysis, Insights and Forecast - by Product Type
- 10. Competitive Analysis
- 10.1. Company Profiles
- 10.1.1 Nouryon
- 10.1.1.1. Company Overview
- 10.1.1.2. Products
- 10.1.1.3. Company Financials
- 10.1.1.4. SWOT Analysis
- 10.1.2 Ecolab
- 10.1.2.1. Company Overview
- 10.1.2.2. Products
- 10.1.2.3. Company Financials
- 10.1.2.4. SWOT Analysis
- 10.1.3 Solenis
- 10.1.3.1. Company Overview
- 10.1.3.2. Products
- 10.1.3.3. Company Financials
- 10.1.3.4. SWOT Analysis
- 10.1.4 Kemira
- 10.1.4.1. Company Overview
- 10.1.4.2. Products
- 10.1.4.3. Company Financials
- 10.1.4.4. SWOT Analysis
- 10.1.5 Solvay
- 10.1.5.1. Company Overview
- 10.1.5.2. Products
- 10.1.5.3. Company Financials
- 10.1.5.4. SWOT Analysis
- 10.1.6 Lonza
- 10.1.6.1. Company Overview
- 10.1.6.2. Products
- 10.1.6.3. Company Financials
- 10.1.6.4. SWOT Analysis
- 10.1.7 Kurita Water industries Ltd
- 10.1.7.1. Company Overview
- 10.1.7.2. Products
- 10.1.7.3. Company Financials
- 10.1.7.4. SWOT Analysis
- 10.1.8 SNF
- 10.1.8.1. Company Overview
- 10.1.8.2. Products
- 10.1.8.3. Company Financials
- 10.1.8.4. SWOT Analysis
- 10.1.9 Suez*List Not Exhaustive
- 10.1.9.1. Company Overview
- 10.1.9.2. Products
- 10.1.9.3. Company Financials
- 10.1.9.4. SWOT Analysis
- 10.1.1 Nouryon
- 10.2. Market Entropy
- 10.2.1 Company's Key Areas Served
- 10.2.2 Recent Developments
- 10.3. Company Market Share Analysis 2025
- 10.3.1 Top 5 Companies Market Share Analysis
- 10.3.2 Top 3 Companies Market Share Analysis
- 10.4. List of Potential Customers
- 11. Research Methodology
List of Figures
- Figure 1: Global South America Water Treatment Chemicals Industry Revenue Breakdown (billion, %) by Region 2025 & 2033
- Figure 2: Brazil South America Water Treatment Chemicals Industry Revenue (billion), by Product Type 2025 & 2033
- Figure 3: Brazil South America Water Treatment Chemicals Industry Revenue Share (%), by Product Type 2025 & 2033
- Figure 4: Brazil South America Water Treatment Chemicals Industry Revenue (billion), by End-user Industry 2025 & 2033
- Figure 5: Brazil South America Water Treatment Chemicals Industry Revenue Share (%), by End-user Industry 2025 & 2033
- Figure 6: Brazil South America Water Treatment Chemicals Industry Revenue (billion), by Geography 2025 & 2033
- Figure 7: Brazil South America Water Treatment Chemicals Industry Revenue Share (%), by Geography 2025 & 2033
- Figure 8: Brazil South America Water Treatment Chemicals Industry Revenue (billion), by Country 2025 & 2033
- Figure 9: Brazil South America Water Treatment Chemicals Industry Revenue Share (%), by Country 2025 & 2033
- Figure 10: Argentina South America Water Treatment Chemicals Industry Revenue (billion), by Product Type 2025 & 2033
- Figure 11: Argentina South America Water Treatment Chemicals Industry Revenue Share (%), by Product Type 2025 & 2033
- Figure 12: Argentina South America Water Treatment Chemicals Industry Revenue (billion), by End-user Industry 2025 & 2033
- Figure 13: Argentina South America Water Treatment Chemicals Industry Revenue Share (%), by End-user Industry 2025 & 2033
- Figure 14: Argentina South America Water Treatment Chemicals Industry Revenue (billion), by Geography 2025 & 2033
- Figure 15: Argentina South America Water Treatment Chemicals Industry Revenue Share (%), by Geography 2025 & 2033
- Figure 16: Argentina South America Water Treatment Chemicals Industry Revenue (billion), by Country 2025 & 2033
- Figure 17: Argentina South America Water Treatment Chemicals Industry Revenue Share (%), by Country 2025 & 2033
- Figure 18: Rest of South America South America Water Treatment Chemicals Industry Revenue (billion), by Product Type 2025 & 2033
- Figure 19: Rest of South America South America Water Treatment Chemicals Industry Revenue Share (%), by Product Type 2025 & 2033
- Figure 20: Rest of South America South America Water Treatment Chemicals Industry Revenue (billion), by End-user Industry 2025 & 2033
- Figure 21: Rest of South America South America Water Treatment Chemicals Industry Revenue Share (%), by End-user Industry 2025 & 2033
- Figure 22: Rest of South America South America Water Treatment Chemicals Industry Revenue (billion), by Geography 2025 & 2033
- Figure 23: Rest of South America South America Water Treatment Chemicals Industry Revenue Share (%), by Geography 2025 & 2033
- Figure 24: Rest of South America South America Water Treatment Chemicals Industry Revenue (billion), by Country 2025 & 2033
- Figure 25: Rest of South America South America Water Treatment Chemicals Industry Revenue Share (%), by Country 2025 & 2033
List of Tables
- Table 1: Global South America Water Treatment Chemicals Industry Revenue billion Forecast, by Product Type 2020 & 2033
- Table 2: Global South America Water Treatment Chemicals Industry Revenue billion Forecast, by End-user Industry 2020 & 2033
- Table 3: Global South America Water Treatment Chemicals Industry Revenue billion Forecast, by Geography 2020 & 2033
- Table 4: Global South America Water Treatment Chemicals Industry Revenue billion Forecast, by Region 2020 & 2033
- Table 5: Global South America Water Treatment Chemicals Industry Revenue billion Forecast, by Product Type 2020 & 2033
- Table 6: Global South America Water Treatment Chemicals Industry Revenue billion Forecast, by End-user Industry 2020 & 2033
- Table 7: Global South America Water Treatment Chemicals Industry Revenue billion Forecast, by Geography 2020 & 2033
- Table 8: Global South America Water Treatment Chemicals Industry Revenue billion Forecast, by Country 2020 & 2033
- Table 9: Global South America Water Treatment Chemicals Industry Revenue billion Forecast, by Product Type 2020 & 2033
- Table 10: Global South America Water Treatment Chemicals Industry Revenue billion Forecast, by End-user Industry 2020 & 2033
- Table 11: Global South America Water Treatment Chemicals Industry Revenue billion Forecast, by Geography 2020 & 2033
- Table 12: Global South America Water Treatment Chemicals Industry Revenue billion Forecast, by Country 2020 & 2033
- Table 13: Global South America Water Treatment Chemicals Industry Revenue billion Forecast, by Product Type 2020 & 2033
- Table 14: Global South America Water Treatment Chemicals Industry Revenue billion Forecast, by End-user Industry 2020 & 2033
- Table 15: Global South America Water Treatment Chemicals Industry Revenue billion Forecast, by Geography 2020 & 2033
- Table 16: Global South America Water Treatment Chemicals Industry Revenue billion Forecast, by Country 2020 & 2033
Frequently Asked Questions
1. What is the projected Compound Annual Growth Rate (CAGR) of the South America Water Treatment Chemicals Industry?
The projected CAGR is approximately 7.4%.
2. Which companies are prominent players in the South America Water Treatment Chemicals Industry?
Key companies in the market include Nouryon, Ecolab, Solenis, Kemira, Solvay, Lonza, Kurita Water industries Ltd, SNF, Suez*List Not Exhaustive.
3. What are the main segments of the South America Water Treatment Chemicals Industry?
The market segments include Product Type, End-user Industry, Geography.
4. Can you provide details about the market size?
The market size is estimated to be USD 2.9 billion as of 2022.
5. What are some drivers contributing to market growth?
; Conformance to Stringent Environmental Regulations; Other Drivers.
6. What are the notable trends driving market growth?
Oil & Gas Industry to Dominate the Market.
7. Are there any restraints impacting market growth?
; Conformance to Stringent Environmental Regulations; Other Drivers.
8. Can you provide examples of recent developments in the market?
N/A
9. What pricing options are available for accessing the report?
Pricing options include single-user, multi-user, and enterprise licenses priced at USD 4750, USD 5250, and USD 8750 respectively.
10. Is the market size provided in terms of value or volume?
The market size is provided in terms of value, measured in billion.
11. Are there any specific market keywords associated with the report?
Yes, the market keyword associated with the report is "South America Water Treatment Chemicals Industry," which aids in identifying and referencing the specific market segment covered.
12. How do I determine which pricing option suits my needs best?
The pricing options vary based on user requirements and access needs. Individual users may opt for single-user licenses, while businesses requiring broader access may choose multi-user or enterprise licenses for cost-effective access to the report.
13. Are there any additional resources or data provided in the South America Water Treatment Chemicals Industry report?
While the report offers comprehensive insights, it's advisable to review the specific contents or supplementary materials provided to ascertain if additional resources or data are available.
14. How can I stay updated on further developments or reports in the South America Water Treatment Chemicals Industry?
To stay informed about further developments, trends, and reports in the South America Water Treatment Chemicals Industry, consider subscribing to industry newsletters, following relevant companies and organizations, or regularly checking reputable industry news sources and publications.
Methodology
Step 1 - Identification of Relevant Samples Size from Population Database


Step 2 - Approaches for Defining Global Market Size (Value, Volume* & Price*)

Note*: In applicable scenarios
Step 3 - Data Sources
Primary Research
- Web Analytics
- Survey Reports
- Research Institute
- Latest Research Reports
- Opinion Leaders
Secondary Research
- Annual Reports
- White Paper
- Latest Press Release
- Industry Association
- Paid Database
- Investor Presentations

Step 4 - Data Triangulation
Involves using different sources of information in order to increase the validity of a study
These sources are likely to be stakeholders in a program - participants, other researchers, program staff, other community members, and so on.
Then we put all data in single framework & apply various statistical tools to find out the dynamic on the market.
During the analysis stage, feedback from the stakeholder groups would be compared to determine areas of agreement as well as areas of divergence