

Key Insights
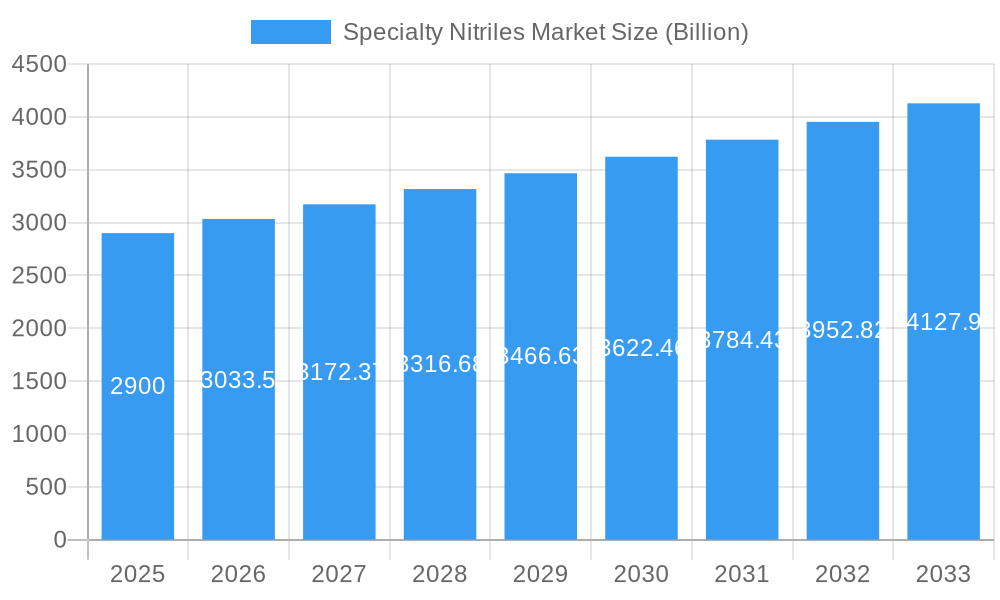
The global specialty nitriles market, valued at $2.9 billion in 2025, is projected to experience robust growth, driven by a compound annual growth rate (CAGR) of 4.5% from 2025 to 2033. This expansion is fueled by several key factors. The increasing demand for high-performance materials in diverse sectors like automotive, electronics, and oilfield applications is a primary driver. The automotive industry's shift towards lightweighting and enhanced performance characteristics necessitates the use of specialty nitriles in components such as seals and gaskets. Similarly, the electronics sector utilizes specialty nitriles in the manufacturing of protective coatings and encapsulants due to their excellent dielectric properties and chemical resistance. Growth in the oil and gas industry, demanding durable and chemically resistant materials for harsh operating conditions, further bolsters market expansion. Furthermore, advancements in manufacturing processes, particularly in ammoxidation and hydrocyanation, are leading to improved efficiency and cost-effectiveness, contributing to market growth. The rising preference for hydrogenated nitrile butadiene rubber (HNBR) over nitrile butadiene rubber (NBR) due to its superior resistance to heat and chemicals is also shaping market dynamics.
Specialty Nitriles Market Market Size (In Billion)
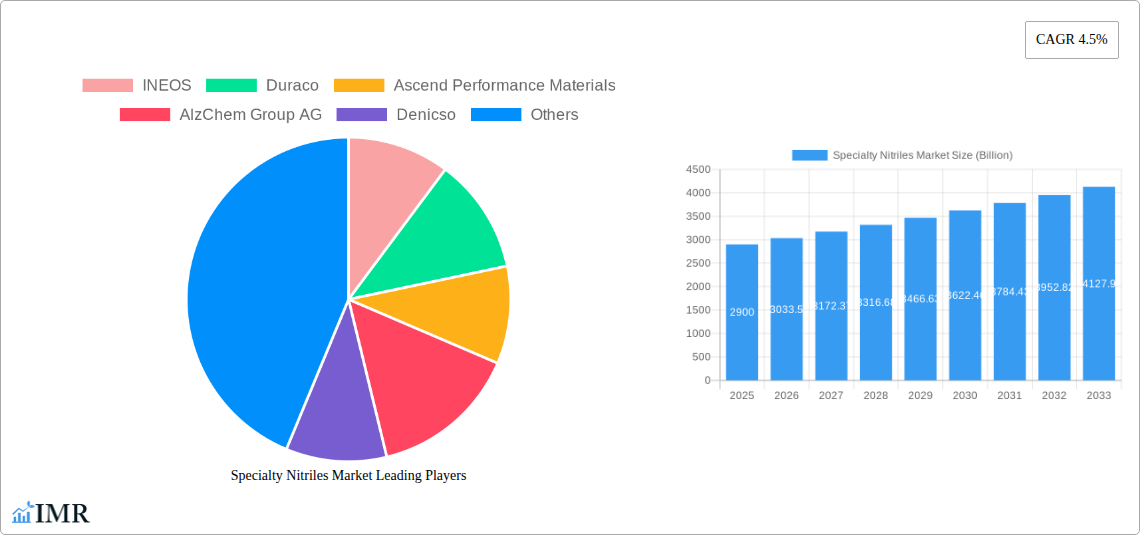
However, the market faces certain restraints. Fluctuations in raw material prices, particularly acrylonitrile, can impact profitability and market stability. Stringent environmental regulations related to chemical manufacturing and disposal also pose challenges. Competitive pressure from alternative materials, coupled with economic downturns in key end-use industries, could potentially dampen market growth in certain periods. Despite these challenges, the ongoing technological advancements, diversification of applications, and increased focus on sustainable manufacturing practices are expected to offset these constraints and maintain a positive growth trajectory for the specialty nitriles market throughout the forecast period. The market is segmented by manufacturing process (ammoxidation and hydrocyanation), type (NBR, HNBR, and others), and application (protective gloves, automotive components, electronic components, adhesives & sealants, oilfield applications, and others), offering diverse opportunities for market players. Key players like INEOS, Duraco, and Ascend Performance Materials are actively engaged in product innovation and strategic partnerships to strengthen their market position.
Specialty Nitriles Market Company Market Share
Specialty Nitriles Market: A Comprehensive Market Report (2019-2033)
This in-depth report provides a comprehensive analysis of the global Specialty Nitriles Market, encompassing its current state, future trajectory, and key players. With a study period spanning 2019-2033, a base year of 2025, and a forecast period of 2025-2033, this report is an invaluable resource for industry professionals, investors, and strategic decision-makers. The market, a sub-segment of the larger Chemical Intermediates Market, is segmented by manufacturing process, type, and application, offering granular insights into its diverse landscape. The total market value is projected to reach xx Billion by 2033.
Specialty Nitriles Market Dynamics & Structure
The Specialty Nitriles Market exhibits a moderately concentrated structure, with key players like INEOS, Duraco, and Ascend Performance Materials holding significant market share. Technological innovation, particularly in improved synthesis methods and application-specific formulations, is a primary growth driver. Stringent regulatory frameworks concerning chemical handling and environmental impact influence market dynamics. Competitive pressures arise from substitute materials, while M&A activities contribute to market consolidation. The market is driven by diverse end-user demographics across various sectors.
- Market Concentration: Top 5 players hold approximately xx% market share in 2025.
- Technological Innovation: Focus on improving yield, reducing environmental footprint, and developing specialized nitrile formulations.
- Regulatory Landscape: Stringent environmental regulations and safety standards impact production and distribution.
- Competitive Substitutes: Competition from alternative materials in specific applications limits market growth.
- End-User Demographics: Growing demand from automotive, healthcare, and electronics sectors.
- M&A Activity: xx M&A deals were recorded between 2019-2024, indicating consolidation trends.
Specialty Nitriles Market Growth Trends & Insights
The Specialty Nitriles Market has witnessed consistent growth throughout the historical period (2019-2024), with a CAGR of xx%. This growth is projected to continue during the forecast period (2025-2033), driven by increasing demand from diverse end-use industries. Technological advancements, particularly in the development of high-performance nitriles, contribute significantly to this growth. Changes in consumer behavior, favoring sustainable and high-performance products, also shape market trends. Market penetration in emerging economies is expected to increase significantly, contributing to overall market expansion. Adoption of advanced manufacturing processes and innovative application development further fuels market expansion.
- Market Size (2025): xx Billion
- Projected Market Size (2033): xx Billion
- CAGR (2025-2033): xx%
- Market Penetration: xx% increase in emerging markets by 2033.
Dominant Regions, Countries, or Segments in Specialty Nitriles Market
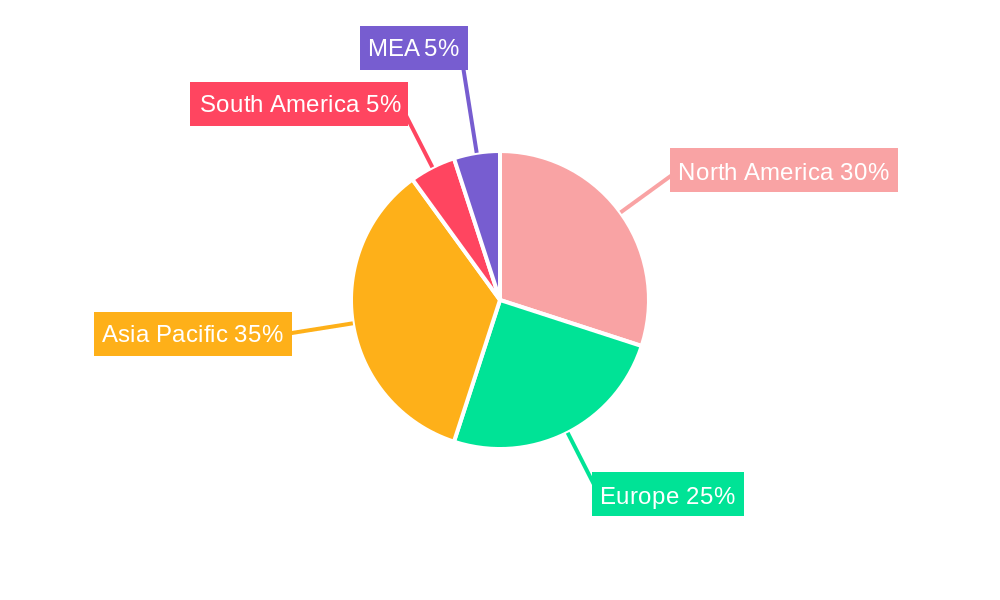
North America currently holds the largest market share, driven by strong demand from the automotive and electronics sectors and established manufacturing capabilities. However, Asia-Pacific is projected to exhibit the fastest growth rate, fueled by rapid industrialization and increasing infrastructure development. Within segments, Nitrile Butadiene Rubber (NBR) dominates in terms of volume, followed by Hydrogenated Nitrile Butadiene Rubber (HNBR). The Ammoxidation manufacturing process holds a significant share due to its cost-effectiveness. The protective gloves application segment shows the highest demand currently.
- Leading Region (2025): North America
- Fastest-Growing Region (2025-2033): Asia-Pacific
- Dominant Type: Nitrile Butadiene Rubber (NBR)
- Dominant Manufacturing Process: Ammoxidation
- Dominant Application: Protective Gloves
Specialty Nitriles Market Product Landscape
The Specialty Nitriles market showcases continuous innovation, with new products offering enhanced performance characteristics, such as improved oil resistance, heat resistance, and chemical stability. These advancements cater to evolving application requirements, creating new opportunities in high-performance applications like aerospace components and specialized seals. Product differentiation focuses on customized formulations tailored to specific end-use properties.
Key Drivers, Barriers & Challenges in Specialty Nitriles Market
Key Drivers: Increasing demand from automotive, oil & gas, and healthcare sectors; technological advancements leading to improved performance and cost-effectiveness; growth in emerging economies.
Key Challenges: Fluctuations in raw material prices; stringent environmental regulations; intense competition from substitute materials; supply chain disruptions. For example, xx% increase in raw material costs in 2024 impacted production and profitability.
Emerging Opportunities in Specialty Nitriles Market
Untapped markets in developing economies present significant opportunities. The development of bio-based nitriles and sustainable production methods can open new avenues. Specialized applications in advanced materials and high-performance composites hold considerable potential.
Growth Accelerators in the Specialty Nitriles Market Industry
Technological breakthroughs in manufacturing processes and the development of novel nitrile formulations are key accelerators. Strategic partnerships between manufacturers and end-users facilitate market expansion. Expanding into new applications, especially within the renewable energy and advanced manufacturing sectors, will drive long-term growth.
Key Players Shaping the Specialty Nitriles Market Market
- INEOS
- Duraco
- Ascend Performance Materials
- AlzChem Group AG
- Denicso
- Speciality Tapes
- TIDI Products LLC
- Emerald Performance Materials
- Parchem fine & specialty chemicals
- Marco Rubber & Plastics LLC
- Zeon Chemicals L P
Notable Milestones in Specialty Nitriles Market Sector
- 2022 Q3: INEOS announced a new production facility expansion.
- 2023 Q1: Ascend Performance Materials launched a new high-performance NBR grade.
- 2024 Q2: AlzChem Group AG acquired a specialty nitrile producer. (Further milestones to be added based on data availability).
In-Depth Specialty Nitriles Market Market Outlook
The Specialty Nitriles Market is poised for robust growth, driven by sustained demand from key industries and continuous innovation. Strategic investments in research and development, coupled with strategic partnerships and expansion into emerging markets, will shape the future market landscape. The market is expected to see significant growth in specialized applications demanding high-performance characteristics, presenting lucrative opportunities for industry players.
Specialty Nitriles Market Segmentation
-
1. Manufacturing Process
- 1.1. Ammoxidation
- 1.2. Hydrocyanation
-
2. Types
- 2.1. Nitrile Butadiene Rubber
- 2.2. Hydrogenated Nitrile Butadiene Rubber
- 2.3. Others
-
3. Application
- 3.1. Protective Gloves
- 3.2. Automotive Components
- 3.3. Electronic Components
- 3.4. Adhesives & Sealants
- 3.5. Oilfield Applications
- 3.6. Others
Specialty Nitriles Market Segmentation By Geography
-
1. Asia Pacific
- 1.1. China
- 1.2. India
- 1.3. Japan
- 1.4. South Korea
- 1.5. Rest of Asia Pacific
-
2. North America
- 2.1. United States
- 2.2. Canada
- 2.3. Mexico
-
3. Europe
- 3.1. Germany
- 3.2. United Kingdom
- 3.3. France
- 3.4. Italy
- 3.5. Rest of Europe
-
4. South America
- 4.1. Brazil
- 4.2. Argentina
- 4.3. Rest of South America
-
5. Middle East and Africa
- 5.1. Saudi Arabia
- 5.2. South Africa
- 5.3. Rest of Middle East and Africa
Specialty Nitriles Market Regional Market Share
Geographic Coverage of Specialty Nitriles Market
Specialty Nitriles Market REPORT HIGHLIGHTS
| Aspects | Details |
|---|---|
| Study Period | 2020-2034 |
| Base Year | 2025 |
| Estimated Year | 2026 |
| Forecast Period | 2026-2034 |
| Historical Period | 2020-2025 |
| Growth Rate | CAGR of 4.5% from 2020-2034 |
| Segmentation |
|
Table of Contents
- 1. Introduction
- 1.1. Research Scope
- 1.2. Market Segmentation
- 1.3. Research Objective
- 1.4. Definitions and Assumptions
- 2. Executive Summary
- 2.1. Market Snapshot
- 3. Market Dynamics
- 3.1. Market Drivers
- 3.2. Market Restrains
- 3.3. Market Trends
- 3.4. Market Opportunities
- 4. Market Factor Analysis
- 4.1. Porters Five Forces
- 4.1.1. Bargaining Power of Suppliers
- 4.1.2. Bargaining Power of Buyers
- 4.1.3. Threat of New Entrants
- 4.1.4. Threat of Substitutes
- 4.1.5. Competitive Rivalry
- 4.2. PESTEL analysis
- 4.3. BCG Analysis
- 4.3.1. Stars (High Growth, High Market Share)
- 4.3.2. Cash Cows (Low Growth, High Market Share)
- 4.3.3. Question Mark (High Growth, Low Market Share)
- 4.3.4. Dogs (Low Growth, Low Market Share)
- 4.4. Ansoff Matrix Analysis
- 4.5. Supply Chain Analysis
- 4.6. Regulatory Landscape
- 4.7. Current Market Potential and Opportunity Assessment (TAM–SAM–SOM Framework)
- 4.8. IMR Analyst Note
- 4.1. Porters Five Forces
- 5. Market Analysis, Insights and Forecast 2021-2033
- 5.1. Market Analysis, Insights and Forecast - by Manufacturing Process
- 5.1.1. Ammoxidation
- 5.1.2. Hydrocyanation
- 5.2. Market Analysis, Insights and Forecast - by Types
- 5.2.1. Nitrile Butadiene Rubber
- 5.2.2. Hydrogenated Nitrile Butadiene Rubber
- 5.2.3. Others
- 5.3. Market Analysis, Insights and Forecast - by Application
- 5.3.1. Protective Gloves
- 5.3.2. Automotive Components
- 5.3.3. Electronic Components
- 5.3.4. Adhesives & Sealants
- 5.3.5. Oilfield Applications
- 5.3.6. Others
- 5.4. Market Analysis, Insights and Forecast - by Region
- 5.4.1. Asia Pacific
- 5.4.2. North America
- 5.4.3. Europe
- 5.4.4. South America
- 5.4.5. Middle East and Africa
- 5.1. Market Analysis, Insights and Forecast - by Manufacturing Process
- 6. Global Specialty Nitriles Market Analysis, Insights and Forecast, 2021-2033
- 6.1. Market Analysis, Insights and Forecast - by Manufacturing Process
- 6.1.1. Ammoxidation
- 6.1.2. Hydrocyanation
- 6.2. Market Analysis, Insights and Forecast - by Types
- 6.2.1. Nitrile Butadiene Rubber
- 6.2.2. Hydrogenated Nitrile Butadiene Rubber
- 6.2.3. Others
- 6.3. Market Analysis, Insights and Forecast - by Application
- 6.3.1. Protective Gloves
- 6.3.2. Automotive Components
- 6.3.3. Electronic Components
- 6.3.4. Adhesives & Sealants
- 6.3.5. Oilfield Applications
- 6.3.6. Others
- 6.1. Market Analysis, Insights and Forecast - by Manufacturing Process
- 7. Asia Pacific Specialty Nitriles Market Analysis, Insights and Forecast, 2020-2032
- 7.1. Market Analysis, Insights and Forecast - by Manufacturing Process
- 7.1.1. Ammoxidation
- 7.1.2. Hydrocyanation
- 7.2. Market Analysis, Insights and Forecast - by Types
- 7.2.1. Nitrile Butadiene Rubber
- 7.2.2. Hydrogenated Nitrile Butadiene Rubber
- 7.2.3. Others
- 7.3. Market Analysis, Insights and Forecast - by Application
- 7.3.1. Protective Gloves
- 7.3.2. Automotive Components
- 7.3.3. Electronic Components
- 7.3.4. Adhesives & Sealants
- 7.3.5. Oilfield Applications
- 7.3.6. Others
- 7.1. Market Analysis, Insights and Forecast - by Manufacturing Process
- 8. North America Specialty Nitriles Market Analysis, Insights and Forecast, 2020-2032
- 8.1. Market Analysis, Insights and Forecast - by Manufacturing Process
- 8.1.1. Ammoxidation
- 8.1.2. Hydrocyanation
- 8.2. Market Analysis, Insights and Forecast - by Types
- 8.2.1. Nitrile Butadiene Rubber
- 8.2.2. Hydrogenated Nitrile Butadiene Rubber
- 8.2.3. Others
- 8.3. Market Analysis, Insights and Forecast - by Application
- 8.3.1. Protective Gloves
- 8.3.2. Automotive Components
- 8.3.3. Electronic Components
- 8.3.4. Adhesives & Sealants
- 8.3.5. Oilfield Applications
- 8.3.6. Others
- 8.1. Market Analysis, Insights and Forecast - by Manufacturing Process
- 9. Europe Specialty Nitriles Market Analysis, Insights and Forecast, 2020-2032
- 9.1. Market Analysis, Insights and Forecast - by Manufacturing Process
- 9.1.1. Ammoxidation
- 9.1.2. Hydrocyanation
- 9.2. Market Analysis, Insights and Forecast - by Types
- 9.2.1. Nitrile Butadiene Rubber
- 9.2.2. Hydrogenated Nitrile Butadiene Rubber
- 9.2.3. Others
- 9.3. Market Analysis, Insights and Forecast - by Application
- 9.3.1. Protective Gloves
- 9.3.2. Automotive Components
- 9.3.3. Electronic Components
- 9.3.4. Adhesives & Sealants
- 9.3.5. Oilfield Applications
- 9.3.6. Others
- 9.1. Market Analysis, Insights and Forecast - by Manufacturing Process
- 10. South America Specialty Nitriles Market Analysis, Insights and Forecast, 2020-2032
- 10.1. Market Analysis, Insights and Forecast - by Manufacturing Process
- 10.1.1. Ammoxidation
- 10.1.2. Hydrocyanation
- 10.2. Market Analysis, Insights and Forecast - by Types
- 10.2.1. Nitrile Butadiene Rubber
- 10.2.2. Hydrogenated Nitrile Butadiene Rubber
- 10.2.3. Others
- 10.3. Market Analysis, Insights and Forecast - by Application
- 10.3.1. Protective Gloves
- 10.3.2. Automotive Components
- 10.3.3. Electronic Components
- 10.3.4. Adhesives & Sealants
- 10.3.5. Oilfield Applications
- 10.3.6. Others
- 10.1. Market Analysis, Insights and Forecast - by Manufacturing Process
- 11. Middle East and Africa Specialty Nitriles Market Analysis, Insights and Forecast, 2020-2032
- 11.1. Market Analysis, Insights and Forecast - by Manufacturing Process
- 11.1.1. Ammoxidation
- 11.1.2. Hydrocyanation
- 11.2. Market Analysis, Insights and Forecast - by Types
- 11.2.1. Nitrile Butadiene Rubber
- 11.2.2. Hydrogenated Nitrile Butadiene Rubber
- 11.2.3. Others
- 11.3. Market Analysis, Insights and Forecast - by Application
- 11.3.1. Protective Gloves
- 11.3.2. Automotive Components
- 11.3.3. Electronic Components
- 11.3.4. Adhesives & Sealants
- 11.3.5. Oilfield Applications
- 11.3.6. Others
- 11.1. Market Analysis, Insights and Forecast - by Manufacturing Process
- 12. Competitive Analysis
- 12.1. Company Profiles
- 12.1.1 INEOS
- 12.1.1.1. Company Overview
- 12.1.1.2. Products
- 12.1.1.3. Company Financials
- 12.1.1.4. SWOT Analysis
- 12.1.2 Duraco
- 12.1.2.1. Company Overview
- 12.1.2.2. Products
- 12.1.2.3. Company Financials
- 12.1.2.4. SWOT Analysis
- 12.1.3 Ascend Performance Materials
- 12.1.3.1. Company Overview
- 12.1.3.2. Products
- 12.1.3.3. Company Financials
- 12.1.3.4. SWOT Analysis
- 12.1.4 AlzChem Group AG
- 12.1.4.1. Company Overview
- 12.1.4.2. Products
- 12.1.4.3. Company Financials
- 12.1.4.4. SWOT Analysis
- 12.1.5 Denicso
- 12.1.5.1. Company Overview
- 12.1.5.2. Products
- 12.1.5.3. Company Financials
- 12.1.5.4. SWOT Analysis
- 12.1.6 Speciality Tapes
- 12.1.6.1. Company Overview
- 12.1.6.2. Products
- 12.1.6.3. Company Financials
- 12.1.6.4. SWOT Analysis
- 12.1.7 TIDI Products LLC
- 12.1.7.1. Company Overview
- 12.1.7.2. Products
- 12.1.7.3. Company Financials
- 12.1.7.4. SWOT Analysis
- 12.1.8 Emerald Performance Materials
- 12.1.8.1. Company Overview
- 12.1.8.2. Products
- 12.1.8.3. Company Financials
- 12.1.8.4. SWOT Analysis
- 12.1.9 Parchem fine & specialty chemicals
- 12.1.9.1. Company Overview
- 12.1.9.2. Products
- 12.1.9.3. Company Financials
- 12.1.9.4. SWOT Analysis
- 12.1.10 Marco Rubber & Plastics LLC
- 12.1.10.1. Company Overview
- 12.1.10.2. Products
- 12.1.10.3. Company Financials
- 12.1.10.4. SWOT Analysis
- 12.1.11 Zeon Chemicals L P
- 12.1.11.1. Company Overview
- 12.1.11.2. Products
- 12.1.11.3. Company Financials
- 12.1.11.4. SWOT Analysis
- 12.1.1 INEOS
- 12.2. Market Entropy
- 12.2.1 Company's Key Areas Served
- 12.2.2 Recent Developments
- 12.3. Company Market Share Analysis 2025
- 12.3.1 Top 5 Companies Market Share Analysis
- 12.3.2 Top 3 Companies Market Share Analysis
- 12.4. List of Potential Customers
- 13. Research Methodology
List of Figures
- Figure 1: Global Specialty Nitriles Market Revenue Breakdown (Billion, %) by Region 2025 & 2033
- Figure 2: Global Specialty Nitriles Market Volume Breakdown (K Tons, %) by Region 2025 & 2033
- Figure 3: Asia Pacific Specialty Nitriles Market Revenue (Billion), by Manufacturing Process 2025 & 2033
- Figure 4: Asia Pacific Specialty Nitriles Market Volume (K Tons), by Manufacturing Process 2025 & 2033
- Figure 5: Asia Pacific Specialty Nitriles Market Revenue Share (%), by Manufacturing Process 2025 & 2033
- Figure 6: Asia Pacific Specialty Nitriles Market Volume Share (%), by Manufacturing Process 2025 & 2033
- Figure 7: Asia Pacific Specialty Nitriles Market Revenue (Billion), by Types 2025 & 2033
- Figure 8: Asia Pacific Specialty Nitriles Market Volume (K Tons), by Types 2025 & 2033
- Figure 9: Asia Pacific Specialty Nitriles Market Revenue Share (%), by Types 2025 & 2033
- Figure 10: Asia Pacific Specialty Nitriles Market Volume Share (%), by Types 2025 & 2033
- Figure 11: Asia Pacific Specialty Nitriles Market Revenue (Billion), by Application 2025 & 2033
- Figure 12: Asia Pacific Specialty Nitriles Market Volume (K Tons), by Application 2025 & 2033
- Figure 13: Asia Pacific Specialty Nitriles Market Revenue Share (%), by Application 2025 & 2033
- Figure 14: Asia Pacific Specialty Nitriles Market Volume Share (%), by Application 2025 & 2033
- Figure 15: Asia Pacific Specialty Nitriles Market Revenue (Billion), by Country 2025 & 2033
- Figure 16: Asia Pacific Specialty Nitriles Market Volume (K Tons), by Country 2025 & 2033
- Figure 17: Asia Pacific Specialty Nitriles Market Revenue Share (%), by Country 2025 & 2033
- Figure 18: Asia Pacific Specialty Nitriles Market Volume Share (%), by Country 2025 & 2033
- Figure 19: North America Specialty Nitriles Market Revenue (Billion), by Manufacturing Process 2025 & 2033
- Figure 20: North America Specialty Nitriles Market Volume (K Tons), by Manufacturing Process 2025 & 2033
- Figure 21: North America Specialty Nitriles Market Revenue Share (%), by Manufacturing Process 2025 & 2033
- Figure 22: North America Specialty Nitriles Market Volume Share (%), by Manufacturing Process 2025 & 2033
- Figure 23: North America Specialty Nitriles Market Revenue (Billion), by Types 2025 & 2033
- Figure 24: North America Specialty Nitriles Market Volume (K Tons), by Types 2025 & 2033
- Figure 25: North America Specialty Nitriles Market Revenue Share (%), by Types 2025 & 2033
- Figure 26: North America Specialty Nitriles Market Volume Share (%), by Types 2025 & 2033
- Figure 27: North America Specialty Nitriles Market Revenue (Billion), by Application 2025 & 2033
- Figure 28: North America Specialty Nitriles Market Volume (K Tons), by Application 2025 & 2033
- Figure 29: North America Specialty Nitriles Market Revenue Share (%), by Application 2025 & 2033
- Figure 30: North America Specialty Nitriles Market Volume Share (%), by Application 2025 & 2033
- Figure 31: North America Specialty Nitriles Market Revenue (Billion), by Country 2025 & 2033
- Figure 32: North America Specialty Nitriles Market Volume (K Tons), by Country 2025 & 2033
- Figure 33: North America Specialty Nitriles Market Revenue Share (%), by Country 2025 & 2033
- Figure 34: North America Specialty Nitriles Market Volume Share (%), by Country 2025 & 2033
- Figure 35: Europe Specialty Nitriles Market Revenue (Billion), by Manufacturing Process 2025 & 2033
- Figure 36: Europe Specialty Nitriles Market Volume (K Tons), by Manufacturing Process 2025 & 2033
- Figure 37: Europe Specialty Nitriles Market Revenue Share (%), by Manufacturing Process 2025 & 2033
- Figure 38: Europe Specialty Nitriles Market Volume Share (%), by Manufacturing Process 2025 & 2033
- Figure 39: Europe Specialty Nitriles Market Revenue (Billion), by Types 2025 & 2033
- Figure 40: Europe Specialty Nitriles Market Volume (K Tons), by Types 2025 & 2033
- Figure 41: Europe Specialty Nitriles Market Revenue Share (%), by Types 2025 & 2033
- Figure 42: Europe Specialty Nitriles Market Volume Share (%), by Types 2025 & 2033
- Figure 43: Europe Specialty Nitriles Market Revenue (Billion), by Application 2025 & 2033
- Figure 44: Europe Specialty Nitriles Market Volume (K Tons), by Application 2025 & 2033
- Figure 45: Europe Specialty Nitriles Market Revenue Share (%), by Application 2025 & 2033
- Figure 46: Europe Specialty Nitriles Market Volume Share (%), by Application 2025 & 2033
- Figure 47: Europe Specialty Nitriles Market Revenue (Billion), by Country 2025 & 2033
- Figure 48: Europe Specialty Nitriles Market Volume (K Tons), by Country 2025 & 2033
- Figure 49: Europe Specialty Nitriles Market Revenue Share (%), by Country 2025 & 2033
- Figure 50: Europe Specialty Nitriles Market Volume Share (%), by Country 2025 & 2033
- Figure 51: South America Specialty Nitriles Market Revenue (Billion), by Manufacturing Process 2025 & 2033
- Figure 52: South America Specialty Nitriles Market Volume (K Tons), by Manufacturing Process 2025 & 2033
- Figure 53: South America Specialty Nitriles Market Revenue Share (%), by Manufacturing Process 2025 & 2033
- Figure 54: South America Specialty Nitriles Market Volume Share (%), by Manufacturing Process 2025 & 2033
- Figure 55: South America Specialty Nitriles Market Revenue (Billion), by Types 2025 & 2033
- Figure 56: South America Specialty Nitriles Market Volume (K Tons), by Types 2025 & 2033
- Figure 57: South America Specialty Nitriles Market Revenue Share (%), by Types 2025 & 2033
- Figure 58: South America Specialty Nitriles Market Volume Share (%), by Types 2025 & 2033
- Figure 59: South America Specialty Nitriles Market Revenue (Billion), by Application 2025 & 2033
- Figure 60: South America Specialty Nitriles Market Volume (K Tons), by Application 2025 & 2033
- Figure 61: South America Specialty Nitriles Market Revenue Share (%), by Application 2025 & 2033
- Figure 62: South America Specialty Nitriles Market Volume Share (%), by Application 2025 & 2033
- Figure 63: South America Specialty Nitriles Market Revenue (Billion), by Country 2025 & 2033
- Figure 64: South America Specialty Nitriles Market Volume (K Tons), by Country 2025 & 2033
- Figure 65: South America Specialty Nitriles Market Revenue Share (%), by Country 2025 & 2033
- Figure 66: South America Specialty Nitriles Market Volume Share (%), by Country 2025 & 2033
- Figure 67: Middle East and Africa Specialty Nitriles Market Revenue (Billion), by Manufacturing Process 2025 & 2033
- Figure 68: Middle East and Africa Specialty Nitriles Market Volume (K Tons), by Manufacturing Process 2025 & 2033
- Figure 69: Middle East and Africa Specialty Nitriles Market Revenue Share (%), by Manufacturing Process 2025 & 2033
- Figure 70: Middle East and Africa Specialty Nitriles Market Volume Share (%), by Manufacturing Process 2025 & 2033
- Figure 71: Middle East and Africa Specialty Nitriles Market Revenue (Billion), by Types 2025 & 2033
- Figure 72: Middle East and Africa Specialty Nitriles Market Volume (K Tons), by Types 2025 & 2033
- Figure 73: Middle East and Africa Specialty Nitriles Market Revenue Share (%), by Types 2025 & 2033
- Figure 74: Middle East and Africa Specialty Nitriles Market Volume Share (%), by Types 2025 & 2033
- Figure 75: Middle East and Africa Specialty Nitriles Market Revenue (Billion), by Application 2025 & 2033
- Figure 76: Middle East and Africa Specialty Nitriles Market Volume (K Tons), by Application 2025 & 2033
- Figure 77: Middle East and Africa Specialty Nitriles Market Revenue Share (%), by Application 2025 & 2033
- Figure 78: Middle East and Africa Specialty Nitriles Market Volume Share (%), by Application 2025 & 2033
- Figure 79: Middle East and Africa Specialty Nitriles Market Revenue (Billion), by Country 2025 & 2033
- Figure 80: Middle East and Africa Specialty Nitriles Market Volume (K Tons), by Country 2025 & 2033
- Figure 81: Middle East and Africa Specialty Nitriles Market Revenue Share (%), by Country 2025 & 2033
- Figure 82: Middle East and Africa Specialty Nitriles Market Volume Share (%), by Country 2025 & 2033
List of Tables
- Table 1: Global Specialty Nitriles Market Revenue Billion Forecast, by Manufacturing Process 2020 & 2033
- Table 2: Global Specialty Nitriles Market Volume K Tons Forecast, by Manufacturing Process 2020 & 2033
- Table 3: Global Specialty Nitriles Market Revenue Billion Forecast, by Types 2020 & 2033
- Table 4: Global Specialty Nitriles Market Volume K Tons Forecast, by Types 2020 & 2033
- Table 5: Global Specialty Nitriles Market Revenue Billion Forecast, by Application 2020 & 2033
- Table 6: Global Specialty Nitriles Market Volume K Tons Forecast, by Application 2020 & 2033
- Table 7: Global Specialty Nitriles Market Revenue Billion Forecast, by Region 2020 & 2033
- Table 8: Global Specialty Nitriles Market Volume K Tons Forecast, by Region 2020 & 2033
- Table 9: Global Specialty Nitriles Market Revenue Billion Forecast, by Manufacturing Process 2020 & 2033
- Table 10: Global Specialty Nitriles Market Volume K Tons Forecast, by Manufacturing Process 2020 & 2033
- Table 11: Global Specialty Nitriles Market Revenue Billion Forecast, by Types 2020 & 2033
- Table 12: Global Specialty Nitriles Market Volume K Tons Forecast, by Types 2020 & 2033
- Table 13: Global Specialty Nitriles Market Revenue Billion Forecast, by Application 2020 & 2033
- Table 14: Global Specialty Nitriles Market Volume K Tons Forecast, by Application 2020 & 2033
- Table 15: Global Specialty Nitriles Market Revenue Billion Forecast, by Country 2020 & 2033
- Table 16: Global Specialty Nitriles Market Volume K Tons Forecast, by Country 2020 & 2033
- Table 17: China Specialty Nitriles Market Revenue (Billion) Forecast, by Application 2020 & 2033
- Table 18: China Specialty Nitriles Market Volume (K Tons) Forecast, by Application 2020 & 2033
- Table 19: India Specialty Nitriles Market Revenue (Billion) Forecast, by Application 2020 & 2033
- Table 20: India Specialty Nitriles Market Volume (K Tons) Forecast, by Application 2020 & 2033
- Table 21: Japan Specialty Nitriles Market Revenue (Billion) Forecast, by Application 2020 & 2033
- Table 22: Japan Specialty Nitriles Market Volume (K Tons) Forecast, by Application 2020 & 2033
- Table 23: South Korea Specialty Nitriles Market Revenue (Billion) Forecast, by Application 2020 & 2033
- Table 24: South Korea Specialty Nitriles Market Volume (K Tons) Forecast, by Application 2020 & 2033
- Table 25: Rest of Asia Pacific Specialty Nitriles Market Revenue (Billion) Forecast, by Application 2020 & 2033
- Table 26: Rest of Asia Pacific Specialty Nitriles Market Volume (K Tons) Forecast, by Application 2020 & 2033
- Table 27: Global Specialty Nitriles Market Revenue Billion Forecast, by Manufacturing Process 2020 & 2033
- Table 28: Global Specialty Nitriles Market Volume K Tons Forecast, by Manufacturing Process 2020 & 2033
- Table 29: Global Specialty Nitriles Market Revenue Billion Forecast, by Types 2020 & 2033
- Table 30: Global Specialty Nitriles Market Volume K Tons Forecast, by Types 2020 & 2033
- Table 31: Global Specialty Nitriles Market Revenue Billion Forecast, by Application 2020 & 2033
- Table 32: Global Specialty Nitriles Market Volume K Tons Forecast, by Application 2020 & 2033
- Table 33: Global Specialty Nitriles Market Revenue Billion Forecast, by Country 2020 & 2033
- Table 34: Global Specialty Nitriles Market Volume K Tons Forecast, by Country 2020 & 2033
- Table 35: United States Specialty Nitriles Market Revenue (Billion) Forecast, by Application 2020 & 2033
- Table 36: United States Specialty Nitriles Market Volume (K Tons) Forecast, by Application 2020 & 2033
- Table 37: Canada Specialty Nitriles Market Revenue (Billion) Forecast, by Application 2020 & 2033
- Table 38: Canada Specialty Nitriles Market Volume (K Tons) Forecast, by Application 2020 & 2033
- Table 39: Mexico Specialty Nitriles Market Revenue (Billion) Forecast, by Application 2020 & 2033
- Table 40: Mexico Specialty Nitriles Market Volume (K Tons) Forecast, by Application 2020 & 2033
- Table 41: Global Specialty Nitriles Market Revenue Billion Forecast, by Manufacturing Process 2020 & 2033
- Table 42: Global Specialty Nitriles Market Volume K Tons Forecast, by Manufacturing Process 2020 & 2033
- Table 43: Global Specialty Nitriles Market Revenue Billion Forecast, by Types 2020 & 2033
- Table 44: Global Specialty Nitriles Market Volume K Tons Forecast, by Types 2020 & 2033
- Table 45: Global Specialty Nitriles Market Revenue Billion Forecast, by Application 2020 & 2033
- Table 46: Global Specialty Nitriles Market Volume K Tons Forecast, by Application 2020 & 2033
- Table 47: Global Specialty Nitriles Market Revenue Billion Forecast, by Country 2020 & 2033
- Table 48: Global Specialty Nitriles Market Volume K Tons Forecast, by Country 2020 & 2033
- Table 49: Germany Specialty Nitriles Market Revenue (Billion) Forecast, by Application 2020 & 2033
- Table 50: Germany Specialty Nitriles Market Volume (K Tons) Forecast, by Application 2020 & 2033
- Table 51: United Kingdom Specialty Nitriles Market Revenue (Billion) Forecast, by Application 2020 & 2033
- Table 52: United Kingdom Specialty Nitriles Market Volume (K Tons) Forecast, by Application 2020 & 2033
- Table 53: France Specialty Nitriles Market Revenue (Billion) Forecast, by Application 2020 & 2033
- Table 54: France Specialty Nitriles Market Volume (K Tons) Forecast, by Application 2020 & 2033
- Table 55: Italy Specialty Nitriles Market Revenue (Billion) Forecast, by Application 2020 & 2033
- Table 56: Italy Specialty Nitriles Market Volume (K Tons) Forecast, by Application 2020 & 2033
- Table 57: Rest of Europe Specialty Nitriles Market Revenue (Billion) Forecast, by Application 2020 & 2033
- Table 58: Rest of Europe Specialty Nitriles Market Volume (K Tons) Forecast, by Application 2020 & 2033
- Table 59: Global Specialty Nitriles Market Revenue Billion Forecast, by Manufacturing Process 2020 & 2033
- Table 60: Global Specialty Nitriles Market Volume K Tons Forecast, by Manufacturing Process 2020 & 2033
- Table 61: Global Specialty Nitriles Market Revenue Billion Forecast, by Types 2020 & 2033
- Table 62: Global Specialty Nitriles Market Volume K Tons Forecast, by Types 2020 & 2033
- Table 63: Global Specialty Nitriles Market Revenue Billion Forecast, by Application 2020 & 2033
- Table 64: Global Specialty Nitriles Market Volume K Tons Forecast, by Application 2020 & 2033
- Table 65: Global Specialty Nitriles Market Revenue Billion Forecast, by Country 2020 & 2033
- Table 66: Global Specialty Nitriles Market Volume K Tons Forecast, by Country 2020 & 2033
- Table 67: Brazil Specialty Nitriles Market Revenue (Billion) Forecast, by Application 2020 & 2033
- Table 68: Brazil Specialty Nitriles Market Volume (K Tons) Forecast, by Application 2020 & 2033
- Table 69: Argentina Specialty Nitriles Market Revenue (Billion) Forecast, by Application 2020 & 2033
- Table 70: Argentina Specialty Nitriles Market Volume (K Tons) Forecast, by Application 2020 & 2033
- Table 71: Rest of South America Specialty Nitriles Market Revenue (Billion) Forecast, by Application 2020 & 2033
- Table 72: Rest of South America Specialty Nitriles Market Volume (K Tons) Forecast, by Application 2020 & 2033
- Table 73: Global Specialty Nitriles Market Revenue Billion Forecast, by Manufacturing Process 2020 & 2033
- Table 74: Global Specialty Nitriles Market Volume K Tons Forecast, by Manufacturing Process 2020 & 2033
- Table 75: Global Specialty Nitriles Market Revenue Billion Forecast, by Types 2020 & 2033
- Table 76: Global Specialty Nitriles Market Volume K Tons Forecast, by Types 2020 & 2033
- Table 77: Global Specialty Nitriles Market Revenue Billion Forecast, by Application 2020 & 2033
- Table 78: Global Specialty Nitriles Market Volume K Tons Forecast, by Application 2020 & 2033
- Table 79: Global Specialty Nitriles Market Revenue Billion Forecast, by Country 2020 & 2033
- Table 80: Global Specialty Nitriles Market Volume K Tons Forecast, by Country 2020 & 2033
- Table 81: Saudi Arabia Specialty Nitriles Market Revenue (Billion) Forecast, by Application 2020 & 2033
- Table 82: Saudi Arabia Specialty Nitriles Market Volume (K Tons) Forecast, by Application 2020 & 2033
- Table 83: South Africa Specialty Nitriles Market Revenue (Billion) Forecast, by Application 2020 & 2033
- Table 84: South Africa Specialty Nitriles Market Volume (K Tons) Forecast, by Application 2020 & 2033
- Table 85: Rest of Middle East and Africa Specialty Nitriles Market Revenue (Billion) Forecast, by Application 2020 & 2033
- Table 86: Rest of Middle East and Africa Specialty Nitriles Market Volume (K Tons) Forecast, by Application 2020 & 2033
Frequently Asked Questions
1. What is the projected Compound Annual Growth Rate (CAGR) of the Specialty Nitriles Market?
The projected CAGR is approximately 4.5%.
2. Which companies are prominent players in the Specialty Nitriles Market?
Key companies in the market include INEOS, Duraco, Ascend Performance Materials, AlzChem Group AG, Denicso, Speciality Tapes, TIDI Products LLC, Emerald Performance Materials, Parchem fine & specialty chemicals, Marco Rubber & Plastics LLC, Zeon Chemicals L P .
3. What are the main segments of the Specialty Nitriles Market?
The market segments include Manufacturing Process, Types, Application.
4. Can you provide details about the market size?
The market size is estimated to be USD 2.9 Billion as of 2022.
5. What are some drivers contributing to market growth?
; Growing Applications in Automotive Industry; Others Drivers.
6. What are the notable trends driving market growth?
Automotive Components to Dominate the Market.
7. Are there any restraints impacting market growth?
; Health Hazard related to Nitrile Fumes; Unfavorable Conditions Arising Due to COVID-19 Outbreak.
8. Can you provide examples of recent developments in the market?
N/A
9. What pricing options are available for accessing the report?
Pricing options include single-user, multi-user, and enterprise licenses priced at USD 4750, USD 5250, and USD 8750 respectively.
10. Is the market size provided in terms of value or volume?
The market size is provided in terms of value, measured in Billion and volume, measured in K Tons.
11. Are there any specific market keywords associated with the report?
Yes, the market keyword associated with the report is "Specialty Nitriles Market," which aids in identifying and referencing the specific market segment covered.
12. How do I determine which pricing option suits my needs best?
The pricing options vary based on user requirements and access needs. Individual users may opt for single-user licenses, while businesses requiring broader access may choose multi-user or enterprise licenses for cost-effective access to the report.
13. Are there any additional resources or data provided in the Specialty Nitriles Market report?
While the report offers comprehensive insights, it's advisable to review the specific contents or supplementary materials provided to ascertain if additional resources or data are available.
14. How can I stay updated on further developments or reports in the Specialty Nitriles Market?
To stay informed about further developments, trends, and reports in the Specialty Nitriles Market, consider subscribing to industry newsletters, following relevant companies and organizations, or regularly checking reputable industry news sources and publications.
Methodology
Step 1 - Identification of Relevant Samples Size from Population Database


Step 2 - Approaches for Defining Global Market Size (Value, Volume* & Price*)

Note*: In applicable scenarios
Step 3 - Data Sources
Primary Research
- Web Analytics
- Survey Reports
- Research Institute
- Latest Research Reports
- Opinion Leaders
Secondary Research
- Annual Reports
- White Paper
- Latest Press Release
- Industry Association
- Paid Database
- Investor Presentations

Step 4 - Data Triangulation
Involves using different sources of information in order to increase the validity of a study
These sources are likely to be stakeholders in a program - participants, other researchers, program staff, other community members, and so on.
Then we put all data in single framework & apply various statistical tools to find out the dynamic on the market.
During the analysis stage, feedback from the stakeholder groups would be compared to determine areas of agreement as well as areas of divergence