

Key Insights
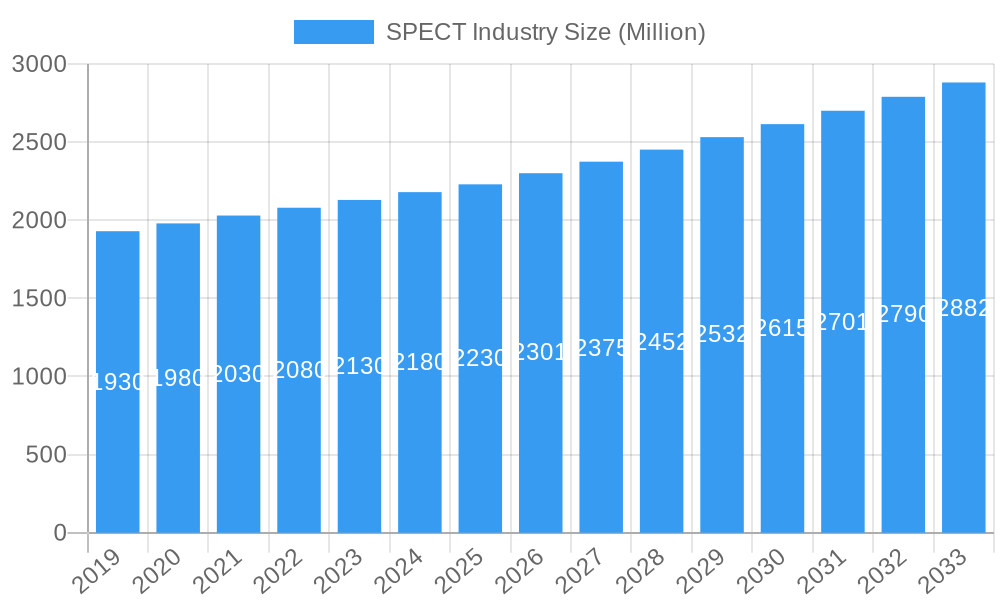
The SPECT (Single-Photon Emission Computed Tomography) market is poised for significant expansion, projected to reach approximately $2.23 billion by 2025 with a robust Compound Annual Growth Rate (CAGR) of 3.20% through 2033. This steady growth trajectory is primarily fueled by the increasing prevalence of chronic diseases, particularly cancer and cardiovascular ailments, which are the leading applications for SPECT imaging. The diagnostic accuracy and therapeutic guidance offered by SPECT, especially with advanced radioisotopes like Tc-99m and Ra-223, make it an indispensable tool in modern healthcare. Furthermore, the growing demand for minimally invasive diagnostic procedures and the continuous development of novel radiopharmaceuticals are key drivers propelling market expansion. The industry is also benefiting from technological advancements in SPECT/CT hybrid systems, enhancing image resolution and diagnostic capabilities.
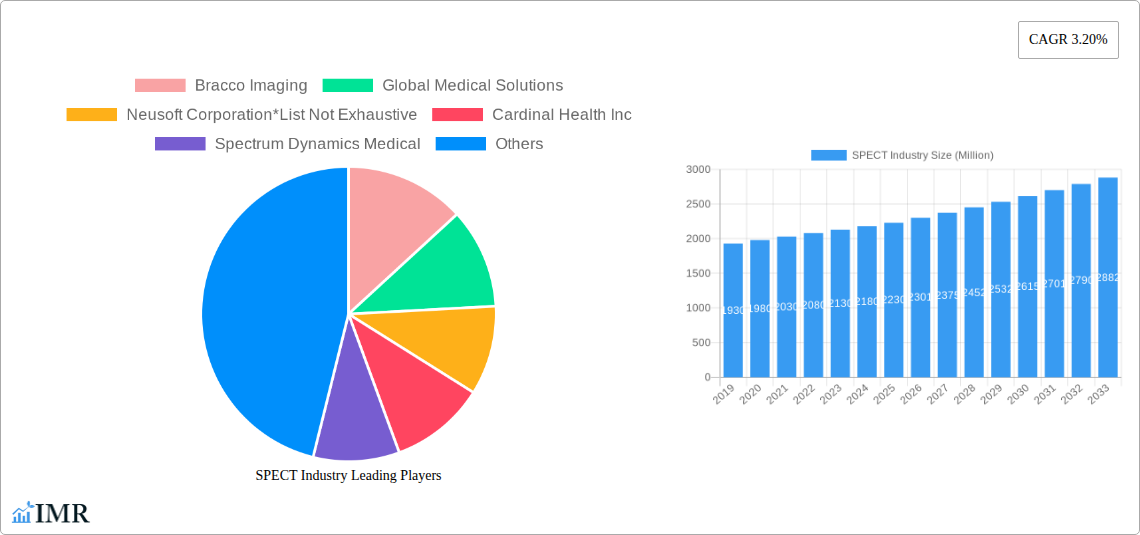
SPECT Industry Market Size (In Billion)
The market's expansion is further supported by increasing healthcare expenditure globally, particularly in emerging economies, and a growing awareness among physicians and patients regarding the benefits of nuclear medicine imaging. While the market shows strong upward momentum, certain factors could influence its growth. Potential restraints include the high cost of SPECT equipment and radioisotope production, as well as the stringent regulatory approvals required for new radiopharmaceuticals. However, the strategic initiatives undertaken by key players, including R&D investments and collaborations, are aimed at overcoming these challenges. The geographical landscape indicates a strong presence in North America and Europe, with the Asia Pacific region exhibiting the highest growth potential due to improving healthcare infrastructure and rising disposable incomes. Oncology and Cardiology are expected to remain dominant application segments, driving demand for radioisotopes and imaging technologies.
SPECT Industry Company Market Share
SPECT Industry Report: Market Dynamics, Growth Trends, and Future Outlook (2019-2033)
This comprehensive report provides an in-depth analysis of the global Single Photon Emission Computed Tomography (SPECT) industry, offering critical insights into market dynamics, growth trajectories, and future potential. Covering the study period from 2019 to 2033, with a base and estimated year of 2025, this report is an indispensable resource for industry stakeholders, investors, and decision-makers. We delve into the intricate market structure, analyze key growth drivers, identify dominant regions and segments, and explore the product landscape, alongside significant challenges, opportunities, and key players shaping the future of SPECT imaging. All quantitative values are presented in Million Units.
SPECT Industry Market Dynamics & Structure
The SPECT industry exhibits a moderately concentrated market structure, characterized by a blend of established global players and specialized niche manufacturers. Technological innovation is the primary driver, with ongoing advancements in radiotracer development, detector technologies, and image processing software constantly pushing the boundaries of diagnostic accuracy. Regulatory frameworks, particularly those governing the use of radioactive materials and medical device approvals, play a crucial role in shaping market entry and product lifecycles. Competitive product substitutes, primarily from the expanding PET imaging segment and advanced MRI techniques, present a constant challenge, necessitating continuous innovation in SPECT to maintain its diagnostic relevance. End-user demographics are shifting, with an aging global population and a rising prevalence of chronic diseases like cancer and cardiovascular conditions fueling demand. Mergers and acquisitions (M&A) are moderately active, as larger companies seek to consolidate market share, acquire innovative technologies, and expand their product portfolios. For instance, in the historical period of 2019-2024, there were approximately 5-7 significant M&A deals annually, with an average deal volume of around $50-100 Million. Innovation barriers include the high cost of research and development for novel radiopharmaceuticals and the stringent regulatory approval processes, often taking 5-10 years and significant financial investment.
- Market Concentration: Moderately concentrated, with a few key global players and numerous smaller entities.
- Technological Innovation: Driven by radiotracer development, detector advancements, and AI-powered image reconstruction.
- Regulatory Frameworks: Stringent, impacting product approvals and market access.
- Competitive Substitutes: PET, MRI, and advanced ultrasound technologies.
- End-User Demographics: Growing demand from aging populations and rising chronic disease incidence.
- M&A Trends: Moderate activity focused on portfolio expansion and technological acquisition.
- Innovation Barriers: High R&D costs, lengthy regulatory approval cycles.
SPECT Industry Growth Trends & Insights
The global SPECT industry is poised for robust growth, projected to expand at a Compound Annual Growth Rate (CAGR) of approximately 4.5% from 2025 to 2033. This growth will be underpinned by the increasing demand for diagnostic imaging solutions, particularly in the oncology and cardiology segments, driven by an aging global population and the escalating burden of chronic diseases. Market penetration of advanced SPECT systems, equipped with higher sensitivity detectors and more sophisticated software, is on an upward trajectory, offering enhanced diagnostic precision and reduced scan times. Technological disruptions, such as the development of novel radiotracers for specific molecular targets and the integration of artificial intelligence (AI) for image analysis and workflow optimization, are set to revolutionize SPECT imaging. Consumer behavior shifts are also playing a significant role, with a growing patient preference for non-invasive diagnostic procedures and a greater emphasis on early disease detection.
In the forecast period, the market size is estimated to reach approximately $8,500 Million by 2033, up from an estimated $6,200 Million in 2025. This growth will be fueled by increased adoption rates of SPECT imaging in emerging economies, where healthcare infrastructure is rapidly developing, and the demand for advanced diagnostic tools is on the rise. Furthermore, the expanding research into new applications of SPECT, beyond its traditional uses, is expected to unlock further market potential. For example, research into SPECT for neurological disorders, such as Alzheimer's and Parkinson's disease, is gaining momentum, paving the way for new diagnostic and therapeutic monitoring applications. The continuous refinement of existing SPECT technologies, leading to improved image quality and reduced radiation exposure for patients, will also contribute to sustained market growth. The integration of SPECT with other imaging modalities, creating hybrid systems, is another area of significant growth, offering complementary diagnostic information and enhancing diagnostic confidence.
Dominant Regions, Countries, or Segments in SPECT Industry
North America currently holds a dominant position in the global SPECT industry, driven by its advanced healthcare infrastructure, high per capita healthcare spending, and a strong emphasis on research and development. The United States, in particular, is a key market due to the high prevalence of chronic diseases, widespread adoption of advanced medical technologies, and a favorable regulatory environment for innovative medical devices. In terms of radioisotope type, Technetium-99m (Tc-99m) remains the most dominant, accounting for an estimated 70-75% of the total SPECT market by volume. This is attributed to its well-established use in a wide range of diagnostic procedures, its favorable physical properties, and the relatively mature supply chain.
In terms of application, Oncology is the leading segment, representing approximately 40-45% of the SPECT market. The increasing incidence of various cancers worldwide, coupled with the need for accurate staging, treatment monitoring, and recurrence detection, significantly drives the demand for SPECT imaging in cancer care. Cardiology follows closely, with SPECT playing a crucial role in diagnosing and managing ischemic heart disease, heart failure, and other cardiovascular conditions, accounting for around 30-35% of the market. Neurology applications, while smaller in current market share (around 10-15%), are showing significant growth potential due to ongoing research into neurodegenerative diseases and psychiatric disorders.
The dominance of North America is further bolstered by strong economic policies supporting healthcare innovation and robust research institutions. The availability of sophisticated diagnostic centers and well-trained medical professionals ensures the effective utilization of SPECT technology. Europe also represents a significant market, driven by similar factors to North America, including advanced healthcare systems and a growing focus on personalized medicine. Emerging economies in Asia-Pacific are expected to witness the fastest growth, owing to increasing healthcare investments, a rising middle class, and a growing awareness of advanced diagnostic techniques. The expansion of radiopharmacies and the increasing availability of SPECT equipment in these regions will accelerate their market penetration. The ongoing development of Tc-99m generators and a stable supply chain are critical to maintaining its dominance, though research into alternative isotopes for specific applications is also progressing.
- Dominant Region: North America (with the United States as a key country).
- Leading Radioisotope: Technetium-99m (Tc-99m) - ~70-75% market share.
- Leading Application: Oncology - ~40-45% market share.
- Second Leading Application: Cardiology - ~30-35% market share.
- Growth Potential Application: Neurology.
- Key Drivers in Dominant Regions: Advanced healthcare infrastructure, R&D investment, favorable policies, high per capita spending.
SPECT Industry Product Landscape
The SPECT industry product landscape is characterized by continuous innovation aimed at enhancing diagnostic capabilities and patient care. Leading companies are focusing on developing SPECT systems with improved detector sensitivity and resolution, enabling clearer imaging and faster scan times. Innovations in radiotracer development are a significant trend, with a focus on creating targeted radiopharmaceuticals for specific molecular pathways, particularly in oncology and neurology. For example, advancements in Gallium-68 (Ga-68) based radiotracers, while primarily associated with PET, are also influencing SPECT tracer research for similar targets. Software advancements, including AI-powered image reconstruction and analysis tools, are playing a crucial role in improving diagnostic accuracy and streamlining workflows. These technological advancements allow for the visualization of physiological processes at the molecular level, providing critical information for disease diagnosis, staging, and treatment monitoring. The integration of SPECT with other imaging modalities, such as CT and MRI, to create SPECT/CT and SPECT/MRI hybrid systems, offers comprehensive anatomical and functional information, enhancing diagnostic confidence and reducing the need for multiple imaging sessions.
Key Drivers, Barriers & Challenges in SPECT Industry
The SPECT industry is propelled by several key drivers, including the increasing global burden of chronic diseases like cancer and cardiovascular disorders, necessitating advanced diagnostic imaging solutions. The aging global population, with its associated health challenges, further fuels demand. Technological advancements in detector technology and radiotracer development are enhancing diagnostic accuracy and expanding the applications of SPECT imaging. Furthermore, growing healthcare expenditure in emerging economies and the increasing availability of SPECT systems in these regions are significant growth accelerators.
However, the industry faces several barriers and challenges. The high cost of SPECT equipment and radiopharmaceuticals can be a significant restraint, particularly in resource-limited settings. Stringent regulatory approval processes for new radiotracers and imaging devices can lead to lengthy market entry timelines. Competition from alternative imaging modalities, particularly PET, poses a continuous threat, requiring SPECT to demonstrate its unique value proposition. Supply chain disruptions for essential radioisotopes, such as Molybdenum-99 (Mo-99) which is a precursor for Tc-99m, can impact product availability and pricing. The safe handling and disposal of radioactive materials also present logistical and regulatory challenges.
Emerging Opportunities in SPECT Industry
Emerging opportunities in the SPECT industry lie in the development of novel, targeted radiotracers for specific molecular targets in oncology, neurology, and inflammatory diseases. The growing interest in theranostics, combining diagnostic imaging with targeted radionuclide therapy, presents a significant avenue for growth. There is also an untapped market in expanding the use of SPECT for infectious disease imaging and for monitoring treatment response in a wider range of therapeutic interventions. Furthermore, the integration of AI and machine learning for enhanced image analysis, predictive modeling, and workflow optimization offers substantial potential to improve efficiency and diagnostic accuracy. The increasing demand for point-of-care SPECT imaging solutions in remote or underserved areas also represents a significant opportunity.
Growth Accelerators in the SPECT Industry Industry
Several catalysts are accelerating the growth of the SPECT industry. Continuous innovation in radiopharmaceutical development, focusing on personalized medicine and targeted therapies, is a major growth accelerator. Strategic partnerships between radiopharmaceutical manufacturers, imaging equipment providers, and healthcare institutions are fostering collaborative research and market expansion. The increasing adoption of SPECT/CT hybrid systems, offering fused anatomical and functional imaging, is significantly enhancing diagnostic capabilities and driving market growth. Furthermore, government initiatives and increasing healthcare investments in emerging economies are creating new market opportunities and driving demand for advanced diagnostic imaging technologies. The development of more efficient Mo-99 production methods and a stable supply chain for Tc-99m will also act as a significant growth accelerator.
Key Players Shaping the SPECT Industry Market
- Bracco Imaging
- GE Healthcare (GE Company)
- Cardinal Health Inc
- Guerbet
- Lantheus Medical Imaging Inc
- Curium
- Spectrum Dynamics Medical
- Neusoft Corporation
- Digirad Corporation
- Gamma Medica Inc
- Global Medical Solutions
- NTP Radioisotopes SOC Ltd
Notable Milestones in SPECT Industry Sector
- 2019: Introduction of advanced SPECT detectors with higher sensitivity and improved spatial resolution by leading manufacturers.
- 2020: Increased research focus on novel radiotracers for Alzheimer's disease detection using SPECT.
- 2021: Launch of AI-powered software solutions for automated image analysis in SPECT imaging.
- 2022: Expansion of theranostic applications with new radiotracer combinations for specific cancer types.
- 2023: Significant advancements in SPECT/CT hybrid system capabilities, offering more fused imaging options.
- 2024: Growing adoption of SPECT in emerging markets, driven by increased healthcare investment and infrastructure development.
In-Depth SPECT Industry Market Outlook
The future outlook for the SPECT industry remains highly positive, driven by ongoing technological advancements and a sustained demand for precise diagnostic imaging. The market is expected to witness continued growth, fueled by innovations in radiotracer development for targeted therapies and the expanding role of AI in image analysis. Strategic collaborations and the increasing focus on theranostics will further solidify SPECT's position in personalized medicine. The growing adoption in emerging economies and the continued emphasis on early disease detection will ensure a robust growth trajectory, making the SPECT industry a vital component of global healthcare diagnostics. The market is projected to expand by approximately 25-30% between 2025 and 2033.
SPECT Industry Segmentation
-
1. Type of Radioisotopes
- 1.1. Tc-99m
- 1.2. Ra-223
- 1.3. Ga-67
- 1.4. I-123
- 1.5. Other Types of Radioisotopes
-
2. Application
- 2.1. Oncology
- 2.2. Cardiology
- 2.3. Neurology
- 2.4. Other Applications
SPECT Industry Segmentation By Geography
-
1. North America
- 1.1. United States
- 1.2. Canada
- 1.3. Mexico
-
2. Europe
- 2.1. Germany
- 2.2. United Kingdom
- 2.3. France
- 2.4. Italy
- 2.5. Spain
- 2.6. Rest of Europe
-
3. Asia Pacific
- 3.1. China
- 3.2. Japan
- 3.3. India
- 3.4. Australia
- 3.5. South Korea
- 3.6. Rest of Asia Pacific
-
4. Middle East and Africa
- 4.1. GCC
- 4.2. South Africa
- 4.3. Rest of Middle East and Africa
-
5. South America
- 5.1. Brazil
- 5.2. Argentina
- 5.3. Rest of South America
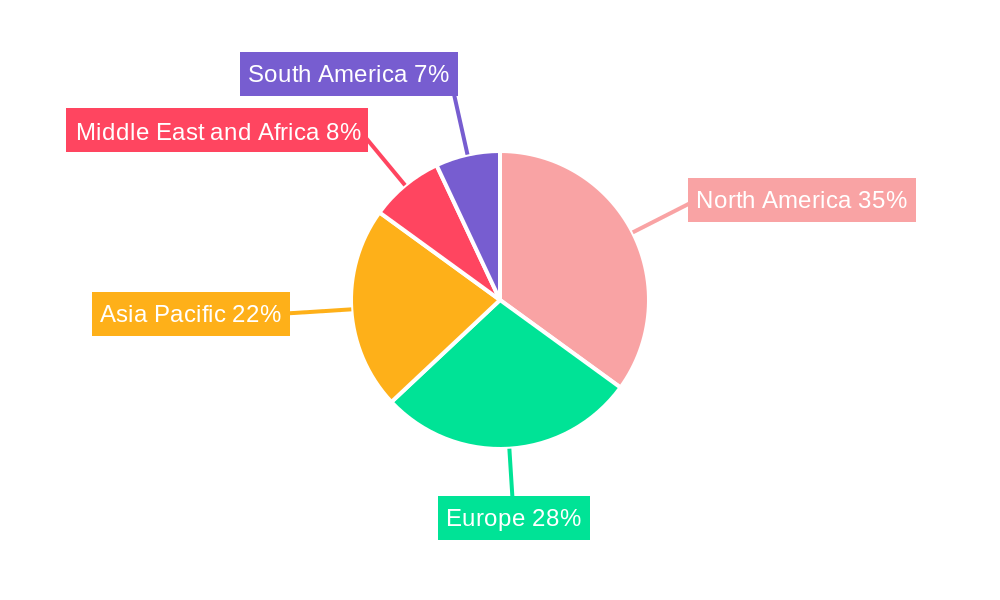
SPECT Industry Regional Market Share
Geographic Coverage of SPECT Industry
SPECT Industry REPORT HIGHLIGHTS
| Aspects | Details |
|---|---|
| Study Period | 2020-2034 |
| Base Year | 2025 |
| Estimated Year | 2026 |
| Forecast Period | 2026-2034 |
| Historical Period | 2020-2025 |
| Growth Rate | CAGR of 3.20% from 2020-2034 |
| Segmentation |
|
Table of Contents
- 1. Introduction
- 1.1. Research Scope
- 1.2. Market Segmentation
- 1.3. Research Objective
- 1.4. Definitions and Assumptions
- 2. Executive Summary
- 2.1. Market Snapshot
- 3. Market Dynamics
- 3.1. Market Drivers
- 3.2. Market Restrains
- 3.3. Market Trends
- 3.4. Market Opportunities
- 4. Market Factor Analysis
- 4.1. Porters Five Forces
- 4.1.1. Bargaining Power of Suppliers
- 4.1.2. Bargaining Power of Buyers
- 4.1.3. Threat of New Entrants
- 4.1.4. Threat of Substitutes
- 4.1.5. Competitive Rivalry
- 4.2. PESTEL analysis
- 4.3. BCG Analysis
- 4.3.1. Stars (High Growth, High Market Share)
- 4.3.2. Cash Cows (Low Growth, High Market Share)
- 4.3.3. Question Mark (High Growth, Low Market Share)
- 4.3.4. Dogs (Low Growth, Low Market Share)
- 4.4. Ansoff Matrix Analysis
- 4.5. Supply Chain Analysis
- 4.6. Regulatory Landscape
- 4.7. Current Market Potential and Opportunity Assessment (TAM–SAM–SOM Framework)
- 4.8. IMR Analyst Note
- 4.1. Porters Five Forces
- 5. Market Analysis, Insights and Forecast 2021-2033
- 5.1. Market Analysis, Insights and Forecast - by Type of Radioisotopes
- 5.1.1. Tc-99m
- 5.1.2. Ra-223
- 5.1.3. Ga-67
- 5.1.4. I-123
- 5.1.5. Other Types of Radioisotopes
- 5.2. Market Analysis, Insights and Forecast - by Application
- 5.2.1. Oncology
- 5.2.2. Cardiology
- 5.2.3. Neurology
- 5.2.4. Other Applications
- 5.3. Market Analysis, Insights and Forecast - by Region
- 5.3.1. North America
- 5.3.2. Europe
- 5.3.3. Asia Pacific
- 5.3.4. Middle East and Africa
- 5.3.5. South America
- 5.1. Market Analysis, Insights and Forecast - by Type of Radioisotopes
- 6. Global SPECT Industry Analysis, Insights and Forecast, 2021-2033
- 6.1. Market Analysis, Insights and Forecast - by Type of Radioisotopes
- 6.1.1. Tc-99m
- 6.1.2. Ra-223
- 6.1.3. Ga-67
- 6.1.4. I-123
- 6.1.5. Other Types of Radioisotopes
- 6.2. Market Analysis, Insights and Forecast - by Application
- 6.2.1. Oncology
- 6.2.2. Cardiology
- 6.2.3. Neurology
- 6.2.4. Other Applications
- 6.1. Market Analysis, Insights and Forecast - by Type of Radioisotopes
- 7. North America SPECT Industry Analysis, Insights and Forecast, 2020-2032
- 7.1. Market Analysis, Insights and Forecast - by Type of Radioisotopes
- 7.1.1. Tc-99m
- 7.1.2. Ra-223
- 7.1.3. Ga-67
- 7.1.4. I-123
- 7.1.5. Other Types of Radioisotopes
- 7.2. Market Analysis, Insights and Forecast - by Application
- 7.2.1. Oncology
- 7.2.2. Cardiology
- 7.2.3. Neurology
- 7.2.4. Other Applications
- 7.1. Market Analysis, Insights and Forecast - by Type of Radioisotopes
- 8. Europe SPECT Industry Analysis, Insights and Forecast, 2020-2032
- 8.1. Market Analysis, Insights and Forecast - by Type of Radioisotopes
- 8.1.1. Tc-99m
- 8.1.2. Ra-223
- 8.1.3. Ga-67
- 8.1.4. I-123
- 8.1.5. Other Types of Radioisotopes
- 8.2. Market Analysis, Insights and Forecast - by Application
- 8.2.1. Oncology
- 8.2.2. Cardiology
- 8.2.3. Neurology
- 8.2.4. Other Applications
- 8.1. Market Analysis, Insights and Forecast - by Type of Radioisotopes
- 9. Asia Pacific SPECT Industry Analysis, Insights and Forecast, 2020-2032
- 9.1. Market Analysis, Insights and Forecast - by Type of Radioisotopes
- 9.1.1. Tc-99m
- 9.1.2. Ra-223
- 9.1.3. Ga-67
- 9.1.4. I-123
- 9.1.5. Other Types of Radioisotopes
- 9.2. Market Analysis, Insights and Forecast - by Application
- 9.2.1. Oncology
- 9.2.2. Cardiology
- 9.2.3. Neurology
- 9.2.4. Other Applications
- 9.1. Market Analysis, Insights and Forecast - by Type of Radioisotopes
- 10. Middle East and Africa SPECT Industry Analysis, Insights and Forecast, 2020-2032
- 10.1. Market Analysis, Insights and Forecast - by Type of Radioisotopes
- 10.1.1. Tc-99m
- 10.1.2. Ra-223
- 10.1.3. Ga-67
- 10.1.4. I-123
- 10.1.5. Other Types of Radioisotopes
- 10.2. Market Analysis, Insights and Forecast - by Application
- 10.2.1. Oncology
- 10.2.2. Cardiology
- 10.2.3. Neurology
- 10.2.4. Other Applications
- 10.1. Market Analysis, Insights and Forecast - by Type of Radioisotopes
- 11. South America SPECT Industry Analysis, Insights and Forecast, 2020-2032
- 11.1. Market Analysis, Insights and Forecast - by Type of Radioisotopes
- 11.1.1. Tc-99m
- 11.1.2. Ra-223
- 11.1.3. Ga-67
- 11.1.4. I-123
- 11.1.5. Other Types of Radioisotopes
- 11.2. Market Analysis, Insights and Forecast - by Application
- 11.2.1. Oncology
- 11.2.2. Cardiology
- 11.2.3. Neurology
- 11.2.4. Other Applications
- 11.1. Market Analysis, Insights and Forecast - by Type of Radioisotopes
- 12. Competitive Analysis
- 12.1. Company Profiles
- 12.1.1 Bracco Imaging
- 12.1.1.1. Company Overview
- 12.1.1.2. Products
- 12.1.1.3. Company Financials
- 12.1.1.4. SWOT Analysis
- 12.1.2 Global Medical Solutions
- 12.1.2.1. Company Overview
- 12.1.2.2. Products
- 12.1.2.3. Company Financials
- 12.1.2.4. SWOT Analysis
- 12.1.3 Neusoft Corporation*List Not Exhaustive
- 12.1.3.1. Company Overview
- 12.1.3.2. Products
- 12.1.3.3. Company Financials
- 12.1.3.4. SWOT Analysis
- 12.1.4 Cardinal Health Inc
- 12.1.4.1. Company Overview
- 12.1.4.2. Products
- 12.1.4.3. Company Financials
- 12.1.4.4. SWOT Analysis
- 12.1.5 Spectrum Dynamics Medical
- 12.1.5.1. Company Overview
- 12.1.5.2. Products
- 12.1.5.3. Company Financials
- 12.1.5.4. SWOT Analysis
- 12.1.6 Guerbet
- 12.1.6.1. Company Overview
- 12.1.6.2. Products
- 12.1.6.3. Company Financials
- 12.1.6.4. SWOT Analysis
- 12.1.7 NTP Radioisotopes SOC Ltd
- 12.1.7.1. Company Overview
- 12.1.7.2. Products
- 12.1.7.3. Company Financials
- 12.1.7.4. SWOT Analysis
- 12.1.8 Lantheus Medical Imaging Inc
- 12.1.8.1. Company Overview
- 12.1.8.2. Products
- 12.1.8.3. Company Financials
- 12.1.8.4. SWOT Analysis
- 12.1.9 Gamma Medica Inc
- 12.1.9.1. Company Overview
- 12.1.9.2. Products
- 12.1.9.3. Company Financials
- 12.1.9.4. SWOT Analysis
- 12.1.10 GE Healthcare (GE Company)
- 12.1.10.1. Company Overview
- 12.1.10.2. Products
- 12.1.10.3. Company Financials
- 12.1.10.4. SWOT Analysis
- 12.1.11 Curium
- 12.1.11.1. Company Overview
- 12.1.11.2. Products
- 12.1.11.3. Company Financials
- 12.1.11.4. SWOT Analysis
- 12.1.12 Digirad Corporation
- 12.1.12.1. Company Overview
- 12.1.12.2. Products
- 12.1.12.3. Company Financials
- 12.1.12.4. SWOT Analysis
- 12.1.1 Bracco Imaging
- 12.2. Market Entropy
- 12.2.1 Company's Key Areas Served
- 12.2.2 Recent Developments
- 12.3. Company Market Share Analysis 2025
- 12.3.1 Top 5 Companies Market Share Analysis
- 12.3.2 Top 3 Companies Market Share Analysis
- 12.4. List of Potential Customers
- 13. Research Methodology
List of Figures
- Figure 1: Global SPECT Industry Revenue Breakdown (Million, %) by Region 2025 & 2033
- Figure 2: North America SPECT Industry Revenue (Million), by Type of Radioisotopes 2025 & 2033
- Figure 3: North America SPECT Industry Revenue Share (%), by Type of Radioisotopes 2025 & 2033
- Figure 4: North America SPECT Industry Revenue (Million), by Application 2025 & 2033
- Figure 5: North America SPECT Industry Revenue Share (%), by Application 2025 & 2033
- Figure 6: North America SPECT Industry Revenue (Million), by Country 2025 & 2033
- Figure 7: North America SPECT Industry Revenue Share (%), by Country 2025 & 2033
- Figure 8: Europe SPECT Industry Revenue (Million), by Type of Radioisotopes 2025 & 2033
- Figure 9: Europe SPECT Industry Revenue Share (%), by Type of Radioisotopes 2025 & 2033
- Figure 10: Europe SPECT Industry Revenue (Million), by Application 2025 & 2033
- Figure 11: Europe SPECT Industry Revenue Share (%), by Application 2025 & 2033
- Figure 12: Europe SPECT Industry Revenue (Million), by Country 2025 & 2033
- Figure 13: Europe SPECT Industry Revenue Share (%), by Country 2025 & 2033
- Figure 14: Asia Pacific SPECT Industry Revenue (Million), by Type of Radioisotopes 2025 & 2033
- Figure 15: Asia Pacific SPECT Industry Revenue Share (%), by Type of Radioisotopes 2025 & 2033
- Figure 16: Asia Pacific SPECT Industry Revenue (Million), by Application 2025 & 2033
- Figure 17: Asia Pacific SPECT Industry Revenue Share (%), by Application 2025 & 2033
- Figure 18: Asia Pacific SPECT Industry Revenue (Million), by Country 2025 & 2033
- Figure 19: Asia Pacific SPECT Industry Revenue Share (%), by Country 2025 & 2033
- Figure 20: Middle East and Africa SPECT Industry Revenue (Million), by Type of Radioisotopes 2025 & 2033
- Figure 21: Middle East and Africa SPECT Industry Revenue Share (%), by Type of Radioisotopes 2025 & 2033
- Figure 22: Middle East and Africa SPECT Industry Revenue (Million), by Application 2025 & 2033
- Figure 23: Middle East and Africa SPECT Industry Revenue Share (%), by Application 2025 & 2033
- Figure 24: Middle East and Africa SPECT Industry Revenue (Million), by Country 2025 & 2033
- Figure 25: Middle East and Africa SPECT Industry Revenue Share (%), by Country 2025 & 2033
- Figure 26: South America SPECT Industry Revenue (Million), by Type of Radioisotopes 2025 & 2033
- Figure 27: South America SPECT Industry Revenue Share (%), by Type of Radioisotopes 2025 & 2033
- Figure 28: South America SPECT Industry Revenue (Million), by Application 2025 & 2033
- Figure 29: South America SPECT Industry Revenue Share (%), by Application 2025 & 2033
- Figure 30: South America SPECT Industry Revenue (Million), by Country 2025 & 2033
- Figure 31: South America SPECT Industry Revenue Share (%), by Country 2025 & 2033
List of Tables
- Table 1: Global SPECT Industry Revenue Million Forecast, by Type of Radioisotopes 2020 & 2033
- Table 2: Global SPECT Industry Revenue Million Forecast, by Application 2020 & 2033
- Table 3: Global SPECT Industry Revenue Million Forecast, by Region 2020 & 2033
- Table 4: Global SPECT Industry Revenue Million Forecast, by Type of Radioisotopes 2020 & 2033
- Table 5: Global SPECT Industry Revenue Million Forecast, by Application 2020 & 2033
- Table 6: Global SPECT Industry Revenue Million Forecast, by Country 2020 & 2033
- Table 7: United States SPECT Industry Revenue (Million) Forecast, by Application 2020 & 2033
- Table 8: Canada SPECT Industry Revenue (Million) Forecast, by Application 2020 & 2033
- Table 9: Mexico SPECT Industry Revenue (Million) Forecast, by Application 2020 & 2033
- Table 10: Global SPECT Industry Revenue Million Forecast, by Type of Radioisotopes 2020 & 2033
- Table 11: Global SPECT Industry Revenue Million Forecast, by Application 2020 & 2033
- Table 12: Global SPECT Industry Revenue Million Forecast, by Country 2020 & 2033
- Table 13: Germany SPECT Industry Revenue (Million) Forecast, by Application 2020 & 2033
- Table 14: United Kingdom SPECT Industry Revenue (Million) Forecast, by Application 2020 & 2033
- Table 15: France SPECT Industry Revenue (Million) Forecast, by Application 2020 & 2033
- Table 16: Italy SPECT Industry Revenue (Million) Forecast, by Application 2020 & 2033
- Table 17: Spain SPECT Industry Revenue (Million) Forecast, by Application 2020 & 2033
- Table 18: Rest of Europe SPECT Industry Revenue (Million) Forecast, by Application 2020 & 2033
- Table 19: Global SPECT Industry Revenue Million Forecast, by Type of Radioisotopes 2020 & 2033
- Table 20: Global SPECT Industry Revenue Million Forecast, by Application 2020 & 2033
- Table 21: Global SPECT Industry Revenue Million Forecast, by Country 2020 & 2033
- Table 22: China SPECT Industry Revenue (Million) Forecast, by Application 2020 & 2033
- Table 23: Japan SPECT Industry Revenue (Million) Forecast, by Application 2020 & 2033
- Table 24: India SPECT Industry Revenue (Million) Forecast, by Application 2020 & 2033
- Table 25: Australia SPECT Industry Revenue (Million) Forecast, by Application 2020 & 2033
- Table 26: South Korea SPECT Industry Revenue (Million) Forecast, by Application 2020 & 2033
- Table 27: Rest of Asia Pacific SPECT Industry Revenue (Million) Forecast, by Application 2020 & 2033
- Table 28: Global SPECT Industry Revenue Million Forecast, by Type of Radioisotopes 2020 & 2033
- Table 29: Global SPECT Industry Revenue Million Forecast, by Application 2020 & 2033
- Table 30: Global SPECT Industry Revenue Million Forecast, by Country 2020 & 2033
- Table 31: GCC SPECT Industry Revenue (Million) Forecast, by Application 2020 & 2033
- Table 32: South Africa SPECT Industry Revenue (Million) Forecast, by Application 2020 & 2033
- Table 33: Rest of Middle East and Africa SPECT Industry Revenue (Million) Forecast, by Application 2020 & 2033
- Table 34: Global SPECT Industry Revenue Million Forecast, by Type of Radioisotopes 2020 & 2033
- Table 35: Global SPECT Industry Revenue Million Forecast, by Application 2020 & 2033
- Table 36: Global SPECT Industry Revenue Million Forecast, by Country 2020 & 2033
- Table 37: Brazil SPECT Industry Revenue (Million) Forecast, by Application 2020 & 2033
- Table 38: Argentina SPECT Industry Revenue (Million) Forecast, by Application 2020 & 2033
- Table 39: Rest of South America SPECT Industry Revenue (Million) Forecast, by Application 2020 & 2033
Frequently Asked Questions
1. What is the projected Compound Annual Growth Rate (CAGR) of the SPECT Industry?
The projected CAGR is approximately 3.20%.
2. Which companies are prominent players in the SPECT Industry?
Key companies in the market include Bracco Imaging, Global Medical Solutions, Neusoft Corporation*List Not Exhaustive, Cardinal Health Inc, Spectrum Dynamics Medical, Guerbet, NTP Radioisotopes SOC Ltd, Lantheus Medical Imaging Inc, Gamma Medica Inc, GE Healthcare (GE Company), Curium, Digirad Corporation.
3. What are the main segments of the SPECT Industry?
The market segments include Type of Radioisotopes, Application.
4. Can you provide details about the market size?
The market size is estimated to be USD 2.23 Million as of 2022.
5. What are some drivers contributing to market growth?
Increasing Demand for SPECT Analysis in Radiopharmaceuticals; Growing Geriatric Population; Improvements in SPECT Imaging Technology.
6. What are the notable trends driving market growth?
The Gallium-67 Segment is Expected to Witness a Large CAGR Over the Forecast Period in the Single Photon Emission Computed Tomography (SPECT) Market.
7. Are there any restraints impacting market growth?
Shorter Half-life of Radioisotopes; Stringent Regulatory Guidelines.
8. Can you provide examples of recent developments in the market?
N/A
9. What pricing options are available for accessing the report?
Pricing options include single-user, multi-user, and enterprise licenses priced at USD 4750, USD 5250, and USD 8750 respectively.
10. Is the market size provided in terms of value or volume?
The market size is provided in terms of value, measured in Million.
11. Are there any specific market keywords associated with the report?
Yes, the market keyword associated with the report is "SPECT Industry," which aids in identifying and referencing the specific market segment covered.
12. How do I determine which pricing option suits my needs best?
The pricing options vary based on user requirements and access needs. Individual users may opt for single-user licenses, while businesses requiring broader access may choose multi-user or enterprise licenses for cost-effective access to the report.
13. Are there any additional resources or data provided in the SPECT Industry report?
While the report offers comprehensive insights, it's advisable to review the specific contents or supplementary materials provided to ascertain if additional resources or data are available.
14. How can I stay updated on further developments or reports in the SPECT Industry?
To stay informed about further developments, trends, and reports in the SPECT Industry, consider subscribing to industry newsletters, following relevant companies and organizations, or regularly checking reputable industry news sources and publications.
Methodology
Step 1 - Identification of Relevant Samples Size from Population Database


Step 2 - Approaches for Defining Global Market Size (Value, Volume* & Price*)

Note*: In applicable scenarios
Step 3 - Data Sources
Primary Research
- Web Analytics
- Survey Reports
- Research Institute
- Latest Research Reports
- Opinion Leaders
Secondary Research
- Annual Reports
- White Paper
- Latest Press Release
- Industry Association
- Paid Database
- Investor Presentations

Step 4 - Data Triangulation
Involves using different sources of information in order to increase the validity of a study
These sources are likely to be stakeholders in a program - participants, other researchers, program staff, other community members, and so on.
Then we put all data in single framework & apply various statistical tools to find out the dynamic on the market.
During the analysis stage, feedback from the stakeholder groups would be compared to determine areas of agreement as well as areas of divergence