

Key Insights
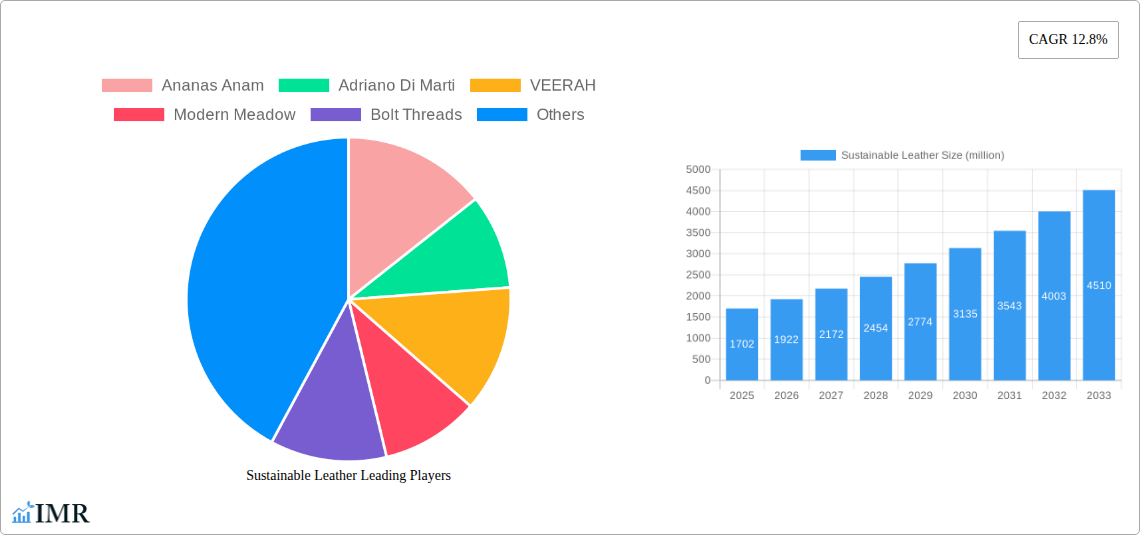
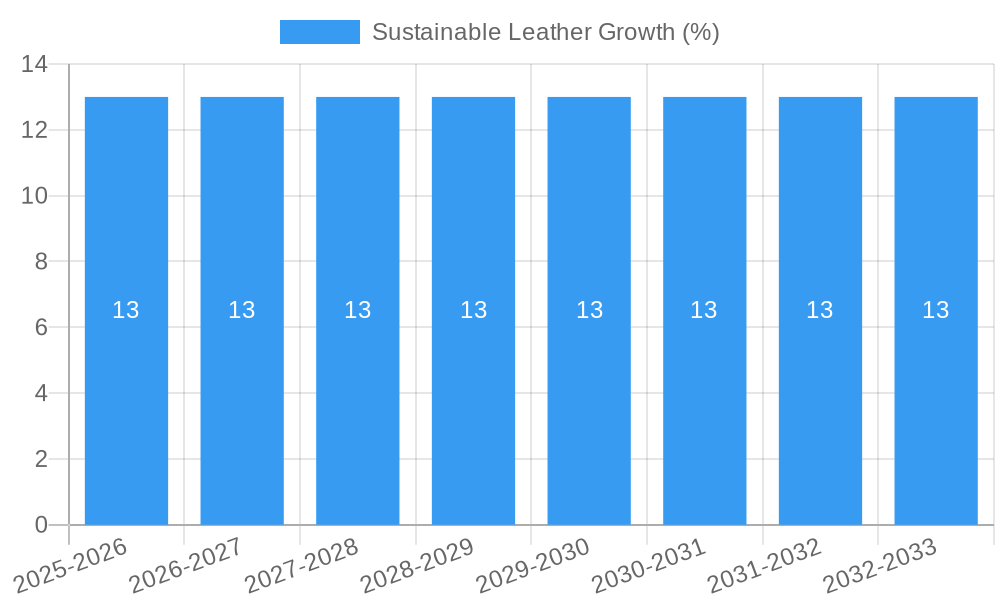
The global Sustainable Leather market is poised for remarkable expansion, projected to reach a substantial market size of $1702 million by 2025. This impressive growth is fueled by a compelling compound annual growth rate (CAGR) of 12.8% over the forecast period from 2025 to 2033. The market's dynamism is driven by a confluence of factors, primarily the increasing consumer demand for eco-friendly and ethically sourced products, coupled with stringent environmental regulations that are pushing industries towards sustainable alternatives. Furthermore, advancements in material science and innovative manufacturing processes are continuously improving the quality, durability, and aesthetic appeal of sustainable leather alternatives, making them increasingly competitive with traditional leather. Key drivers include a growing awareness of the environmental impact of conventional leather production, such as water pollution, deforestation, and greenhouse gas emissions, which are encouraging a shift towards plant-based and bio-engineered materials.
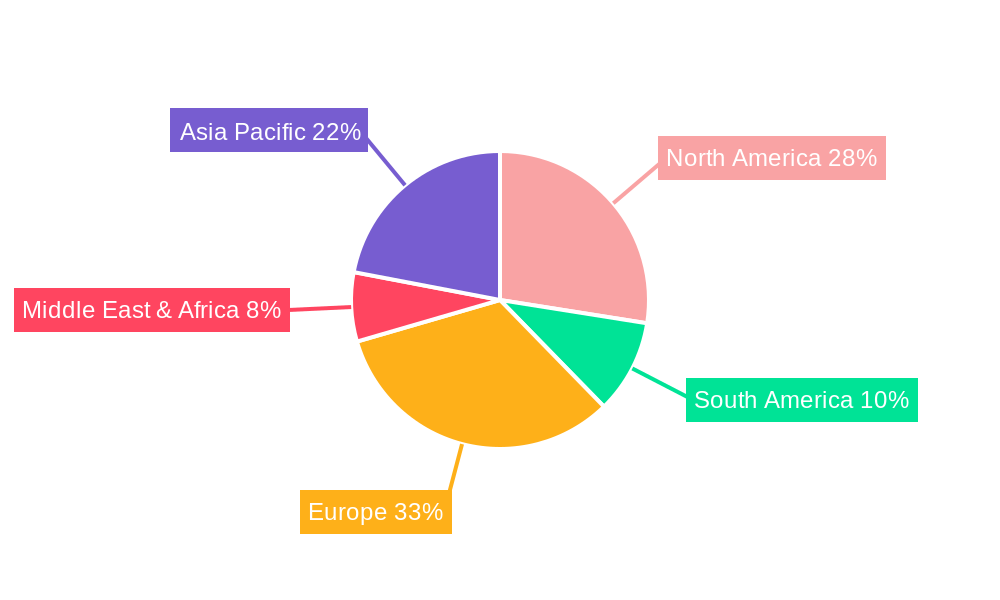
The diverse range of applications for sustainable leather, spanning clothing, footwear, and accessories, alongside emerging uses in other sectors, underscores its versatility and broad market appeal. Innovations in materials like cactus leather and mycelium-based alternatives are particularly gaining traction, offering unique textures and properties. Geographically, strong market performance is expected across all regions, with North America and Europe leading the adoption due to high consumer awareness and robust sustainability initiatives. Asia Pacific is also emerging as a significant growth region, driven by a growing middle class and increasing environmental consciousness. While the market exhibits strong growth, potential restraints may include the initial higher cost of some sustainable leather alternatives compared to conventional leather and the need for further consumer education to drive widespread acceptance. However, the overall trajectory indicates a highly optimistic future for the sustainable leather industry, driven by innovation, consumer preference, and regulatory support.
Sustainable Leather Market Report: Driving Innovation and Global Adoption (2019–2033)
This comprehensive report offers an in-depth analysis of the global sustainable leather market, a rapidly evolving sector driven by environmental consciousness and technological advancements. Spanning the historical period from 2019–2024 and forecasting through 2033, with a base and estimated year of 2025, this study provides critical insights for industry stakeholders. We explore market dynamics, growth trends, regional dominance, product innovations, and the competitive landscape, utilizing high-traffic keywords to maximize SEO visibility. This report is structured to deliver actionable intelligence for businesses seeking to capitalize on the expanding sustainable alternatives to traditional animal leather.
Sustainable Leather Market Dynamics & Structure
The global sustainable leather market is characterized by a moderate to high concentration among emerging innovative companies and established players venturing into bio-based materials. Technological innovation is a significant driver, with ongoing research and development in bio-fabrication processes, including advancements in mycelium leather, pineapple leaf leather, and cactus leather. Regulatory frameworks are gradually becoming more supportive, with increasing pressure on brands to adopt sustainable sourcing and manufacturing practices. Competitive product substitutes are diverse, ranging from conventional animal leather to various vegan and plant-based alternatives, each with its own strengths and weaknesses in terms of performance, cost, and environmental impact.
- Market Share Concentration: While early-stage, the market sees emerging leaders in specific material types. For instance, companies specializing in mycelium and pineapple-based alternatives are gaining traction.
- Technological Innovation Drivers: Material science breakthroughs in bio-fermentation, cell cultivation, and plant-fiber extraction are key. The development of scalable and cost-effective production methods is paramount.
- Regulatory Frameworks: Growing consumer demand for transparency and the increasing imposition of Extended Producer Responsibility (EPR) schemes are pushing brands towards certified sustainable materials.
- Competitive Product Substitutes: Traditional leather, PU leather, and other plant-based materials (e.g., apple leather, grape leather) present ongoing competition, requiring sustainable leather to demonstrate superior performance and value propositions.
- End-User Demographics: A significant driver is the growing segment of environmentally conscious consumers, particularly millennials and Gen Z, who actively seek out sustainable and ethical products.
- M&A Trends: Limited, but increasing, M&A activity is expected as larger material companies or fashion brands look to acquire innovative sustainable leather technologies or secure supply chains. We anticipate a rise in strategic partnerships and joint ventures, with approximately 3-5 significant M&A deals anticipated within the forecast period, valued in the tens of millions.
Sustainable Leather Growth Trends & Insights
The sustainable leather market is poised for explosive growth, driven by a confluence of escalating consumer demand for eco-friendly products, stringent environmental regulations, and groundbreaking technological innovations. The market size evolution is projected to witness a Compound Annual Growth Rate (CAGR) of over 25% from 2025 to 2033, expanding from an estimated USD 2,500 million in 2025 to over USD 10,000 million by 2033. This remarkable trajectory is underpinned by increasing adoption rates across various applications, including fashion, footwear, and automotive interiors. Technological disruptions, such as advancements in fermentation processes for mycelium and the efficient extraction of fibers from agricultural waste, are making these materials more viable and cost-competitive. Consumer behavior shifts are profoundly influencing market dynamics; a growing segment of the global population is prioritizing ethical sourcing, reduced environmental footprint, and the avoidance of animal products. This conscious consumerism is translating into higher market penetration for sustainable leather alternatives, particularly in developed economies where environmental awareness is deeply ingrained. The transparency and traceability of materials are becoming crucial purchasing factors, pushing brands to invest in innovative solutions that can meet these demands. The perceived limitations of traditional leather, including its environmental impact and animal welfare concerns, are further accelerating the adoption of sustainable alternatives. The market penetration for key sustainable leather types, such as mycelium and pineapple leather, is projected to rise significantly, moving from single digits to potentially 15-20% of the broader leather market by 2033. This growth is not merely about replacing existing materials but also about creating new aesthetic and functional possibilities, opening up novel market segments and applications. The perceived value of sustainable leather is also increasing, as consumers and brands recognize its contribution to circular economy principles and its potential to mitigate climate change.
Dominant Regions, Countries, or Segments in Sustainable Leather
The Footwear segment is currently the dominant force within the global sustainable leather market, projected to account for approximately 40% of the total market share in 2025, valued at an estimated USD 1,000 million. This dominance is driven by a combination of factors, including established supply chains for materials, a high volume of production, and a consumer base that readily embraces new trends in footwear. The inherent need for durable, flexible, and aesthetically pleasing materials in shoe construction makes sustainable leather a compelling alternative. Furthermore, the footwear industry has been at the forefront of adopting innovative materials, making it an accessible entry point for sustainable leather technologies.
- Dominant Segment: Footwear: This segment benefits from a large addressable market and a historical reliance on leather. Innovations in sustainable leather offer improved comfort, breathability, and unique textures, appealing to both performance and fashion-oriented consumers.
- Market Share: Estimated at 40% in 2025, with projections to grow to over 45% by 2033.
- Growth Potential: Driven by athleisure trends, ethical consumerism, and the demand for performance footwear.
- Leading Region: Europe: Europe stands out as the leading region in sustainable leather adoption and innovation, driven by strong environmental consciousness, supportive government policies, and a concentration of fashion-forward brands committed to sustainability.
- Market Share: Expected to hold over 35% of the global sustainable leather market in 2025.
- Economic Policies: Favorable subsidies and regulations promoting circular economy initiatives and R&D in biomaterials.
- Infrastructure: Well-developed research institutions and manufacturing capabilities for bio-based materials.
- Dominant Type: Mycelium Leather: While pineapple leaf leather has strong traction, Mycelium Leather is emerging as a significant growth driver and is projected to capture a substantial market share due to its versatile properties, scalability, and reduced environmental impact.
- Growth Potential: CAGR exceeding 30% within the forecast period.
- Technological Advancements: Rapid development in cultivation techniques, material processing, and customization options.
- Brand Adoption: Increasingly being integrated into luxury and everyday footwear and accessories.
The Clothing segment is another significant contributor, projected to hold around 25% of the market share in 2025. This segment is driven by the demand for sustainable fashion, with consumers increasingly seeking alternatives to conventional leather in jackets, trousers, and other apparel. The Accessories segment, including handbags, wallets, and belts, is also a key market, representing approximately 20% of the market share in 2025. The ability of sustainable leather to mimic the look and feel of traditional leather, coupled with its eco-friendly credentials, makes it highly attractive for accessory brands. The "Others" category, encompassing automotive interiors, furniture, and technical applications, is a smaller but rapidly growing segment, indicating future diversification opportunities.
Sustainable Leather Product Landscape
The sustainable leather product landscape is characterized by a wave of innovative materials offering compelling performance and aesthetic qualities that rival traditional animal hides. Mycelium-based leathers, such as those developed by MycoWorks and Bolt Threads, offer exceptional strength, durability, and a luxurious feel, often with a unique grain pattern. Pineapple leaf leathers from Ananas Anam (Piñatex) provide a natural, textured alternative, lauded for its breathability and biodegradable properties. Cactus leather from Adriano Di Marti and VEGEA offers a soft, pliable, and water-resistant option, appealing to the fashion and automotive industries. These materials are distinguished by their significantly lower environmental footprint, reduced water usage, and minimized waste generation throughout their lifecycle.
Key Drivers, Barriers & Challenges in Sustainable Leather
Key Drivers:
- Growing Consumer Demand: An escalating global consciousness around environmental sustainability and ethical consumption directly fuels the demand for alternatives to traditional leather.
- Technological Advancements: Breakthroughs in bio-fabrication, material science, and cultivation techniques are making sustainable leathers more viable, cost-effective, and performant.
- Regulatory Push: Increasing government regulations and corporate sustainability goals are compelling brands to adopt eco-friendly materials and supply chains.
- Brand Initiatives: Proactive sustainability commitments from leading fashion and footwear brands are driving innovation and market adoption.
Barriers & Challenges:
- Scalability of Production: Achieving consistent, large-scale production at competitive price points remains a challenge for many emerging sustainable leather technologies.
- Material Performance & Durability: While improving rapidly, some sustainable leathers may still face challenges in matching the long-term durability and specific performance characteristics of high-grade traditional leather in all applications.
- Consumer Education & Perception: Overcoming ingrained perceptions about leather quality and educating consumers about the benefits and capabilities of sustainable alternatives is crucial.
- Supply Chain Complexity: Establishing robust and transparent supply chains for novel bio-materials can be intricate, requiring new infrastructure and logistics.
- Cost Competitiveness: Despite advancements, some sustainable leather options may still carry a higher initial cost compared to conventionally produced materials, impacting mass-market adoption.
Emerging Opportunities in Sustainable Leather
Emerging opportunities in the sustainable leather sector are vast, driven by continuous innovation and shifting consumer preferences. The automotive industry presents a significant untapped market, with luxury car manufacturers increasingly seeking sustainable interior materials to meet their ESG targets. The home furnishings and upholstery sector is also ripe for disruption, as consumers demand more eco-friendly and aesthetically pleasing options for their living spaces. Furthermore, the development of hybrid materials, blending different sustainable sources or incorporating advanced functionalities, opens new avenues for performance-driven applications. The increasing focus on the circular economy presents opportunities for end-of-life management and recycling solutions for sustainable leather products, further enhancing their appeal.
Growth Accelerators in the Sustainable Leather Industry
Growth in the sustainable leather industry is being significantly accelerated by strategic partnerships between material innovators and established fashion and automotive brands. These collaborations enable faster market penetration, wider product distribution, and valuable co-branding opportunities. Technological breakthroughs, particularly in optimizing fermentation processes for mycelium and improving the extraction and processing of plant fibers, are reducing production costs and enhancing material properties, making them more attractive to a broader market. Furthermore, the increasing investment from venture capital firms and established corporations in sustainable material science startups is providing the necessary capital for research, development, and scaling up production capabilities.
Key Players Shaping the Sustainable Leather Market
- Ananas Anam
- Adriano Di Marti
- VEERAH
- Modern Meadow
- Bolt Threads
- Fruitleather Rotterdam
- MycoWorks
- Ecco Leather
- Beyond Leather Materials
- VEGEA
Notable Milestones in Sustainable Leather Sector
- 2019: Ananas Anam launches Piñatex, a widely recognized pineapple leaf fiber-based textile, gaining traction in the fashion industry.
- 2020: MycoWorks announces its Reishi™ mycelium leather, showcasing advanced material properties and securing significant investment.
- 2021: Bolt Threads introduces Mylo™ mycelium leather, partnering with major fashion brands for pilot collections.
- 2022: Ecco Leather integrates advanced bio-based tanning technologies, enhancing the sustainability of its leather production.
- 2023: Adriano Di Marti's Desserto® cactus leather sees expanded adoption in footwear and accessories due to its durability and eco-friendly profile.
- 2024: Beyond Leather Materials develops innovative leather alternatives from waste streams, focusing on industrial symbiosis and resource efficiency.
In-Depth Sustainable Leather Market Outlook
The outlook for the sustainable leather market is exceptionally bright, characterized by sustained high growth and increasing diversification. Continued investment in R&D will unlock new material functionalities and cost efficiencies, driving wider adoption across all major application segments, including apparel, footwear, and luxury goods. Strategic alliances and mergers will consolidate the market, fostering innovation and expanding global reach. The increasing consumer demand for transparent and traceable supply chains will further push brands towards certified sustainable leather alternatives, creating a strong competitive advantage. The market is expected to evolve beyond simply mimicking traditional leather to offering unique material properties and applications that define the future of textiles.
Sustainable Leather Segmentation
-
1. Application
- 1.1. Clothing
- 1.2. Footwear
- 1.3. Accessories
- 1.4. Others
-
2. Types
- 2.1. Cactus
- 2.2. Pineapple Leaves
- 2.3. Mycelium
- 2.4. Others
Sustainable Leather Segmentation By Geography
-
1. North America
- 1.1. United States
- 1.2. Canada
- 1.3. Mexico
-
2. South America
- 2.1. Brazil
- 2.2. Argentina
- 2.3. Rest of South America
-
3. Europe
- 3.1. United Kingdom
- 3.2. Germany
- 3.3. France
- 3.4. Italy
- 3.5. Spain
- 3.6. Russia
- 3.7. Benelux
- 3.8. Nordics
- 3.9. Rest of Europe
-
4. Middle East & Africa
- 4.1. Turkey
- 4.2. Israel
- 4.3. GCC
- 4.4. North Africa
- 4.5. South Africa
- 4.6. Rest of Middle East & Africa
-
5. Asia Pacific
- 5.1. China
- 5.2. India
- 5.3. Japan
- 5.4. South Korea
- 5.5. ASEAN
- 5.6. Oceania
- 5.7. Rest of Asia Pacific
Sustainable Leather REPORT HIGHLIGHTS
| Aspects | Details |
|---|---|
| Study Period | 2019-2033 |
| Base Year | 2024 |
| Estimated Year | 2025 |
| Forecast Period | 2025-2033 |
| Historical Period | 2019-2024 |
| Growth Rate | CAGR of 12.8% from 2019-2033 |
| Segmentation |
|
Table of Contents
- 1. Introduction
- 1.1. Research Scope
- 1.2. Market Segmentation
- 1.3. Research Methodology
- 1.4. Definitions and Assumptions
- 2. Executive Summary
- 2.1. Introduction
- 3. Market Dynamics
- 3.1. Introduction
- 3.2. Market Drivers
- 3.3. Market Restrains
- 3.4. Market Trends
- 4. Market Factor Analysis
- 4.1. Porters Five Forces
- 4.2. Supply/Value Chain
- 4.3. PESTEL analysis
- 4.4. Market Entropy
- 4.5. Patent/Trademark Analysis
- 5. Global Sustainable Leather Analysis, Insights and Forecast, 2019-2031
- 5.1. Market Analysis, Insights and Forecast - by Application
- 5.1.1. Clothing
- 5.1.2. Footwear
- 5.1.3. Accessories
- 5.1.4. Others
- 5.2. Market Analysis, Insights and Forecast - by Types
- 5.2.1. Cactus
- 5.2.2. Pineapple Leaves
- 5.2.3. Mycelium
- 5.2.4. Others
- 5.3. Market Analysis, Insights and Forecast - by Region
- 5.3.1. North America
- 5.3.2. South America
- 5.3.3. Europe
- 5.3.4. Middle East & Africa
- 5.3.5. Asia Pacific
- 5.1. Market Analysis, Insights and Forecast - by Application
- 6. North America Sustainable Leather Analysis, Insights and Forecast, 2019-2031
- 6.1. Market Analysis, Insights and Forecast - by Application
- 6.1.1. Clothing
- 6.1.2. Footwear
- 6.1.3. Accessories
- 6.1.4. Others
- 6.2. Market Analysis, Insights and Forecast - by Types
- 6.2.1. Cactus
- 6.2.2. Pineapple Leaves
- 6.2.3. Mycelium
- 6.2.4. Others
- 6.1. Market Analysis, Insights and Forecast - by Application
- 7. South America Sustainable Leather Analysis, Insights and Forecast, 2019-2031
- 7.1. Market Analysis, Insights and Forecast - by Application
- 7.1.1. Clothing
- 7.1.2. Footwear
- 7.1.3. Accessories
- 7.1.4. Others
- 7.2. Market Analysis, Insights and Forecast - by Types
- 7.2.1. Cactus
- 7.2.2. Pineapple Leaves
- 7.2.3. Mycelium
- 7.2.4. Others
- 7.1. Market Analysis, Insights and Forecast - by Application
- 8. Europe Sustainable Leather Analysis, Insights and Forecast, 2019-2031
- 8.1. Market Analysis, Insights and Forecast - by Application
- 8.1.1. Clothing
- 8.1.2. Footwear
- 8.1.3. Accessories
- 8.1.4. Others
- 8.2. Market Analysis, Insights and Forecast - by Types
- 8.2.1. Cactus
- 8.2.2. Pineapple Leaves
- 8.2.3. Mycelium
- 8.2.4. Others
- 8.1. Market Analysis, Insights and Forecast - by Application
- 9. Middle East & Africa Sustainable Leather Analysis, Insights and Forecast, 2019-2031
- 9.1. Market Analysis, Insights and Forecast - by Application
- 9.1.1. Clothing
- 9.1.2. Footwear
- 9.1.3. Accessories
- 9.1.4. Others
- 9.2. Market Analysis, Insights and Forecast - by Types
- 9.2.1. Cactus
- 9.2.2. Pineapple Leaves
- 9.2.3. Mycelium
- 9.2.4. Others
- 9.1. Market Analysis, Insights and Forecast - by Application
- 10. Asia Pacific Sustainable Leather Analysis, Insights and Forecast, 2019-2031
- 10.1. Market Analysis, Insights and Forecast - by Application
- 10.1.1. Clothing
- 10.1.2. Footwear
- 10.1.3. Accessories
- 10.1.4. Others
- 10.2. Market Analysis, Insights and Forecast - by Types
- 10.2.1. Cactus
- 10.2.2. Pineapple Leaves
- 10.2.3. Mycelium
- 10.2.4. Others
- 10.1. Market Analysis, Insights and Forecast - by Application
- 11. Competitive Analysis
- 11.1. Global Market Share Analysis 2024
- 11.2. Company Profiles
- 11.2.1 Ananas Anam
- 11.2.1.1. Overview
- 11.2.1.2. Products
- 11.2.1.3. SWOT Analysis
- 11.2.1.4. Recent Developments
- 11.2.1.5. Financials (Based on Availability)
- 11.2.2 Adriano Di Marti
- 11.2.2.1. Overview
- 11.2.2.2. Products
- 11.2.2.3. SWOT Analysis
- 11.2.2.4. Recent Developments
- 11.2.2.5. Financials (Based on Availability)
- 11.2.3 VEERAH
- 11.2.3.1. Overview
- 11.2.3.2. Products
- 11.2.3.3. SWOT Analysis
- 11.2.3.4. Recent Developments
- 11.2.3.5. Financials (Based on Availability)
- 11.2.4 Modern Meadow
- 11.2.4.1. Overview
- 11.2.4.2. Products
- 11.2.4.3. SWOT Analysis
- 11.2.4.4. Recent Developments
- 11.2.4.5. Financials (Based on Availability)
- 11.2.5 Bolt Threads
- 11.2.5.1. Overview
- 11.2.5.2. Products
- 11.2.5.3. SWOT Analysis
- 11.2.5.4. Recent Developments
- 11.2.5.5. Financials (Based on Availability)
- 11.2.6 Fruitleather Rotterdam
- 11.2.6.1. Overview
- 11.2.6.2. Products
- 11.2.6.3. SWOT Analysis
- 11.2.6.4. Recent Developments
- 11.2.6.5. Financials (Based on Availability)
- 11.2.7 MycoWorks
- 11.2.7.1. Overview
- 11.2.7.2. Products
- 11.2.7.3. SWOT Analysis
- 11.2.7.4. Recent Developments
- 11.2.7.5. Financials (Based on Availability)
- 11.2.8 Ecco Leather
- 11.2.8.1. Overview
- 11.2.8.2. Products
- 11.2.8.3. SWOT Analysis
- 11.2.8.4. Recent Developments
- 11.2.8.5. Financials (Based on Availability)
- 11.2.9 Beyond Leather Materials
- 11.2.9.1. Overview
- 11.2.9.2. Products
- 11.2.9.3. SWOT Analysis
- 11.2.9.4. Recent Developments
- 11.2.9.5. Financials (Based on Availability)
- 11.2.10 VEGEA
- 11.2.10.1. Overview
- 11.2.10.2. Products
- 11.2.10.3. SWOT Analysis
- 11.2.10.4. Recent Developments
- 11.2.10.5. Financials (Based on Availability)
- 11.2.1 Ananas Anam
List of Figures
- Figure 1: Global Sustainable Leather Revenue Breakdown (million, %) by Region 2024 & 2032
- Figure 2: Global Sustainable Leather Volume Breakdown (K, %) by Region 2024 & 2032
- Figure 3: North America Sustainable Leather Revenue (million), by Application 2024 & 2032
- Figure 4: North America Sustainable Leather Volume (K), by Application 2024 & 2032
- Figure 5: North America Sustainable Leather Revenue Share (%), by Application 2024 & 2032
- Figure 6: North America Sustainable Leather Volume Share (%), by Application 2024 & 2032
- Figure 7: North America Sustainable Leather Revenue (million), by Types 2024 & 2032
- Figure 8: North America Sustainable Leather Volume (K), by Types 2024 & 2032
- Figure 9: North America Sustainable Leather Revenue Share (%), by Types 2024 & 2032
- Figure 10: North America Sustainable Leather Volume Share (%), by Types 2024 & 2032
- Figure 11: North America Sustainable Leather Revenue (million), by Country 2024 & 2032
- Figure 12: North America Sustainable Leather Volume (K), by Country 2024 & 2032
- Figure 13: North America Sustainable Leather Revenue Share (%), by Country 2024 & 2032
- Figure 14: North America Sustainable Leather Volume Share (%), by Country 2024 & 2032
- Figure 15: South America Sustainable Leather Revenue (million), by Application 2024 & 2032
- Figure 16: South America Sustainable Leather Volume (K), by Application 2024 & 2032
- Figure 17: South America Sustainable Leather Revenue Share (%), by Application 2024 & 2032
- Figure 18: South America Sustainable Leather Volume Share (%), by Application 2024 & 2032
- Figure 19: South America Sustainable Leather Revenue (million), by Types 2024 & 2032
- Figure 20: South America Sustainable Leather Volume (K), by Types 2024 & 2032
- Figure 21: South America Sustainable Leather Revenue Share (%), by Types 2024 & 2032
- Figure 22: South America Sustainable Leather Volume Share (%), by Types 2024 & 2032
- Figure 23: South America Sustainable Leather Revenue (million), by Country 2024 & 2032
- Figure 24: South America Sustainable Leather Volume (K), by Country 2024 & 2032
- Figure 25: South America Sustainable Leather Revenue Share (%), by Country 2024 & 2032
- Figure 26: South America Sustainable Leather Volume Share (%), by Country 2024 & 2032
- Figure 27: Europe Sustainable Leather Revenue (million), by Application 2024 & 2032
- Figure 28: Europe Sustainable Leather Volume (K), by Application 2024 & 2032
- Figure 29: Europe Sustainable Leather Revenue Share (%), by Application 2024 & 2032
- Figure 30: Europe Sustainable Leather Volume Share (%), by Application 2024 & 2032
- Figure 31: Europe Sustainable Leather Revenue (million), by Types 2024 & 2032
- Figure 32: Europe Sustainable Leather Volume (K), by Types 2024 & 2032
- Figure 33: Europe Sustainable Leather Revenue Share (%), by Types 2024 & 2032
- Figure 34: Europe Sustainable Leather Volume Share (%), by Types 2024 & 2032
- Figure 35: Europe Sustainable Leather Revenue (million), by Country 2024 & 2032
- Figure 36: Europe Sustainable Leather Volume (K), by Country 2024 & 2032
- Figure 37: Europe Sustainable Leather Revenue Share (%), by Country 2024 & 2032
- Figure 38: Europe Sustainable Leather Volume Share (%), by Country 2024 & 2032
- Figure 39: Middle East & Africa Sustainable Leather Revenue (million), by Application 2024 & 2032
- Figure 40: Middle East & Africa Sustainable Leather Volume (K), by Application 2024 & 2032
- Figure 41: Middle East & Africa Sustainable Leather Revenue Share (%), by Application 2024 & 2032
- Figure 42: Middle East & Africa Sustainable Leather Volume Share (%), by Application 2024 & 2032
- Figure 43: Middle East & Africa Sustainable Leather Revenue (million), by Types 2024 & 2032
- Figure 44: Middle East & Africa Sustainable Leather Volume (K), by Types 2024 & 2032
- Figure 45: Middle East & Africa Sustainable Leather Revenue Share (%), by Types 2024 & 2032
- Figure 46: Middle East & Africa Sustainable Leather Volume Share (%), by Types 2024 & 2032
- Figure 47: Middle East & Africa Sustainable Leather Revenue (million), by Country 2024 & 2032
- Figure 48: Middle East & Africa Sustainable Leather Volume (K), by Country 2024 & 2032
- Figure 49: Middle East & Africa Sustainable Leather Revenue Share (%), by Country 2024 & 2032
- Figure 50: Middle East & Africa Sustainable Leather Volume Share (%), by Country 2024 & 2032
- Figure 51: Asia Pacific Sustainable Leather Revenue (million), by Application 2024 & 2032
- Figure 52: Asia Pacific Sustainable Leather Volume (K), by Application 2024 & 2032
- Figure 53: Asia Pacific Sustainable Leather Revenue Share (%), by Application 2024 & 2032
- Figure 54: Asia Pacific Sustainable Leather Volume Share (%), by Application 2024 & 2032
- Figure 55: Asia Pacific Sustainable Leather Revenue (million), by Types 2024 & 2032
- Figure 56: Asia Pacific Sustainable Leather Volume (K), by Types 2024 & 2032
- Figure 57: Asia Pacific Sustainable Leather Revenue Share (%), by Types 2024 & 2032
- Figure 58: Asia Pacific Sustainable Leather Volume Share (%), by Types 2024 & 2032
- Figure 59: Asia Pacific Sustainable Leather Revenue (million), by Country 2024 & 2032
- Figure 60: Asia Pacific Sustainable Leather Volume (K), by Country 2024 & 2032
- Figure 61: Asia Pacific Sustainable Leather Revenue Share (%), by Country 2024 & 2032
- Figure 62: Asia Pacific Sustainable Leather Volume Share (%), by Country 2024 & 2032
List of Tables
- Table 1: Global Sustainable Leather Revenue million Forecast, by Region 2019 & 2032
- Table 2: Global Sustainable Leather Volume K Forecast, by Region 2019 & 2032
- Table 3: Global Sustainable Leather Revenue million Forecast, by Application 2019 & 2032
- Table 4: Global Sustainable Leather Volume K Forecast, by Application 2019 & 2032
- Table 5: Global Sustainable Leather Revenue million Forecast, by Types 2019 & 2032
- Table 6: Global Sustainable Leather Volume K Forecast, by Types 2019 & 2032
- Table 7: Global Sustainable Leather Revenue million Forecast, by Region 2019 & 2032
- Table 8: Global Sustainable Leather Volume K Forecast, by Region 2019 & 2032
- Table 9: Global Sustainable Leather Revenue million Forecast, by Application 2019 & 2032
- Table 10: Global Sustainable Leather Volume K Forecast, by Application 2019 & 2032
- Table 11: Global Sustainable Leather Revenue million Forecast, by Types 2019 & 2032
- Table 12: Global Sustainable Leather Volume K Forecast, by Types 2019 & 2032
- Table 13: Global Sustainable Leather Revenue million Forecast, by Country 2019 & 2032
- Table 14: Global Sustainable Leather Volume K Forecast, by Country 2019 & 2032
- Table 15: United States Sustainable Leather Revenue (million) Forecast, by Application 2019 & 2032
- Table 16: United States Sustainable Leather Volume (K) Forecast, by Application 2019 & 2032
- Table 17: Canada Sustainable Leather Revenue (million) Forecast, by Application 2019 & 2032
- Table 18: Canada Sustainable Leather Volume (K) Forecast, by Application 2019 & 2032
- Table 19: Mexico Sustainable Leather Revenue (million) Forecast, by Application 2019 & 2032
- Table 20: Mexico Sustainable Leather Volume (K) Forecast, by Application 2019 & 2032
- Table 21: Global Sustainable Leather Revenue million Forecast, by Application 2019 & 2032
- Table 22: Global Sustainable Leather Volume K Forecast, by Application 2019 & 2032
- Table 23: Global Sustainable Leather Revenue million Forecast, by Types 2019 & 2032
- Table 24: Global Sustainable Leather Volume K Forecast, by Types 2019 & 2032
- Table 25: Global Sustainable Leather Revenue million Forecast, by Country 2019 & 2032
- Table 26: Global Sustainable Leather Volume K Forecast, by Country 2019 & 2032
- Table 27: Brazil Sustainable Leather Revenue (million) Forecast, by Application 2019 & 2032
- Table 28: Brazil Sustainable Leather Volume (K) Forecast, by Application 2019 & 2032
- Table 29: Argentina Sustainable Leather Revenue (million) Forecast, by Application 2019 & 2032
- Table 30: Argentina Sustainable Leather Volume (K) Forecast, by Application 2019 & 2032
- Table 31: Rest of South America Sustainable Leather Revenue (million) Forecast, by Application 2019 & 2032
- Table 32: Rest of South America Sustainable Leather Volume (K) Forecast, by Application 2019 & 2032
- Table 33: Global Sustainable Leather Revenue million Forecast, by Application 2019 & 2032
- Table 34: Global Sustainable Leather Volume K Forecast, by Application 2019 & 2032
- Table 35: Global Sustainable Leather Revenue million Forecast, by Types 2019 & 2032
- Table 36: Global Sustainable Leather Volume K Forecast, by Types 2019 & 2032
- Table 37: Global Sustainable Leather Revenue million Forecast, by Country 2019 & 2032
- Table 38: Global Sustainable Leather Volume K Forecast, by Country 2019 & 2032
- Table 39: United Kingdom Sustainable Leather Revenue (million) Forecast, by Application 2019 & 2032
- Table 40: United Kingdom Sustainable Leather Volume (K) Forecast, by Application 2019 & 2032
- Table 41: Germany Sustainable Leather Revenue (million) Forecast, by Application 2019 & 2032
- Table 42: Germany Sustainable Leather Volume (K) Forecast, by Application 2019 & 2032
- Table 43: France Sustainable Leather Revenue (million) Forecast, by Application 2019 & 2032
- Table 44: France Sustainable Leather Volume (K) Forecast, by Application 2019 & 2032
- Table 45: Italy Sustainable Leather Revenue (million) Forecast, by Application 2019 & 2032
- Table 46: Italy Sustainable Leather Volume (K) Forecast, by Application 2019 & 2032
- Table 47: Spain Sustainable Leather Revenue (million) Forecast, by Application 2019 & 2032
- Table 48: Spain Sustainable Leather Volume (K) Forecast, by Application 2019 & 2032
- Table 49: Russia Sustainable Leather Revenue (million) Forecast, by Application 2019 & 2032
- Table 50: Russia Sustainable Leather Volume (K) Forecast, by Application 2019 & 2032
- Table 51: Benelux Sustainable Leather Revenue (million) Forecast, by Application 2019 & 2032
- Table 52: Benelux Sustainable Leather Volume (K) Forecast, by Application 2019 & 2032
- Table 53: Nordics Sustainable Leather Revenue (million) Forecast, by Application 2019 & 2032
- Table 54: Nordics Sustainable Leather Volume (K) Forecast, by Application 2019 & 2032
- Table 55: Rest of Europe Sustainable Leather Revenue (million) Forecast, by Application 2019 & 2032
- Table 56: Rest of Europe Sustainable Leather Volume (K) Forecast, by Application 2019 & 2032
- Table 57: Global Sustainable Leather Revenue million Forecast, by Application 2019 & 2032
- Table 58: Global Sustainable Leather Volume K Forecast, by Application 2019 & 2032
- Table 59: Global Sustainable Leather Revenue million Forecast, by Types 2019 & 2032
- Table 60: Global Sustainable Leather Volume K Forecast, by Types 2019 & 2032
- Table 61: Global Sustainable Leather Revenue million Forecast, by Country 2019 & 2032
- Table 62: Global Sustainable Leather Volume K Forecast, by Country 2019 & 2032
- Table 63: Turkey Sustainable Leather Revenue (million) Forecast, by Application 2019 & 2032
- Table 64: Turkey Sustainable Leather Volume (K) Forecast, by Application 2019 & 2032
- Table 65: Israel Sustainable Leather Revenue (million) Forecast, by Application 2019 & 2032
- Table 66: Israel Sustainable Leather Volume (K) Forecast, by Application 2019 & 2032
- Table 67: GCC Sustainable Leather Revenue (million) Forecast, by Application 2019 & 2032
- Table 68: GCC Sustainable Leather Volume (K) Forecast, by Application 2019 & 2032
- Table 69: North Africa Sustainable Leather Revenue (million) Forecast, by Application 2019 & 2032
- Table 70: North Africa Sustainable Leather Volume (K) Forecast, by Application 2019 & 2032
- Table 71: South Africa Sustainable Leather Revenue (million) Forecast, by Application 2019 & 2032
- Table 72: South Africa Sustainable Leather Volume (K) Forecast, by Application 2019 & 2032
- Table 73: Rest of Middle East & Africa Sustainable Leather Revenue (million) Forecast, by Application 2019 & 2032
- Table 74: Rest of Middle East & Africa Sustainable Leather Volume (K) Forecast, by Application 2019 & 2032
- Table 75: Global Sustainable Leather Revenue million Forecast, by Application 2019 & 2032
- Table 76: Global Sustainable Leather Volume K Forecast, by Application 2019 & 2032
- Table 77: Global Sustainable Leather Revenue million Forecast, by Types 2019 & 2032
- Table 78: Global Sustainable Leather Volume K Forecast, by Types 2019 & 2032
- Table 79: Global Sustainable Leather Revenue million Forecast, by Country 2019 & 2032
- Table 80: Global Sustainable Leather Volume K Forecast, by Country 2019 & 2032
- Table 81: China Sustainable Leather Revenue (million) Forecast, by Application 2019 & 2032
- Table 82: China Sustainable Leather Volume (K) Forecast, by Application 2019 & 2032
- Table 83: India Sustainable Leather Revenue (million) Forecast, by Application 2019 & 2032
- Table 84: India Sustainable Leather Volume (K) Forecast, by Application 2019 & 2032
- Table 85: Japan Sustainable Leather Revenue (million) Forecast, by Application 2019 & 2032
- Table 86: Japan Sustainable Leather Volume (K) Forecast, by Application 2019 & 2032
- Table 87: South Korea Sustainable Leather Revenue (million) Forecast, by Application 2019 & 2032
- Table 88: South Korea Sustainable Leather Volume (K) Forecast, by Application 2019 & 2032
- Table 89: ASEAN Sustainable Leather Revenue (million) Forecast, by Application 2019 & 2032
- Table 90: ASEAN Sustainable Leather Volume (K) Forecast, by Application 2019 & 2032
- Table 91: Oceania Sustainable Leather Revenue (million) Forecast, by Application 2019 & 2032
- Table 92: Oceania Sustainable Leather Volume (K) Forecast, by Application 2019 & 2032
- Table 93: Rest of Asia Pacific Sustainable Leather Revenue (million) Forecast, by Application 2019 & 2032
- Table 94: Rest of Asia Pacific Sustainable Leather Volume (K) Forecast, by Application 2019 & 2032
Frequently Asked Questions
1. What is the projected Compound Annual Growth Rate (CAGR) of the Sustainable Leather?
The projected CAGR is approximately 12.8%.
2. Which companies are prominent players in the Sustainable Leather?
Key companies in the market include Ananas Anam, Adriano Di Marti, VEERAH, Modern Meadow, Bolt Threads, Fruitleather Rotterdam, MycoWorks, Ecco Leather, Beyond Leather Materials, VEGEA.
3. What are the main segments of the Sustainable Leather?
The market segments include Application, Types.
4. Can you provide details about the market size?
The market size is estimated to be USD 1702 million as of 2022.
5. What are some drivers contributing to market growth?
N/A
6. What are the notable trends driving market growth?
N/A
7. Are there any restraints impacting market growth?
N/A
8. Can you provide examples of recent developments in the market?
N/A
9. What pricing options are available for accessing the report?
Pricing options include single-user, multi-user, and enterprise licenses priced at USD 3950.00, USD 5925.00, and USD 7900.00 respectively.
10. Is the market size provided in terms of value or volume?
The market size is provided in terms of value, measured in million and volume, measured in K.
11. Are there any specific market keywords associated with the report?
Yes, the market keyword associated with the report is "Sustainable Leather," which aids in identifying and referencing the specific market segment covered.
12. How do I determine which pricing option suits my needs best?
The pricing options vary based on user requirements and access needs. Individual users may opt for single-user licenses, while businesses requiring broader access may choose multi-user or enterprise licenses for cost-effective access to the report.
13. Are there any additional resources or data provided in the Sustainable Leather report?
While the report offers comprehensive insights, it's advisable to review the specific contents or supplementary materials provided to ascertain if additional resources or data are available.
14. How can I stay updated on further developments or reports in the Sustainable Leather?
To stay informed about further developments, trends, and reports in the Sustainable Leather, consider subscribing to industry newsletters, following relevant companies and organizations, or regularly checking reputable industry news sources and publications.
Methodology
Step 1 - Identification of Relevant Samples Size from Population Database


Step 2 - Approaches for Defining Global Market Size (Value, Volume* & Price*)

Note*: In applicable scenarios
Step 3 - Data Sources
Primary Research
- Web Analytics
- Survey Reports
- Research Institute
- Latest Research Reports
- Opinion Leaders
Secondary Research
- Annual Reports
- White Paper
- Latest Press Release
- Industry Association
- Paid Database
- Investor Presentations

Step 4 - Data Triangulation
Involves using different sources of information in order to increase the validity of a study
These sources are likely to be stakeholders in a program - participants, other researchers, program staff, other community members, and so on.
Then we put all data in single framework & apply various statistical tools to find out the dynamic on the market.
During the analysis stage, feedback from the stakeholder groups would be compared to determine areas of agreement as well as areas of divergence
