

Key Insights
The online lottery market, poised for significant expansion, is projected to achieve a Compound Annual Growth Rate (CAGR) of 9.5%. This dynamic sector, valued at $19.43 billion in the base year of 2025, is experiencing robust growth driven by increasing smartphone penetration and the widespread adoption of online gaming platforms. The convenience and accessibility of online lottery solutions are attracting a broader audience, surpassing traditional retail channels. Strategic alliances between lottery operators and digital gaming providers are crucial for market penetration, especially in regions with less developed conventional lottery systems. However, regulatory complexities and the imperative of responsible gaming present considerable challenges. Stringent licensing frameworks and varying regional approaches to gambling addiction management create a complex environment for market participants. Market segmentation by product type (Lotto, Sports, VLT, Scratch Cards, Others) and end-user device (Desktop, Mobile) offers critical insights into consumer behavior, enabling tailored product development. Key players such as Lottoland, Lotto, and Camelot Group, alongside emerging companies, highlight a competitive landscape ripe for innovation and potential consolidation. Geographical market share distribution across North America, Europe, Asia Pacific, South America, and the Middle East & Africa reflects diverse regulatory maturity and consumer acceptance levels.
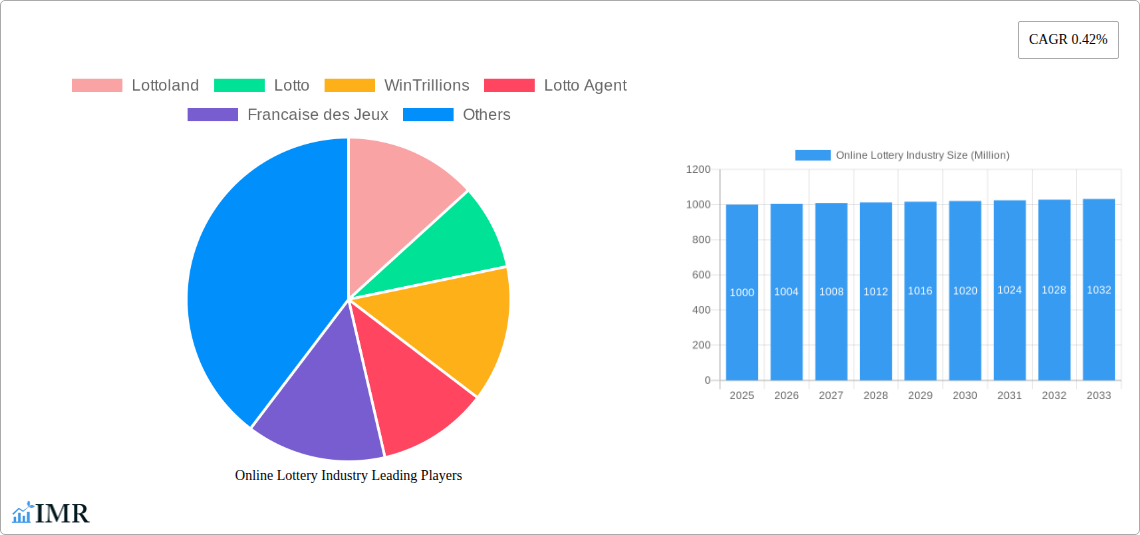
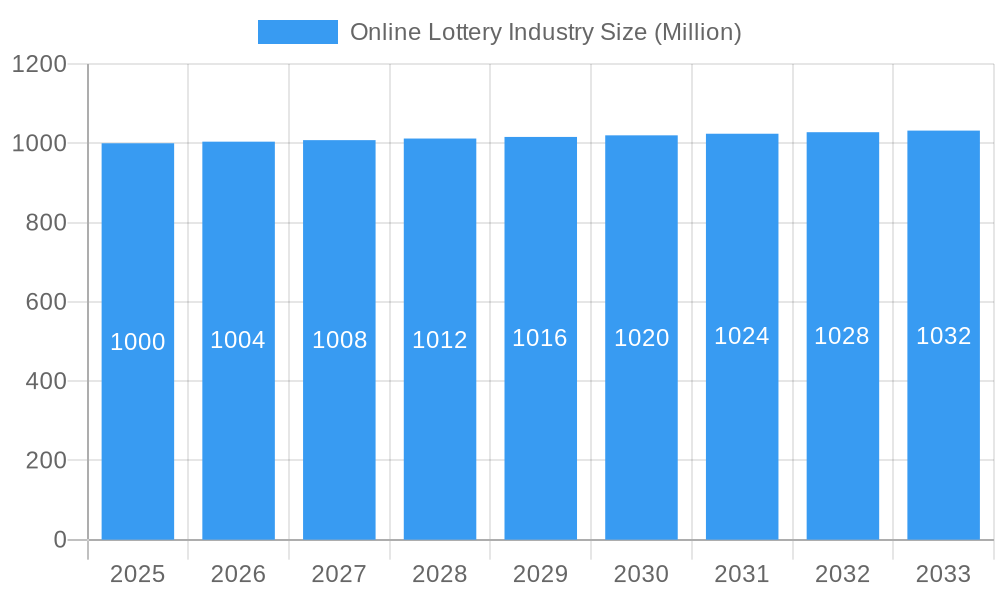
Online Lottery Industry Market Size (In Billion)
Future market expansion is anticipated through targeted marketing initiatives aimed at younger demographics, the introduction of novel game formats, and the integration of cutting-edge technologies like blockchain to bolster security and transparency. Emerging markets with less saturated online gaming sectors offer substantial growth potential. Paramount to the sector's long-term viability are sustained player trust and a steadfast commitment to responsible gambling. Effective regulatory oversight and comprehensive player protection measures are essential for mitigating risks and ensuring a sustainable growth trajectory for the online lottery industry. The competitive environment necessitates continuous innovation and strategic diversification for sustained market leadership.
Online Lottery Industry Company Market Share
Online Lottery Industry Market Report: 2019-2033
This comprehensive report provides a detailed analysis of the online lottery industry, encompassing market dynamics, growth trends, key players, and future outlook. The study period covers 2019-2033, with a base year of 2025 and a forecast period of 2025-2033. The report leverages extensive data analysis to offer actionable insights for industry professionals, investors, and stakeholders. This in-depth analysis covers the parent market of the gambling industry and its child market, the online lottery sector, offering a holistic view of market segmentation (End User: Desktop, Mobile; Product: Lotto, Sports, VLT, Scratch Card, Others) and competitive landscape.
Online Lottery Industry Market Dynamics & Structure
The online lottery market is characterized by moderate concentration, with several major players vying for market share. Technological innovation, primarily in mobile gaming and payment processing, is a key driver, alongside evolving regulatory frameworks that vary significantly across jurisdictions. The market faces competition from other forms of online gambling and entertainment, while mergers and acquisitions (M&A) activity remains a prominent feature of the landscape.
- Market Concentration: Moderate, with top 5 players holding approximately xx% market share in 2024.
- Technological Innovation: Mobile optimization, enhanced user interfaces, and secure payment gateways are driving growth.
- Regulatory Frameworks: Vary widely across regions, impacting market access and operational costs. Stricter regulations in some regions are hindering growth.
- Competitive Substitutes: Online casino games, sports betting, and other forms of online entertainment pose a competitive threat.
- End-User Demographics: Primarily adults aged 25-55, with increasing participation from younger demographics.
- M&A Trends: A moderate number of M&A deals occurred between 2019 and 2024, valued at approximately $xx Million. Consolidation is expected to continue. Innovation barriers include high regulatory hurdles and the need for significant upfront investment in technology and licensing.
Online Lottery Industry Growth Trends & Insights
The online lottery market experienced robust growth during the historical period (2019-2024), fueled by increased internet penetration, smartphone adoption, and evolving consumer preferences. Technological disruptions, such as the integration of blockchain technology and the rise of mobile-first platforms, are reshaping the industry. Shifting consumer behavior, including a preference for convenience and enhanced user experience, continues to drive market expansion. The market is projected to maintain a healthy Compound Annual Growth Rate (CAGR) of xx% during the forecast period (2025-2033), reaching a market size of $xx Million by 2033. Market penetration is expected to increase by xx% by 2033.
Dominant Regions, Countries, or Segments in Online Lottery Industry
North America and Europe currently dominate the online lottery market, driven by established regulatory frameworks, high internet penetration, and strong consumer spending. Within these regions, specific countries such as the UK and the US exhibit particularly high growth rates. The mobile segment is experiencing the fastest growth among end-users, with a growing preference for mobile-optimized platforms and apps. The Lotto product segment remains dominant.
- Key Drivers (North America): High disposable incomes, favorable regulatory environments in certain states.
- Key Drivers (Europe): Strong online gambling culture, established regulatory frameworks in certain countries.
- Mobile Segment: High growth driven by smartphone penetration and convenience.
- Lotto Segment: Remains the largest product segment, driven by established popularity and familiarity.
- Market Share: North America holds approximately xx% of the global market share, while Europe holds approximately xx%.
Online Lottery Industry Product Landscape
The online lottery industry offers a range of products, including traditional lottery games (Lotto), sports betting, video lottery terminals (VLTs), and scratch cards, catering to diverse consumer preferences. Recent innovations include the integration of virtual reality (VR) and augmented reality (AR) technologies for enhanced user experience, and the incorporation of social features to foster community engagement. Unique selling propositions include convenience, accessibility, and diverse game offerings.
Key Drivers, Barriers & Challenges in Online Lottery Industry
Key Drivers:
- Increasing internet and smartphone penetration.
- Growing preference for online convenience.
- Technological advancements enhancing user experience.
- Favorable regulatory environments in certain jurisdictions.
Key Challenges:
- Strict regulatory environments in many jurisdictions, resulting in high operational costs and market entry barriers.
- Competition from other forms of online gambling.
- Concerns regarding responsible gaming and addiction.
- Potential for fraud and security breaches.
Emerging Opportunities in Online Lottery Industry
- Expansion into untapped markets in emerging economies.
- Development of innovative game formats and features.
- Integration of blockchain technology for enhanced security and transparency.
- Personalized marketing and targeted promotions to enhance customer engagement.
Growth Accelerators in the Online Lottery Industry
Technological breakthroughs, particularly in mobile gaming and AI-powered personalization, will be major growth catalysts. Strategic partnerships, particularly with payment processors and technology providers, will also play a significant role. Market expansion into new jurisdictions with favorable regulatory environments will further fuel growth.
Key Players Shaping the Online Lottery Industry Market
- Lottoland
- Lotto (Note: This link may lead to various regional Lotto sites.)
- WinTrillions
- Lotto Agent
- Francaise des Jeux
- Camelot Group
- LottoKings
- ZEAL Network SE
- Lotto Direct Limited
- Annexio Limited
Notable Milestones in Online Lottery Industry Sector
- December 2021: Crypto Millions Lotto launched four new lottery games (India Fantasy 5, India Million Lotto, Powerball+, Mega Millions+).
- February 2022: Zeal Network SE partnered with Lotto Hessian to offer 15 online instant win games.
- October 2022: Zeal Network SE expanded internationally, collaborating with Park Avenue Gaming in Argentina and Peru.
In-Depth Online Lottery Industry Market Outlook
The online lottery market is poised for sustained growth driven by technological advancements, increasing smartphone penetration, and a growing preference for online entertainment. Strategic partnerships and expansion into new markets will further accelerate market expansion, offering significant opportunities for established players and new entrants alike. The market's future potential is substantial, particularly in regions with nascent online gambling sectors and favorable regulatory environments.
Online Lottery Industry Segmentation
-
1. End User
- 1.1. Desktop
- 1.2. Mobile
Online Lottery Industry Segmentation By Geography
-
1. North America
- 1.1. United States
- 1.2. Canada
- 1.3. Mexico
- 1.4. Rest of North America
-
2. Europe
- 2.1. Spain
- 2.2. United Kingdom
- 2.3. Germany
- 2.4. France
- 2.5. Italy
- 2.6. Sweden
- 2.7. Rest of Europe
-
3. Asia Pacific
- 3.1. China
- 3.2. India
- 3.3. Japan
- 3.4. Australia
- 3.5. Rest of Asia Pacific
-
4. South America
- 4.1. Brazil
- 4.2. Argentina
- 4.3. Rest of South America
-
5. Middle East and Africa
- 5.1. South Africa
- 5.2. United Arab Emirates
- 5.3. Rest of Middle East and Africa
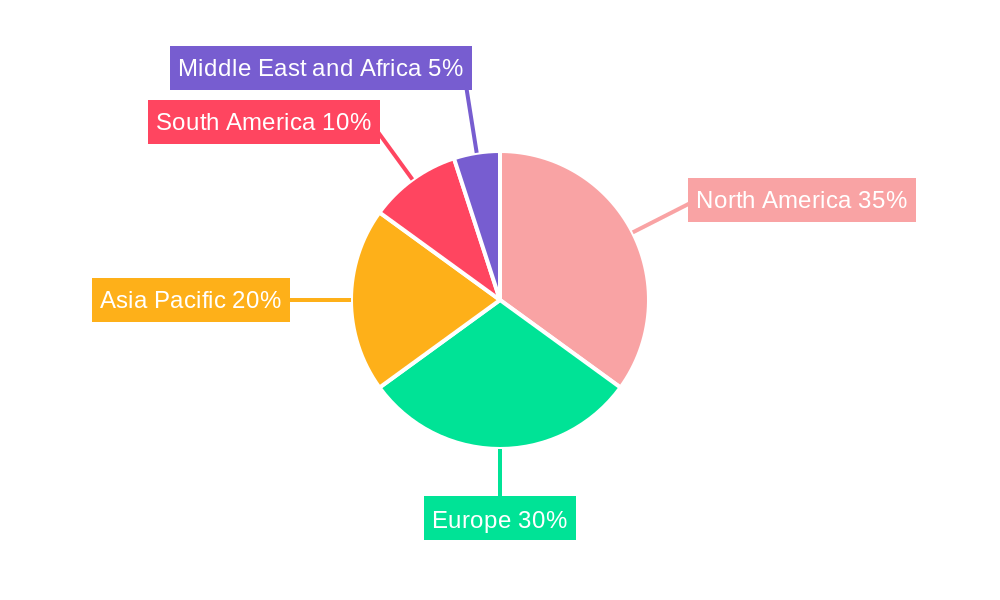
Online Lottery Industry Regional Market Share
Geographic Coverage of Online Lottery Industry
Online Lottery Industry REPORT HIGHLIGHTS
| Aspects | Details |
|---|---|
| Study Period | 2020-2034 |
| Base Year | 2025 |
| Estimated Year | 2026 |
| Forecast Period | 2026-2034 |
| Historical Period | 2020-2025 |
| Growth Rate | CAGR of 9.5% from 2020-2034 |
| Segmentation |
|
Table of Contents
- 1. Introduction
- 1.1. Research Scope
- 1.2. Market Segmentation
- 1.3. Research Objective
- 1.4. Definitions and Assumptions
- 2. Executive Summary
- 2.1. Market Snapshot
- 3. Market Dynamics
- 3.1. Market Drivers
- 3.2. Market Restrains
- 3.3. Market Trends
- 3.4. Market Opportunities
- 4. Market Factor Analysis
- 4.1. Porters Five Forces
- 4.1.1. Bargaining Power of Suppliers
- 4.1.2. Bargaining Power of Buyers
- 4.1.3. Threat of New Entrants
- 4.1.4. Threat of Substitutes
- 4.1.5. Competitive Rivalry
- 4.2. PESTEL analysis
- 4.3. BCG Analysis
- 4.3.1. Stars (High Growth, High Market Share)
- 4.3.2. Cash Cows (Low Growth, High Market Share)
- 4.3.3. Question Mark (High Growth, Low Market Share)
- 4.3.4. Dogs (Low Growth, Low Market Share)
- 4.4. Ansoff Matrix Analysis
- 4.5. Supply Chain Analysis
- 4.6. Regulatory Landscape
- 4.7. Current Market Potential and Opportunity Assessment (TAM–SAM–SOM Framework)
- 4.8. IMR Analyst Note
- 4.1. Porters Five Forces
- 5. Market Analysis, Insights and Forecast 2021-2033
- 5.1. Market Analysis, Insights and Forecast - by End User
- 5.1.1. Desktop
- 5.1.2. Mobile
- 5.2. Market Analysis, Insights and Forecast - by Region
- 5.2.1. North America
- 5.2.2. Europe
- 5.2.3. Asia Pacific
- 5.2.4. South America
- 5.2.5. Middle East and Africa
- 5.1. Market Analysis, Insights and Forecast - by End User
- 6. Global Online Lottery Industry Analysis, Insights and Forecast, 2021-2033
- 6.1. Market Analysis, Insights and Forecast - by End User
- 6.1.1. Desktop
- 6.1.2. Mobile
- 6.1. Market Analysis, Insights and Forecast - by End User
- 7. North America Online Lottery Industry Analysis, Insights and Forecast, 2020-2032
- 7.1. Market Analysis, Insights and Forecast - by End User
- 7.1.1. Desktop
- 7.1.2. Mobile
- 7.1. Market Analysis, Insights and Forecast - by End User
- 8. Europe Online Lottery Industry Analysis, Insights and Forecast, 2020-2032
- 8.1. Market Analysis, Insights and Forecast - by End User
- 8.1.1. Desktop
- 8.1.2. Mobile
- 8.1. Market Analysis, Insights and Forecast - by End User
- 9. Asia Pacific Online Lottery Industry Analysis, Insights and Forecast, 2020-2032
- 9.1. Market Analysis, Insights and Forecast - by End User
- 9.1.1. Desktop
- 9.1.2. Mobile
- 9.1. Market Analysis, Insights and Forecast - by End User
- 10. South America Online Lottery Industry Analysis, Insights and Forecast, 2020-2032
- 10.1. Market Analysis, Insights and Forecast - by End User
- 10.1.1. Desktop
- 10.1.2. Mobile
- 10.1. Market Analysis, Insights and Forecast - by End User
- 11. Middle East and Africa Online Lottery Industry Analysis, Insights and Forecast, 2020-2032
- 11.1. Market Analysis, Insights and Forecast - by End User
- 11.1.1. Desktop
- 11.1.2. Mobile
- 11.1. Market Analysis, Insights and Forecast - by End User
- 12. Competitive Analysis
- 12.1. Company Profiles
- 12.1.1 Lottoland
- 12.1.1.1. Company Overview
- 12.1.1.2. Products
- 12.1.1.3. Company Financials
- 12.1.1.4. SWOT Analysis
- 12.1.2 Lotto
- 12.1.2.1. Company Overview
- 12.1.2.2. Products
- 12.1.2.3. Company Financials
- 12.1.2.4. SWOT Analysis
- 12.1.3 WinTrillions
- 12.1.3.1. Company Overview
- 12.1.3.2. Products
- 12.1.3.3. Company Financials
- 12.1.3.4. SWOT Analysis
- 12.1.4 Lotto Agent
- 12.1.4.1. Company Overview
- 12.1.4.2. Products
- 12.1.4.3. Company Financials
- 12.1.4.4. SWOT Analysis
- 12.1.5 Francaise des Jeux
- 12.1.5.1. Company Overview
- 12.1.5.2. Products
- 12.1.5.3. Company Financials
- 12.1.5.4. SWOT Analysis
- 12.1.6 Camelot Group
- 12.1.6.1. Company Overview
- 12.1.6.2. Products
- 12.1.6.3. Company Financials
- 12.1.6.4. SWOT Analysis
- 12.1.7 LottoKings
- 12.1.7.1. Company Overview
- 12.1.7.2. Products
- 12.1.7.3. Company Financials
- 12.1.7.4. SWOT Analysis
- 12.1.8 ZEAL Network SE
- 12.1.8.1. Company Overview
- 12.1.8.2. Products
- 12.1.8.3. Company Financials
- 12.1.8.4. SWOT Analysis
- 12.1.9 Lotto Direct Limited
- 12.1.9.1. Company Overview
- 12.1.9.2. Products
- 12.1.9.3. Company Financials
- 12.1.9.4. SWOT Analysis
- 12.1.10 Annexio Limited*List Not Exhaustive
- 12.1.10.1. Company Overview
- 12.1.10.2. Products
- 12.1.10.3. Company Financials
- 12.1.10.4. SWOT Analysis
- 12.1.1 Lottoland
- 12.2. Market Entropy
- 12.2.1 Company's Key Areas Served
- 12.2.2 Recent Developments
- 12.3. Company Market Share Analysis 2025
- 12.3.1 Top 5 Companies Market Share Analysis
- 12.3.2 Top 3 Companies Market Share Analysis
- 12.4. List of Potential Customers
- 13. Research Methodology
List of Figures
- Figure 1: Global Online Lottery Industry Revenue Breakdown (billion, %) by Region 2025 & 2033
- Figure 2: North America Online Lottery Industry Revenue (billion), by End User 2025 & 2033
- Figure 3: North America Online Lottery Industry Revenue Share (%), by End User 2025 & 2033
- Figure 4: North America Online Lottery Industry Revenue (billion), by Country 2025 & 2033
- Figure 5: North America Online Lottery Industry Revenue Share (%), by Country 2025 & 2033
- Figure 6: Europe Online Lottery Industry Revenue (billion), by End User 2025 & 2033
- Figure 7: Europe Online Lottery Industry Revenue Share (%), by End User 2025 & 2033
- Figure 8: Europe Online Lottery Industry Revenue (billion), by Country 2025 & 2033
- Figure 9: Europe Online Lottery Industry Revenue Share (%), by Country 2025 & 2033
- Figure 10: Asia Pacific Online Lottery Industry Revenue (billion), by End User 2025 & 2033
- Figure 11: Asia Pacific Online Lottery Industry Revenue Share (%), by End User 2025 & 2033
- Figure 12: Asia Pacific Online Lottery Industry Revenue (billion), by Country 2025 & 2033
- Figure 13: Asia Pacific Online Lottery Industry Revenue Share (%), by Country 2025 & 2033
- Figure 14: South America Online Lottery Industry Revenue (billion), by End User 2025 & 2033
- Figure 15: South America Online Lottery Industry Revenue Share (%), by End User 2025 & 2033
- Figure 16: South America Online Lottery Industry Revenue (billion), by Country 2025 & 2033
- Figure 17: South America Online Lottery Industry Revenue Share (%), by Country 2025 & 2033
- Figure 18: Middle East and Africa Online Lottery Industry Revenue (billion), by End User 2025 & 2033
- Figure 19: Middle East and Africa Online Lottery Industry Revenue Share (%), by End User 2025 & 2033
- Figure 20: Middle East and Africa Online Lottery Industry Revenue (billion), by Country 2025 & 2033
- Figure 21: Middle East and Africa Online Lottery Industry Revenue Share (%), by Country 2025 & 2033
List of Tables
- Table 1: Global Online Lottery Industry Revenue billion Forecast, by End User 2020 & 2033
- Table 2: Global Online Lottery Industry Revenue billion Forecast, by Region 2020 & 2033
- Table 3: Global Online Lottery Industry Revenue billion Forecast, by End User 2020 & 2033
- Table 4: Global Online Lottery Industry Revenue billion Forecast, by Country 2020 & 2033
- Table 5: United States Online Lottery Industry Revenue (billion) Forecast, by Application 2020 & 2033
- Table 6: Canada Online Lottery Industry Revenue (billion) Forecast, by Application 2020 & 2033
- Table 7: Mexico Online Lottery Industry Revenue (billion) Forecast, by Application 2020 & 2033
- Table 8: Rest of North America Online Lottery Industry Revenue (billion) Forecast, by Application 2020 & 2033
- Table 9: Global Online Lottery Industry Revenue billion Forecast, by End User 2020 & 2033
- Table 10: Global Online Lottery Industry Revenue billion Forecast, by Country 2020 & 2033
- Table 11: Spain Online Lottery Industry Revenue (billion) Forecast, by Application 2020 & 2033
- Table 12: United Kingdom Online Lottery Industry Revenue (billion) Forecast, by Application 2020 & 2033
- Table 13: Germany Online Lottery Industry Revenue (billion) Forecast, by Application 2020 & 2033
- Table 14: France Online Lottery Industry Revenue (billion) Forecast, by Application 2020 & 2033
- Table 15: Italy Online Lottery Industry Revenue (billion) Forecast, by Application 2020 & 2033
- Table 16: Sweden Online Lottery Industry Revenue (billion) Forecast, by Application 2020 & 2033
- Table 17: Rest of Europe Online Lottery Industry Revenue (billion) Forecast, by Application 2020 & 2033
- Table 18: Global Online Lottery Industry Revenue billion Forecast, by End User 2020 & 2033
- Table 19: Global Online Lottery Industry Revenue billion Forecast, by Country 2020 & 2033
- Table 20: China Online Lottery Industry Revenue (billion) Forecast, by Application 2020 & 2033
- Table 21: India Online Lottery Industry Revenue (billion) Forecast, by Application 2020 & 2033
- Table 22: Japan Online Lottery Industry Revenue (billion) Forecast, by Application 2020 & 2033
- Table 23: Australia Online Lottery Industry Revenue (billion) Forecast, by Application 2020 & 2033
- Table 24: Rest of Asia Pacific Online Lottery Industry Revenue (billion) Forecast, by Application 2020 & 2033
- Table 25: Global Online Lottery Industry Revenue billion Forecast, by End User 2020 & 2033
- Table 26: Global Online Lottery Industry Revenue billion Forecast, by Country 2020 & 2033
- Table 27: Brazil Online Lottery Industry Revenue (billion) Forecast, by Application 2020 & 2033
- Table 28: Argentina Online Lottery Industry Revenue (billion) Forecast, by Application 2020 & 2033
- Table 29: Rest of South America Online Lottery Industry Revenue (billion) Forecast, by Application 2020 & 2033
- Table 30: Global Online Lottery Industry Revenue billion Forecast, by End User 2020 & 2033
- Table 31: Global Online Lottery Industry Revenue billion Forecast, by Country 2020 & 2033
- Table 32: South Africa Online Lottery Industry Revenue (billion) Forecast, by Application 2020 & 2033
- Table 33: United Arab Emirates Online Lottery Industry Revenue (billion) Forecast, by Application 2020 & 2033
- Table 34: Rest of Middle East and Africa Online Lottery Industry Revenue (billion) Forecast, by Application 2020 & 2033
Frequently Asked Questions
1. What is the projected Compound Annual Growth Rate (CAGR) of the Online Lottery Industry?
The projected CAGR is approximately 9.5%.
2. Which companies are prominent players in the Online Lottery Industry?
Key companies in the market include Lottoland, Lotto, WinTrillions, Lotto Agent, Francaise des Jeux, Camelot Group, LottoKings, ZEAL Network SE, Lotto Direct Limited, Annexio Limited*List Not Exhaustive.
3. What are the main segments of the Online Lottery Industry?
The market segments include End User.
4. Can you provide details about the market size?
The market size is estimated to be USD 19.43 billion as of 2022.
5. What are some drivers contributing to market growth?
Growing Appeal for Multi-functional and Damage Control Hair Care Products; Prevalence of Different Hair Concerns Remains the Major Driving Force.
6. What are the notable trends driving market growth?
Improved Internet Connections. Advances in Security. and Increased Number of Internet Users.
7. Are there any restraints impacting market growth?
Growing Availability of Counterfeit Products.
8. Can you provide examples of recent developments in the market?
October 2022: Zeal Network SE expanded its games business internationally. The German market leader for online lotteries collaborated with American online lottery provider Park Avenue Gaming to integrate the online instant games of Zeal into its video lottery terminal business in Argentina and its online platforms in Peru.
9. What pricing options are available for accessing the report?
Pricing options include single-user, multi-user, and enterprise licenses priced at USD 4750, USD 5250, and USD 8750 respectively.
10. Is the market size provided in terms of value or volume?
The market size is provided in terms of value, measured in billion.
11. Are there any specific market keywords associated with the report?
Yes, the market keyword associated with the report is "Online Lottery Industry," which aids in identifying and referencing the specific market segment covered.
12. How do I determine which pricing option suits my needs best?
The pricing options vary based on user requirements and access needs. Individual users may opt for single-user licenses, while businesses requiring broader access may choose multi-user or enterprise licenses for cost-effective access to the report.
13. Are there any additional resources or data provided in the Online Lottery Industry report?
While the report offers comprehensive insights, it's advisable to review the specific contents or supplementary materials provided to ascertain if additional resources or data are available.
14. How can I stay updated on further developments or reports in the Online Lottery Industry?
To stay informed about further developments, trends, and reports in the Online Lottery Industry, consider subscribing to industry newsletters, following relevant companies and organizations, or regularly checking reputable industry news sources and publications.
Methodology
Step 1 - Identification of Relevant Samples Size from Population Database


Step 2 - Approaches for Defining Global Market Size (Value, Volume* & Price*)

Note*: In applicable scenarios
Step 3 - Data Sources
Primary Research
- Web Analytics
- Survey Reports
- Research Institute
- Latest Research Reports
- Opinion Leaders
Secondary Research
- Annual Reports
- White Paper
- Latest Press Release
- Industry Association
- Paid Database
- Investor Presentations

Step 4 - Data Triangulation
Involves using different sources of information in order to increase the validity of a study
These sources are likely to be stakeholders in a program - participants, other researchers, program staff, other community members, and so on.
Then we put all data in single framework & apply various statistical tools to find out the dynamic on the market.
During the analysis stage, feedback from the stakeholder groups would be compared to determine areas of agreement as well as areas of divergence