

Key Insights
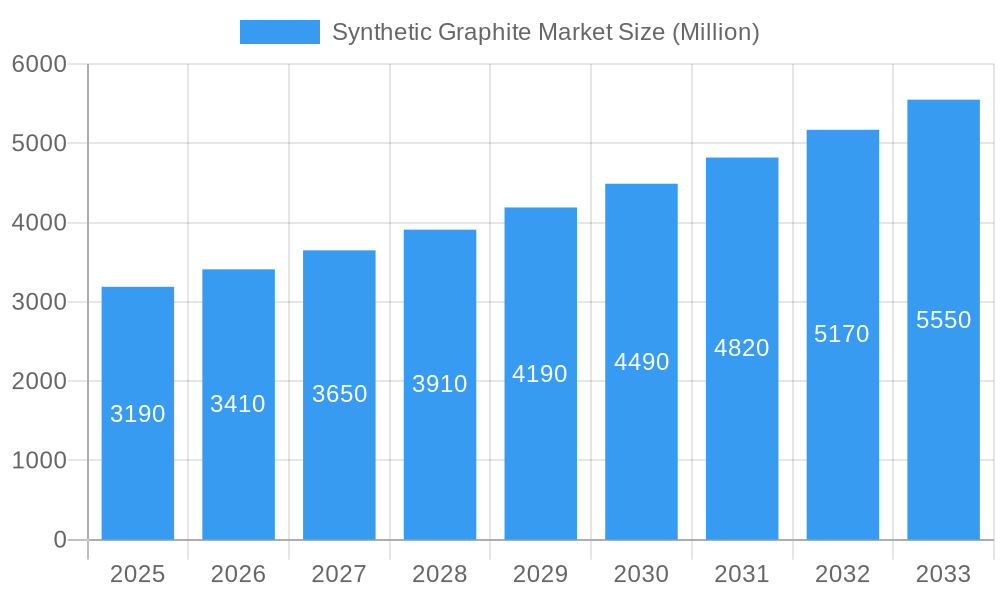
The global synthetic graphite market, valued at $3.19 billion in 2025, is projected to experience robust growth, driven by the burgeoning demand from the battery and renewable energy sectors. A compound annual growth rate (CAGR) of 6.83% from 2025 to 2033 indicates a significant expansion, exceeding $5 billion by the end of the forecast period. Key drivers include the increasing adoption of electric vehicles (EVs), the growth of energy storage systems (ESS) for renewable energy integration, and the rising demand for high-performance materials in various industrial applications, such as metallurgy and nuclear energy. The market segmentation reveals a strong focus on graphite anode materials for lithium-ion batteries, currently dominating market share, followed by graphite blocks used in various industrial applications. While Asia-Pacific, particularly China, currently holds a significant market share due to established manufacturing capabilities and high demand, North America and Europe are also witnessing substantial growth fueled by government policies supporting renewable energy and electric vehicle adoption. Competition is intense, with major players such as Mersen, Asbury Carbons, and Showa Denko KK striving for market leadership through technological advancements and strategic partnerships. However, potential restraints include price volatility of raw materials, environmental concerns associated with graphite production, and geopolitical uncertainties impacting supply chains.
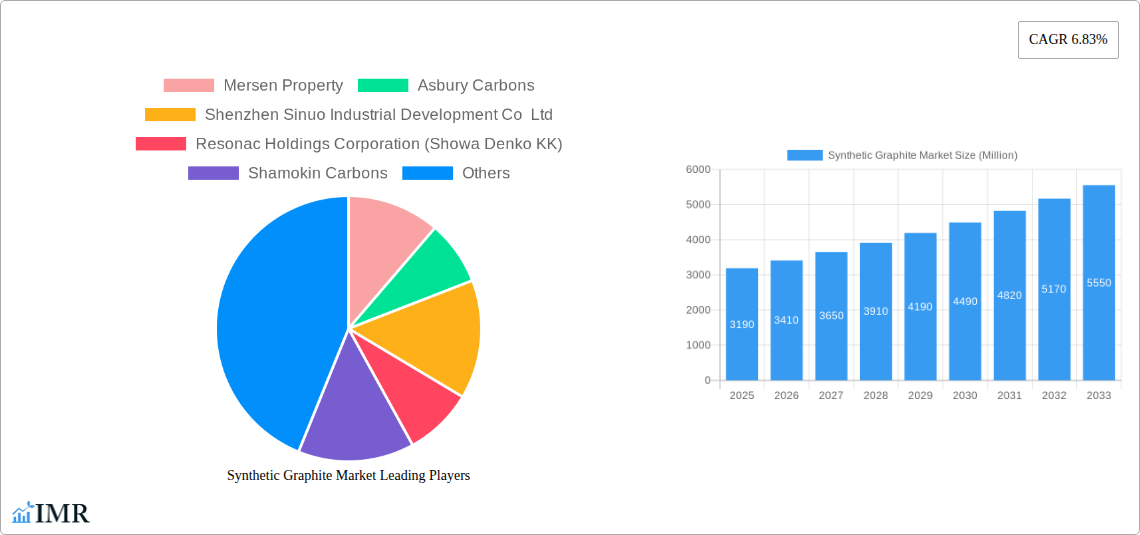
Synthetic Graphite Market Market Size (In Billion)
The market's future trajectory is intricately linked to advancements in battery technology and the broader shift toward sustainable energy solutions. The development of high-performance synthetic graphite with enhanced energy density and cycle life will further propel market growth. Furthermore, increasing research and development efforts focused on sustainable and ethically sourced graphite are crucial for long-term market sustainability. Regional variations in growth will likely persist, influenced by factors such as government regulations, infrastructure development, and the pace of adoption of electric vehicles and renewable energy technologies. Strategic alliances and mergers & acquisitions among key players are anticipated to reshape the competitive landscape in the coming years. Companies are focusing on improving the quality and efficiency of their products to gain a competitive edge and cater to the growing demand. Investment in R&D for novel graphite applications and improved production processes will be crucial for companies to maintain a strong market position.
Synthetic Graphite Market Company Market Share
Synthetic Graphite Market: A Comprehensive Report (2019-2033)
This comprehensive report provides an in-depth analysis of the Synthetic Graphite Market, encompassing market dynamics, growth trends, regional segmentation, product landscape, key players, and future outlook. The study period spans from 2019 to 2033, with 2025 serving as the base and estimated year. This report is invaluable for industry professionals, investors, and researchers seeking a clear understanding of this rapidly evolving market. The report delves into the parent market of Graphite Materials and the child market of Synthetic Graphite, offering a granular view of market segments including Graphite Anode, Graphite Block (Fine Carbon), and Other Types (Graphite Electrode, etc.) across applications like Metallurgy, Parts and Components, Batteries, Nuclear, and Other Applications.
Synthetic Graphite Market Market Dynamics & Structure
The Synthetic Graphite market is characterized by moderate concentration, with key players holding significant market share. Technological innovation, particularly in battery technology and materials science, is a primary growth driver. Stringent environmental regulations and evolving safety standards also shape market dynamics. Competitive substitutes, such as alternative anode materials in batteries, present ongoing challenges. The market exhibits diverse end-user demographics, spanning various industries. M&A activity has been moderate, with several strategic acquisitions aiming to expand production capacity and enhance technological capabilities.
- Market Concentration: Moderately concentrated, with the top 5 players holding approximately xx% of the market share in 2024.
- Technological Innovation: Focus on improving purity, performance, and cost-effectiveness of synthetic graphite, driven by advancements in battery technologies.
- Regulatory Framework: Stringent environmental regulations in key regions influence production methods and waste management practices.
- Competitive Substitutes: Alternative anode materials (e.g., silicon, lithium titanate) pose a competitive threat to synthetic graphite in specific applications.
- End-User Demographics: Diverse, encompassing metallurgy, automotive, energy storage, and nuclear industries.
- M&A Trends: Moderate M&A activity observed in recent years, with focus on strengthening supply chains and expanding geographic reach. The total value of M&A deals in 2024 was estimated at xx Million.
Synthetic Graphite Market Growth Trends & Insights
The Synthetic Graphite market has witnessed significant growth over the historical period (2019-2024), driven primarily by the burgeoning electric vehicle (EV) industry and the increasing demand for high-performance batteries. The market size in 2024 reached xx Million, and is projected to grow at a CAGR of xx% during the forecast period (2025-2033), reaching xx Million by 2033. This growth is fueled by technological advancements leading to improved battery performance and increasing adoption of energy storage solutions in various sectors. Consumer preference shifts towards sustainable and high-performance energy technologies are further propelling market expansion. Market penetration in key applications like batteries is steadily increasing, with significant potential for further growth in emerging markets.
Dominant Regions, Countries, or Segments in Synthetic Graphite Market
The Asia-Pacific region dominates the Synthetic Graphite market, driven by robust growth in the EV sector, substantial investments in energy storage infrastructure, and a large manufacturing base. China, Japan, and South Korea are leading national markets within the region. Within the segments, the Graphite Anode segment holds the largest market share due to its widespread use in lithium-ion batteries. The Batteries application segment is the most significant growth driver, fueled by the expanding electric vehicle market and the increasing demand for energy storage solutions.
- Key Drivers (Asia-Pacific): Rapid growth of the electric vehicle market, increasing investments in renewable energy infrastructure, supportive government policies promoting clean energy adoption.
- Market Share (Asia-Pacific): Held approximately xx% of the global market share in 2024.
- Growth Potential (Batteries application): High growth potential due to continued expansion of the electric vehicle market and increasing adoption of stationary energy storage systems.
- Dominant Segment (Graphite Anode): Largest market share due to its crucial role in lithium-ion batteries.
Synthetic Graphite Market Product Landscape
Synthetic graphite products are categorized by type (Graphite Anode, Graphite Block, Other Types) and tailored for diverse applications. Innovations focus on enhancing purity, particle size distribution, and electrical conductivity to improve battery performance. Key selling propositions include high thermal conductivity, superior electrochemical properties, and enhanced cycle life. Technological advancements include the development of novel production techniques to reduce costs and improve sustainability.
Key Drivers, Barriers & Challenges in Synthetic Graphite Market
Key Drivers: The rising demand for lithium-ion batteries in electric vehicles and energy storage systems is a primary growth driver. Government support for renewable energy initiatives and technological advancements leading to higher-performance batteries are also significant factors.
Key Challenges: Fluctuations in raw material prices, supply chain disruptions, and intense competition from alternative anode materials pose significant challenges. Furthermore, environmental concerns associated with graphite mining and processing necessitate sustainable production practices. These factors can significantly impact production costs and market profitability. The cost of synthetic graphite production has increased by xx% from 2019 to 2024.
Emerging Opportunities in Synthetic Graphite Market
Untapped markets in developing economies present significant growth opportunities. Innovations in battery technologies, such as solid-state batteries and next-generation energy storage solutions, are driving demand for specialized synthetic graphite materials. Growing consumer preference for sustainable and environmentally friendly products is creating demand for sustainably sourced and produced synthetic graphite.
Growth Accelerators in the Synthetic Graphite Market Industry
Technological advancements in production processes, leading to higher purity and consistent quality synthetic graphite are key growth catalysts. Strategic partnerships between graphite producers and battery manufacturers enhance supply chain efficiency and ensure timely access to raw materials. Market expansion into emerging economies with growing energy storage needs fuels substantial growth.
Key Players Shaping the Synthetic Graphite Market Market
- Mersen Property
- Asbury Carbons
- Shenzhen Sinuo Industrial Development Co Ltd
- Resonac Holdings Corporation (Showa Denko KK)
- Shamokin Carbons
- Mitsubishi Chemical Corporation
- Nippon Carbon Co Ltd
- Jiangxi Zichen Technology Co Ltd
- Tokai Cobex GmbH
- GrafTech International
- BTR New Materials Group Co Ltd
- Imerys
- Shanghai Shanshan Technology Co Ltd
- Graphit Kropfmhl GmbH
- Graphite India Limited
- Lianyungang Jinli Carbon Co Ltd
Notable Milestones in Synthetic Graphite Market Sector
- October 2022: Imerys Imerys Graphite & Carbon Company announced the launch of the EMILI Project, a landmark lithium exploitation project potentially reducing lithium imports and producing nearly 700,000 electric vehicle batteries annually. This significantly impacts the supply chain for lithium-ion batteries and the demand for synthetic graphite.
- April 2022: Shanshan Corporation secured USD 477 million in investment, boosting its lithium battery material production capacity and further strengthening the demand for high-quality synthetic graphite. This demonstrates investor confidence in the future of the lithium-ion battery industry and its reliance on synthetic graphite.
In-Depth Synthetic Graphite Market Market Outlook
The Synthetic Graphite market is poised for sustained growth, driven by the continued expansion of the electric vehicle market and the increasing adoption of renewable energy technologies. Strategic investments in research and development, coupled with the development of sustainable production methods, will further propel market expansion. Opportunities exist for companies to capitalize on the growing demand for high-performance synthetic graphite materials by investing in innovative production technologies and expanding their market reach.
Synthetic Graphite Market Segmentation
-
1. Type
- 1.1. Graphite Anode
- 1.2. Graphite Block (Fine Carbon)
- 1.3. Other Types (Graphite Electrode, etc.)
-
2. Application
- 2.1. Metallurgy
- 2.2. Parts and Components
- 2.3. Batteries
- 2.4. Nuclear
- 2.5. Other Applications
Synthetic Graphite Market Segmentation By Geography
-
1. Asia Pacific
- 1.1. China
- 1.2. India
- 1.3. Japan
- 1.4. South Korea
- 1.5. Asean Countries
- 1.6. Rest of Asia Pacific
-
2. North America
- 2.1. United States
- 2.2. Canada
- 2.3. Mexico
-
3. Europe
- 3.1. Germany
- 3.2. United Kingdom
- 3.3. Italy
- 3.4. France
- 3.5. Russia
- 3.6. Rest of Europe
-
4. South America
- 4.1. Brazil
- 4.2. Argentina
- 4.3. Rest of South America
-
5. Middle East and Africa
- 5.1. Saudi Arabia
- 5.2. South Africa
- 5.3. Rest of Middle East and Africa
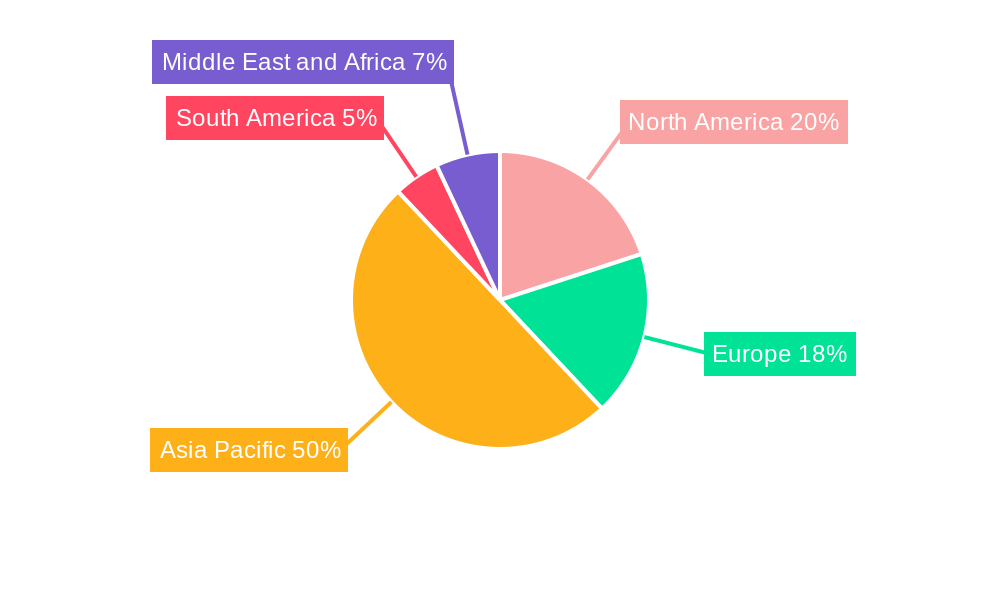
Synthetic Graphite Market Regional Market Share
Geographic Coverage of Synthetic Graphite Market
Synthetic Graphite Market REPORT HIGHLIGHTS
| Aspects | Details |
|---|---|
| Study Period | 2020-2034 |
| Base Year | 2025 |
| Estimated Year | 2026 |
| Forecast Period | 2026-2034 |
| Historical Period | 2020-2025 |
| Growth Rate | CAGR of 15.1% from 2020-2034 |
| Segmentation |
|
Table of Contents
- 1. Introduction
- 1.1. Research Scope
- 1.2. Market Segmentation
- 1.3. Research Objective
- 1.4. Definitions and Assumptions
- 2. Executive Summary
- 2.1. Market Snapshot
- 3. Market Dynamics
- 3.1. Market Drivers
- 3.2. Market Restrains
- 3.3. Market Trends
- 3.4. Market Opportunities
- 4. Market Factor Analysis
- 4.1. Porters Five Forces
- 4.1.1. Bargaining Power of Suppliers
- 4.1.2. Bargaining Power of Buyers
- 4.1.3. Threat of New Entrants
- 4.1.4. Threat of Substitutes
- 4.1.5. Competitive Rivalry
- 4.2. PESTEL analysis
- 4.3. BCG Analysis
- 4.3.1. Stars (High Growth, High Market Share)
- 4.3.2. Cash Cows (Low Growth, High Market Share)
- 4.3.3. Question Mark (High Growth, Low Market Share)
- 4.3.4. Dogs (Low Growth, Low Market Share)
- 4.4. Ansoff Matrix Analysis
- 4.5. Supply Chain Analysis
- 4.6. Regulatory Landscape
- 4.7. Current Market Potential and Opportunity Assessment (TAM–SAM–SOM Framework)
- 4.8. IMR Analyst Note
- 4.1. Porters Five Forces
- 5. Market Analysis, Insights and Forecast 2021-2033
- 5.1. Market Analysis, Insights and Forecast - by Type
- 5.1.1. Graphite Anode
- 5.1.2. Graphite Block (Fine Carbon)
- 5.1.3. Other Types (Graphite Electrode, etc.)
- 5.2. Market Analysis, Insights and Forecast - by Application
- 5.2.1. Metallurgy
- 5.2.2. Parts and Components
- 5.2.3. Batteries
- 5.2.4. Nuclear
- 5.2.5. Other Applications
- 5.3. Market Analysis, Insights and Forecast - by Region
- 5.3.1. Asia Pacific
- 5.3.2. North America
- 5.3.3. Europe
- 5.3.4. South America
- 5.3.5. Middle East and Africa
- 5.1. Market Analysis, Insights and Forecast - by Type
- 6. Global Synthetic Graphite Market Analysis, Insights and Forecast, 2021-2033
- 6.1. Market Analysis, Insights and Forecast - by Type
- 6.1.1. Graphite Anode
- 6.1.2. Graphite Block (Fine Carbon)
- 6.1.3. Other Types (Graphite Electrode, etc.)
- 6.2. Market Analysis, Insights and Forecast - by Application
- 6.2.1. Metallurgy
- 6.2.2. Parts and Components
- 6.2.3. Batteries
- 6.2.4. Nuclear
- 6.2.5. Other Applications
- 6.1. Market Analysis, Insights and Forecast - by Type
- 7. Asia Pacific Synthetic Graphite Market Analysis, Insights and Forecast, 2020-2032
- 7.1. Market Analysis, Insights and Forecast - by Type
- 7.1.1. Graphite Anode
- 7.1.2. Graphite Block (Fine Carbon)
- 7.1.3. Other Types (Graphite Electrode, etc.)
- 7.2. Market Analysis, Insights and Forecast - by Application
- 7.2.1. Metallurgy
- 7.2.2. Parts and Components
- 7.2.3. Batteries
- 7.2.4. Nuclear
- 7.2.5. Other Applications
- 7.1. Market Analysis, Insights and Forecast - by Type
- 8. North America Synthetic Graphite Market Analysis, Insights and Forecast, 2020-2032
- 8.1. Market Analysis, Insights and Forecast - by Type
- 8.1.1. Graphite Anode
- 8.1.2. Graphite Block (Fine Carbon)
- 8.1.3. Other Types (Graphite Electrode, etc.)
- 8.2. Market Analysis, Insights and Forecast - by Application
- 8.2.1. Metallurgy
- 8.2.2. Parts and Components
- 8.2.3. Batteries
- 8.2.4. Nuclear
- 8.2.5. Other Applications
- 8.1. Market Analysis, Insights and Forecast - by Type
- 9. Europe Synthetic Graphite Market Analysis, Insights and Forecast, 2020-2032
- 9.1. Market Analysis, Insights and Forecast - by Type
- 9.1.1. Graphite Anode
- 9.1.2. Graphite Block (Fine Carbon)
- 9.1.3. Other Types (Graphite Electrode, etc.)
- 9.2. Market Analysis, Insights and Forecast - by Application
- 9.2.1. Metallurgy
- 9.2.2. Parts and Components
- 9.2.3. Batteries
- 9.2.4. Nuclear
- 9.2.5. Other Applications
- 9.1. Market Analysis, Insights and Forecast - by Type
- 10. South America Synthetic Graphite Market Analysis, Insights and Forecast, 2020-2032
- 10.1. Market Analysis, Insights and Forecast - by Type
- 10.1.1. Graphite Anode
- 10.1.2. Graphite Block (Fine Carbon)
- 10.1.3. Other Types (Graphite Electrode, etc.)
- 10.2. Market Analysis, Insights and Forecast - by Application
- 10.2.1. Metallurgy
- 10.2.2. Parts and Components
- 10.2.3. Batteries
- 10.2.4. Nuclear
- 10.2.5. Other Applications
- 10.1. Market Analysis, Insights and Forecast - by Type
- 11. Middle East and Africa Synthetic Graphite Market Analysis, Insights and Forecast, 2020-2032
- 11.1. Market Analysis, Insights and Forecast - by Type
- 11.1.1. Graphite Anode
- 11.1.2. Graphite Block (Fine Carbon)
- 11.1.3. Other Types (Graphite Electrode, etc.)
- 11.2. Market Analysis, Insights and Forecast - by Application
- 11.2.1. Metallurgy
- 11.2.2. Parts and Components
- 11.2.3. Batteries
- 11.2.4. Nuclear
- 11.2.5. Other Applications
- 11.1. Market Analysis, Insights and Forecast - by Type
- 12. Competitive Analysis
- 12.1. Company Profiles
- 12.1.1 Mersen Property
- 12.1.1.1. Company Overview
- 12.1.1.2. Products
- 12.1.1.3. Company Financials
- 12.1.1.4. SWOT Analysis
- 12.1.2 Asbury Carbons
- 12.1.2.1. Company Overview
- 12.1.2.2. Products
- 12.1.2.3. Company Financials
- 12.1.2.4. SWOT Analysis
- 12.1.3 Shenzhen Sinuo Industrial Development Co Ltd
- 12.1.3.1. Company Overview
- 12.1.3.2. Products
- 12.1.3.3. Company Financials
- 12.1.3.4. SWOT Analysis
- 12.1.4 Resonac Holdings Corporation (Showa Denko KK)
- 12.1.4.1. Company Overview
- 12.1.4.2. Products
- 12.1.4.3. Company Financials
- 12.1.4.4. SWOT Analysis
- 12.1.5 Shamokin Carbons
- 12.1.5.1. Company Overview
- 12.1.5.2. Products
- 12.1.5.3. Company Financials
- 12.1.5.4. SWOT Analysis
- 12.1.6 Mitsubishi Chemical Corporation
- 12.1.6.1. Company Overview
- 12.1.6.2. Products
- 12.1.6.3. Company Financials
- 12.1.6.4. SWOT Analysis
- 12.1.7 Nippon Carbon Co Ltd
- 12.1.7.1. Company Overview
- 12.1.7.2. Products
- 12.1.7.3. Company Financials
- 12.1.7.4. SWOT Analysis
- 12.1.8 Jiangxi Zichen Technology Co Ltd
- 12.1.8.1. Company Overview
- 12.1.8.2. Products
- 12.1.8.3. Company Financials
- 12.1.8.4. SWOT Analysis
- 12.1.9 Tokai Cobex GmbH
- 12.1.9.1. Company Overview
- 12.1.9.2. Products
- 12.1.9.3. Company Financials
- 12.1.9.4. SWOT Analysis
- 12.1.10 GrafTech International
- 12.1.10.1. Company Overview
- 12.1.10.2. Products
- 12.1.10.3. Company Financials
- 12.1.10.4. SWOT Analysis
- 12.1.11 BTR New Materials Group Co Ltd
- 12.1.11.1. Company Overview
- 12.1.11.2. Products
- 12.1.11.3. Company Financials
- 12.1.11.4. SWOT Analysis
- 12.1.12 Imerys
- 12.1.12.1. Company Overview
- 12.1.12.2. Products
- 12.1.12.3. Company Financials
- 12.1.12.4. SWOT Analysis
- 12.1.13 Shanghai Shanshan Technology Co Ltd
- 12.1.13.1. Company Overview
- 12.1.13.2. Products
- 12.1.13.3. Company Financials
- 12.1.13.4. SWOT Analysis
- 12.1.14 Graphit Kropfmhl GmbH
- 12.1.14.1. Company Overview
- 12.1.14.2. Products
- 12.1.14.3. Company Financials
- 12.1.14.4. SWOT Analysis
- 12.1.15 Graphite India Limited
- 12.1.15.1. Company Overview
- 12.1.15.2. Products
- 12.1.15.3. Company Financials
- 12.1.15.4. SWOT Analysis
- 12.1.16 Lianyungang Jinli Carbon Co Ltd
- 12.1.16.1. Company Overview
- 12.1.16.2. Products
- 12.1.16.3. Company Financials
- 12.1.16.4. SWOT Analysis
- 12.1.1 Mersen Property
- 12.2. Market Entropy
- 12.2.1 Company's Key Areas Served
- 12.2.2 Recent Developments
- 12.3. Company Market Share Analysis 2025
- 12.3.1 Top 5 Companies Market Share Analysis
- 12.3.2 Top 3 Companies Market Share Analysis
- 12.4. List of Potential Customers
- 13. Research Methodology
List of Figures
- Figure 1: Global Synthetic Graphite Market Revenue Breakdown (billion, %) by Region 2025 & 2033
- Figure 2: Global Synthetic Graphite Market Volume Breakdown (K Tons, %) by Region 2025 & 2033
- Figure 3: Asia Pacific Synthetic Graphite Market Revenue (billion), by Type 2025 & 2033
- Figure 4: Asia Pacific Synthetic Graphite Market Volume (K Tons), by Type 2025 & 2033
- Figure 5: Asia Pacific Synthetic Graphite Market Revenue Share (%), by Type 2025 & 2033
- Figure 6: Asia Pacific Synthetic Graphite Market Volume Share (%), by Type 2025 & 2033
- Figure 7: Asia Pacific Synthetic Graphite Market Revenue (billion), by Application 2025 & 2033
- Figure 8: Asia Pacific Synthetic Graphite Market Volume (K Tons), by Application 2025 & 2033
- Figure 9: Asia Pacific Synthetic Graphite Market Revenue Share (%), by Application 2025 & 2033
- Figure 10: Asia Pacific Synthetic Graphite Market Volume Share (%), by Application 2025 & 2033
- Figure 11: Asia Pacific Synthetic Graphite Market Revenue (billion), by Country 2025 & 2033
- Figure 12: Asia Pacific Synthetic Graphite Market Volume (K Tons), by Country 2025 & 2033
- Figure 13: Asia Pacific Synthetic Graphite Market Revenue Share (%), by Country 2025 & 2033
- Figure 14: Asia Pacific Synthetic Graphite Market Volume Share (%), by Country 2025 & 2033
- Figure 15: North America Synthetic Graphite Market Revenue (billion), by Type 2025 & 2033
- Figure 16: North America Synthetic Graphite Market Volume (K Tons), by Type 2025 & 2033
- Figure 17: North America Synthetic Graphite Market Revenue Share (%), by Type 2025 & 2033
- Figure 18: North America Synthetic Graphite Market Volume Share (%), by Type 2025 & 2033
- Figure 19: North America Synthetic Graphite Market Revenue (billion), by Application 2025 & 2033
- Figure 20: North America Synthetic Graphite Market Volume (K Tons), by Application 2025 & 2033
- Figure 21: North America Synthetic Graphite Market Revenue Share (%), by Application 2025 & 2033
- Figure 22: North America Synthetic Graphite Market Volume Share (%), by Application 2025 & 2033
- Figure 23: North America Synthetic Graphite Market Revenue (billion), by Country 2025 & 2033
- Figure 24: North America Synthetic Graphite Market Volume (K Tons), by Country 2025 & 2033
- Figure 25: North America Synthetic Graphite Market Revenue Share (%), by Country 2025 & 2033
- Figure 26: North America Synthetic Graphite Market Volume Share (%), by Country 2025 & 2033
- Figure 27: Europe Synthetic Graphite Market Revenue (billion), by Type 2025 & 2033
- Figure 28: Europe Synthetic Graphite Market Volume (K Tons), by Type 2025 & 2033
- Figure 29: Europe Synthetic Graphite Market Revenue Share (%), by Type 2025 & 2033
- Figure 30: Europe Synthetic Graphite Market Volume Share (%), by Type 2025 & 2033
- Figure 31: Europe Synthetic Graphite Market Revenue (billion), by Application 2025 & 2033
- Figure 32: Europe Synthetic Graphite Market Volume (K Tons), by Application 2025 & 2033
- Figure 33: Europe Synthetic Graphite Market Revenue Share (%), by Application 2025 & 2033
- Figure 34: Europe Synthetic Graphite Market Volume Share (%), by Application 2025 & 2033
- Figure 35: Europe Synthetic Graphite Market Revenue (billion), by Country 2025 & 2033
- Figure 36: Europe Synthetic Graphite Market Volume (K Tons), by Country 2025 & 2033
- Figure 37: Europe Synthetic Graphite Market Revenue Share (%), by Country 2025 & 2033
- Figure 38: Europe Synthetic Graphite Market Volume Share (%), by Country 2025 & 2033
- Figure 39: South America Synthetic Graphite Market Revenue (billion), by Type 2025 & 2033
- Figure 40: South America Synthetic Graphite Market Volume (K Tons), by Type 2025 & 2033
- Figure 41: South America Synthetic Graphite Market Revenue Share (%), by Type 2025 & 2033
- Figure 42: South America Synthetic Graphite Market Volume Share (%), by Type 2025 & 2033
- Figure 43: South America Synthetic Graphite Market Revenue (billion), by Application 2025 & 2033
- Figure 44: South America Synthetic Graphite Market Volume (K Tons), by Application 2025 & 2033
- Figure 45: South America Synthetic Graphite Market Revenue Share (%), by Application 2025 & 2033
- Figure 46: South America Synthetic Graphite Market Volume Share (%), by Application 2025 & 2033
- Figure 47: South America Synthetic Graphite Market Revenue (billion), by Country 2025 & 2033
- Figure 48: South America Synthetic Graphite Market Volume (K Tons), by Country 2025 & 2033
- Figure 49: South America Synthetic Graphite Market Revenue Share (%), by Country 2025 & 2033
- Figure 50: South America Synthetic Graphite Market Volume Share (%), by Country 2025 & 2033
- Figure 51: Middle East and Africa Synthetic Graphite Market Revenue (billion), by Type 2025 & 2033
- Figure 52: Middle East and Africa Synthetic Graphite Market Volume (K Tons), by Type 2025 & 2033
- Figure 53: Middle East and Africa Synthetic Graphite Market Revenue Share (%), by Type 2025 & 2033
- Figure 54: Middle East and Africa Synthetic Graphite Market Volume Share (%), by Type 2025 & 2033
- Figure 55: Middle East and Africa Synthetic Graphite Market Revenue (billion), by Application 2025 & 2033
- Figure 56: Middle East and Africa Synthetic Graphite Market Volume (K Tons), by Application 2025 & 2033
- Figure 57: Middle East and Africa Synthetic Graphite Market Revenue Share (%), by Application 2025 & 2033
- Figure 58: Middle East and Africa Synthetic Graphite Market Volume Share (%), by Application 2025 & 2033
- Figure 59: Middle East and Africa Synthetic Graphite Market Revenue (billion), by Country 2025 & 2033
- Figure 60: Middle East and Africa Synthetic Graphite Market Volume (K Tons), by Country 2025 & 2033
- Figure 61: Middle East and Africa Synthetic Graphite Market Revenue Share (%), by Country 2025 & 2033
- Figure 62: Middle East and Africa Synthetic Graphite Market Volume Share (%), by Country 2025 & 2033
List of Tables
- Table 1: Global Synthetic Graphite Market Revenue billion Forecast, by Type 2020 & 2033
- Table 2: Global Synthetic Graphite Market Volume K Tons Forecast, by Type 2020 & 2033
- Table 3: Global Synthetic Graphite Market Revenue billion Forecast, by Application 2020 & 2033
- Table 4: Global Synthetic Graphite Market Volume K Tons Forecast, by Application 2020 & 2033
- Table 5: Global Synthetic Graphite Market Revenue billion Forecast, by Region 2020 & 2033
- Table 6: Global Synthetic Graphite Market Volume K Tons Forecast, by Region 2020 & 2033
- Table 7: Global Synthetic Graphite Market Revenue billion Forecast, by Type 2020 & 2033
- Table 8: Global Synthetic Graphite Market Volume K Tons Forecast, by Type 2020 & 2033
- Table 9: Global Synthetic Graphite Market Revenue billion Forecast, by Application 2020 & 2033
- Table 10: Global Synthetic Graphite Market Volume K Tons Forecast, by Application 2020 & 2033
- Table 11: Global Synthetic Graphite Market Revenue billion Forecast, by Country 2020 & 2033
- Table 12: Global Synthetic Graphite Market Volume K Tons Forecast, by Country 2020 & 2033
- Table 13: China Synthetic Graphite Market Revenue (billion) Forecast, by Application 2020 & 2033
- Table 14: China Synthetic Graphite Market Volume (K Tons) Forecast, by Application 2020 & 2033
- Table 15: India Synthetic Graphite Market Revenue (billion) Forecast, by Application 2020 & 2033
- Table 16: India Synthetic Graphite Market Volume (K Tons) Forecast, by Application 2020 & 2033
- Table 17: Japan Synthetic Graphite Market Revenue (billion) Forecast, by Application 2020 & 2033
- Table 18: Japan Synthetic Graphite Market Volume (K Tons) Forecast, by Application 2020 & 2033
- Table 19: South Korea Synthetic Graphite Market Revenue (billion) Forecast, by Application 2020 & 2033
- Table 20: South Korea Synthetic Graphite Market Volume (K Tons) Forecast, by Application 2020 & 2033
- Table 21: Asean Countries Synthetic Graphite Market Revenue (billion) Forecast, by Application 2020 & 2033
- Table 22: Asean Countries Synthetic Graphite Market Volume (K Tons) Forecast, by Application 2020 & 2033
- Table 23: Rest of Asia Pacific Synthetic Graphite Market Revenue (billion) Forecast, by Application 2020 & 2033
- Table 24: Rest of Asia Pacific Synthetic Graphite Market Volume (K Tons) Forecast, by Application 2020 & 2033
- Table 25: Global Synthetic Graphite Market Revenue billion Forecast, by Type 2020 & 2033
- Table 26: Global Synthetic Graphite Market Volume K Tons Forecast, by Type 2020 & 2033
- Table 27: Global Synthetic Graphite Market Revenue billion Forecast, by Application 2020 & 2033
- Table 28: Global Synthetic Graphite Market Volume K Tons Forecast, by Application 2020 & 2033
- Table 29: Global Synthetic Graphite Market Revenue billion Forecast, by Country 2020 & 2033
- Table 30: Global Synthetic Graphite Market Volume K Tons Forecast, by Country 2020 & 2033
- Table 31: United States Synthetic Graphite Market Revenue (billion) Forecast, by Application 2020 & 2033
- Table 32: United States Synthetic Graphite Market Volume (K Tons) Forecast, by Application 2020 & 2033
- Table 33: Canada Synthetic Graphite Market Revenue (billion) Forecast, by Application 2020 & 2033
- Table 34: Canada Synthetic Graphite Market Volume (K Tons) Forecast, by Application 2020 & 2033
- Table 35: Mexico Synthetic Graphite Market Revenue (billion) Forecast, by Application 2020 & 2033
- Table 36: Mexico Synthetic Graphite Market Volume (K Tons) Forecast, by Application 2020 & 2033
- Table 37: Global Synthetic Graphite Market Revenue billion Forecast, by Type 2020 & 2033
- Table 38: Global Synthetic Graphite Market Volume K Tons Forecast, by Type 2020 & 2033
- Table 39: Global Synthetic Graphite Market Revenue billion Forecast, by Application 2020 & 2033
- Table 40: Global Synthetic Graphite Market Volume K Tons Forecast, by Application 2020 & 2033
- Table 41: Global Synthetic Graphite Market Revenue billion Forecast, by Country 2020 & 2033
- Table 42: Global Synthetic Graphite Market Volume K Tons Forecast, by Country 2020 & 2033
- Table 43: Germany Synthetic Graphite Market Revenue (billion) Forecast, by Application 2020 & 2033
- Table 44: Germany Synthetic Graphite Market Volume (K Tons) Forecast, by Application 2020 & 2033
- Table 45: United Kingdom Synthetic Graphite Market Revenue (billion) Forecast, by Application 2020 & 2033
- Table 46: United Kingdom Synthetic Graphite Market Volume (K Tons) Forecast, by Application 2020 & 2033
- Table 47: Italy Synthetic Graphite Market Revenue (billion) Forecast, by Application 2020 & 2033
- Table 48: Italy Synthetic Graphite Market Volume (K Tons) Forecast, by Application 2020 & 2033
- Table 49: France Synthetic Graphite Market Revenue (billion) Forecast, by Application 2020 & 2033
- Table 50: France Synthetic Graphite Market Volume (K Tons) Forecast, by Application 2020 & 2033
- Table 51: Russia Synthetic Graphite Market Revenue (billion) Forecast, by Application 2020 & 2033
- Table 52: Russia Synthetic Graphite Market Volume (K Tons) Forecast, by Application 2020 & 2033
- Table 53: Rest of Europe Synthetic Graphite Market Revenue (billion) Forecast, by Application 2020 & 2033
- Table 54: Rest of Europe Synthetic Graphite Market Volume (K Tons) Forecast, by Application 2020 & 2033
- Table 55: Global Synthetic Graphite Market Revenue billion Forecast, by Type 2020 & 2033
- Table 56: Global Synthetic Graphite Market Volume K Tons Forecast, by Type 2020 & 2033
- Table 57: Global Synthetic Graphite Market Revenue billion Forecast, by Application 2020 & 2033
- Table 58: Global Synthetic Graphite Market Volume K Tons Forecast, by Application 2020 & 2033
- Table 59: Global Synthetic Graphite Market Revenue billion Forecast, by Country 2020 & 2033
- Table 60: Global Synthetic Graphite Market Volume K Tons Forecast, by Country 2020 & 2033
- Table 61: Brazil Synthetic Graphite Market Revenue (billion) Forecast, by Application 2020 & 2033
- Table 62: Brazil Synthetic Graphite Market Volume (K Tons) Forecast, by Application 2020 & 2033
- Table 63: Argentina Synthetic Graphite Market Revenue (billion) Forecast, by Application 2020 & 2033
- Table 64: Argentina Synthetic Graphite Market Volume (K Tons) Forecast, by Application 2020 & 2033
- Table 65: Rest of South America Synthetic Graphite Market Revenue (billion) Forecast, by Application 2020 & 2033
- Table 66: Rest of South America Synthetic Graphite Market Volume (K Tons) Forecast, by Application 2020 & 2033
- Table 67: Global Synthetic Graphite Market Revenue billion Forecast, by Type 2020 & 2033
- Table 68: Global Synthetic Graphite Market Volume K Tons Forecast, by Type 2020 & 2033
- Table 69: Global Synthetic Graphite Market Revenue billion Forecast, by Application 2020 & 2033
- Table 70: Global Synthetic Graphite Market Volume K Tons Forecast, by Application 2020 & 2033
- Table 71: Global Synthetic Graphite Market Revenue billion Forecast, by Country 2020 & 2033
- Table 72: Global Synthetic Graphite Market Volume K Tons Forecast, by Country 2020 & 2033
- Table 73: Saudi Arabia Synthetic Graphite Market Revenue (billion) Forecast, by Application 2020 & 2033
- Table 74: Saudi Arabia Synthetic Graphite Market Volume (K Tons) Forecast, by Application 2020 & 2033
- Table 75: South Africa Synthetic Graphite Market Revenue (billion) Forecast, by Application 2020 & 2033
- Table 76: South Africa Synthetic Graphite Market Volume (K Tons) Forecast, by Application 2020 & 2033
- Table 77: Rest of Middle East and Africa Synthetic Graphite Market Revenue (billion) Forecast, by Application 2020 & 2033
- Table 78: Rest of Middle East and Africa Synthetic Graphite Market Volume (K Tons) Forecast, by Application 2020 & 2033
Frequently Asked Questions
1. What is the projected Compound Annual Growth Rate (CAGR) of the Synthetic Graphite Market?
The projected CAGR is approximately 15.1%.
2. Which companies are prominent players in the Synthetic Graphite Market?
Key companies in the market include Mersen Property, Asbury Carbons, Shenzhen Sinuo Industrial Development Co Ltd, Resonac Holdings Corporation (Showa Denko KK), Shamokin Carbons, Mitsubishi Chemical Corporation, Nippon Carbon Co Ltd, Jiangxi Zichen Technology Co Ltd, Tokai Cobex GmbH, GrafTech International, BTR New Materials Group Co Ltd, Imerys, Shanghai Shanshan Technology Co Ltd, Graphit Kropfmhl GmbH, Graphite India Limited, Lianyungang Jinli Carbon Co Ltd.
3. What are the main segments of the Synthetic Graphite Market?
The market segments include Type, Application.
4. Can you provide details about the market size?
The market size is estimated to be USD 15.67 billion as of 2022.
5. What are some drivers contributing to market growth?
Increasing Demand for Electric Vehicles; Growing Utilization of Electric ARC Furnace Process for Steel Production.
6. What are the notable trends driving market growth?
Metallurgy Segment to Drive the Market.
7. Are there any restraints impacting market growth?
Stringent Environmental Regulations; Decreasing Production of Steel.
8. Can you provide examples of recent developments in the market?
October 2022: Imerys Imerys Graphite & Carbon Company announced the launch of a landmark lithium exploitation project ('the EMILI Project'). It may significantly reduce the need to import lithium and aid in producing nearly 700,000 electric vehicle batteries annually.
9. What pricing options are available for accessing the report?
Pricing options include single-user, multi-user, and enterprise licenses priced at USD 4750, USD 5250, and USD 8750 respectively.
10. Is the market size provided in terms of value or volume?
The market size is provided in terms of value, measured in billion and volume, measured in K Tons.
11. Are there any specific market keywords associated with the report?
Yes, the market keyword associated with the report is "Synthetic Graphite Market," which aids in identifying and referencing the specific market segment covered.
12. How do I determine which pricing option suits my needs best?
The pricing options vary based on user requirements and access needs. Individual users may opt for single-user licenses, while businesses requiring broader access may choose multi-user or enterprise licenses for cost-effective access to the report.
13. Are there any additional resources or data provided in the Synthetic Graphite Market report?
While the report offers comprehensive insights, it's advisable to review the specific contents or supplementary materials provided to ascertain if additional resources or data are available.
14. How can I stay updated on further developments or reports in the Synthetic Graphite Market?
To stay informed about further developments, trends, and reports in the Synthetic Graphite Market, consider subscribing to industry newsletters, following relevant companies and organizations, or regularly checking reputable industry news sources and publications.
Methodology
Step 1 - Identification of Relevant Samples Size from Population Database


Step 2 - Approaches for Defining Global Market Size (Value, Volume* & Price*)

Note*: In applicable scenarios
Step 3 - Data Sources
Primary Research
- Web Analytics
- Survey Reports
- Research Institute
- Latest Research Reports
- Opinion Leaders
Secondary Research
- Annual Reports
- White Paper
- Latest Press Release
- Industry Association
- Paid Database
- Investor Presentations

Step 4 - Data Triangulation
Involves using different sources of information in order to increase the validity of a study
These sources are likely to be stakeholders in a program - participants, other researchers, program staff, other community members, and so on.
Then we put all data in single framework & apply various statistical tools to find out the dynamic on the market.
During the analysis stage, feedback from the stakeholder groups would be compared to determine areas of agreement as well as areas of divergence