

Key Insights
The global Titanium Dioxide (TiO2) market, valued at approximately $19.06 billion in 2025, is projected for significant expansion, exhibiting a Compound Annual Growth Rate (CAGR) of 7.1% from 2025 to 2033. This growth is propelled by escalating demand across key sectors. The construction and automotive industries' robust expansion drives substantial TiO2 consumption in paints and coatings. The widespread adoption of plastics in various applications, leveraging TiO2 for pigmentation and opacification, further fuels market growth. The paper and pulp industry's consistent requirement for TiO2 to enhance brightness and opacity also contributes to demand. Additionally, the cosmetics sector's utilization of TiO2 in sunscreens and personal care products bolsters its market presence. Emerging applications in textiles and leather are poised to deliver incremental growth. Key market restraints include volatile raw material prices, stringent environmental regulations governing TiO2 production and disposal, and health concerns associated with specific TiO2 forms. Nevertheless, advancements in sustainable production methods and the exploration of novel applications are expected to mitigate these challenges and foster sustained market expansion. The market is segmented by grade (rutile and anatase) and application (paints and coatings, plastics, paper and pulp, cosmetics, and others). Leading companies such as INEOS, Evonik Industries AG, and Tronox Holdings PLC are actively scaling production and developing advanced TiO2 solutions to meet evolving market needs. Regional growth is anticipated to be led by Asia-Pacific and North America, attributed to their strong economic development and extensive industrial activity.
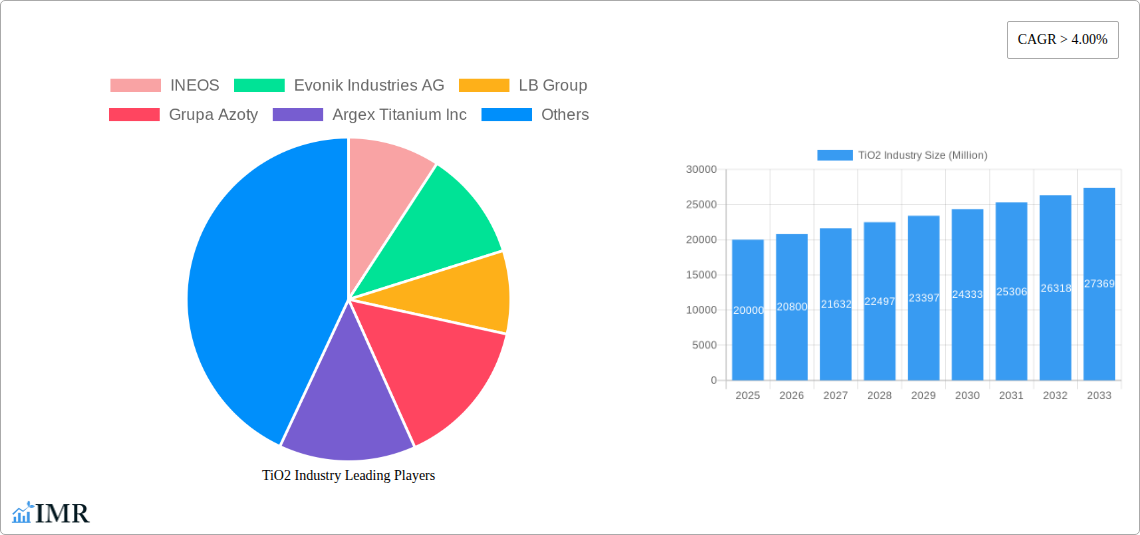
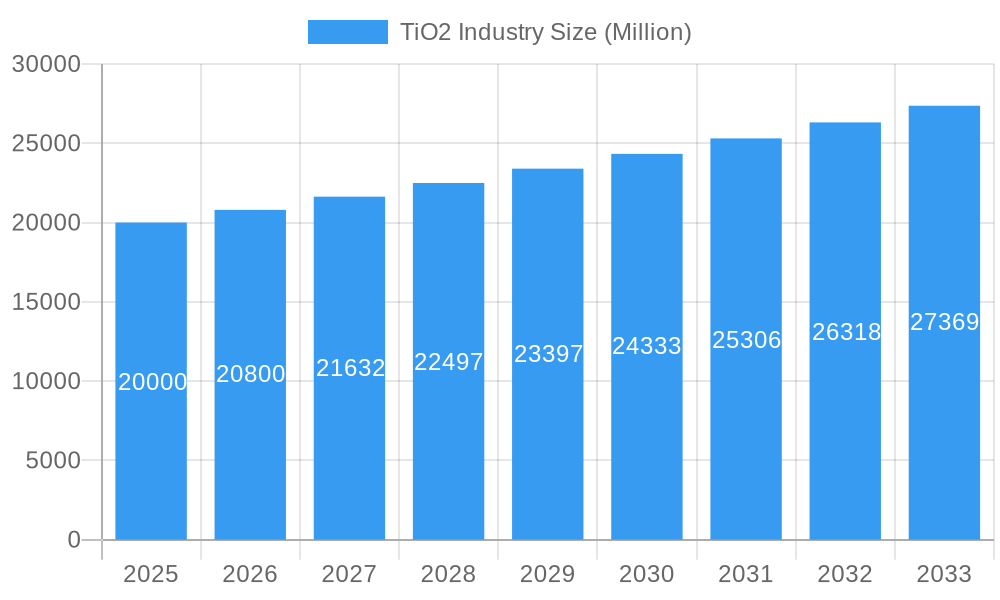
TiO2 Industry Market Size (In Billion)
Competitive intensity within the TiO2 sector remains high, with industry leaders prioritizing expansion and innovation. Consolidation and strategic mergers and acquisitions underscore the market's competitive landscape and future growth potential. Diversified applications and a steadfast focus on sustainable, eco-friendly production techniques will continue to shape market dynamics. Companies are significantly investing in research and development to enhance TiO2 properties, minimize environmental impact, and pioneer new applications. This commitment to technological advancement and the development of high-performance TiO2 variants tailored to specific industry requirements are crucial drivers of overall market growth. The future trajectory of the TiO2 market will be influenced by global economic conditions, sustainability initiatives within end-use industries, and ongoing technological innovations in TiO2 production and application development.
TiO2 Industry Company Market Share
TiO2 Industry Market Report: 2019-2033
This comprehensive report provides an in-depth analysis of the TiO2 industry, encompassing market dynamics, growth trends, regional performance, product landscape, key players, and future outlook. The study period covers 2019-2033, with 2025 as the base and estimated year. This report is invaluable for industry professionals, investors, and strategic decision-makers seeking to navigate the complexities of this dynamic market. We explore both parent markets (pigments and coatings) and child markets (specific applications within those sectors).
TiO2 Industry Market Dynamics & Structure
The global TiO2 market, valued at xx Million in 2024, is characterized by moderate concentration, with key players like INEOS, Evonik Industries AG, LB Group, Grupa Azoty, Argex Titanium Inc, Kemipex, Venator Materials PLC, TAYCA, The Chemours Company, Tronox Holdings PLC, Precheza, KRONOS Worldwide Inc, and The Kish Company Inc. holding significant market share. Market concentration is expected to remain relatively stable in the forecast period (2025-2033). Technological innovation, primarily in production efficiency and pigment properties, is a key driver. Stringent environmental regulations and the search for sustainable alternatives are shaping the industry landscape. Competitive substitutes, such as zinc oxide and alternative pigments, pose a moderate threat.
- Market Concentration: Moderately concentrated, with top 5 players holding approximately xx% market share in 2024.
- Technological Innovation: Focus on improving pigment brightness, durability, and reducing production costs.
- Regulatory Framework: Increasingly stringent environmental regulations impacting production processes and waste management.
- Competitive Substitutes: Zinc oxide, other inorganic pigments present a moderate competitive threat.
- M&A Activity: Moderate M&A activity observed in recent years, driven by consolidation and expansion strategies (xx deals in 2019-2024).
- End-User Demographics: Predominantly industrial, with key sectors including paints & coatings, plastics, and paper & pulp.
TiO2 Industry Growth Trends & Insights
The global TiO2 market is projected to witness a CAGR of xx% during the forecast period (2025-2033), driven by robust growth in end-use sectors like construction, automotive, and packaging. Increased demand from developing economies, coupled with technological advancements leading to improved product performance and cost-efficiency, will fuel market expansion. The adoption rate of TiO2 in high-growth applications like specialized coatings and high-performance plastics is increasing. Shifts in consumer preferences towards sustainable and eco-friendly products are impacting product development and demand. Market penetration in emerging applications like advanced batteries and solar cells is anticipated to accelerate.
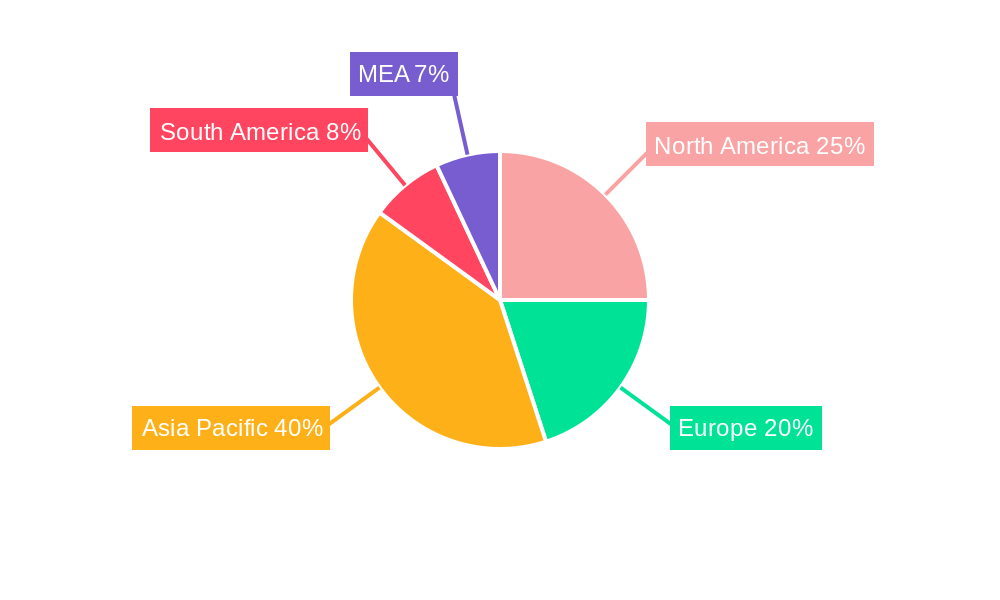
Dominant Regions, Countries, or Segments in TiO2 Industry
Asia Pacific is projected to remain the dominant region, driven by strong growth in China and India. The paints and coatings segment is the largest application, followed by plastics and paper & pulp. Within grades, Rutile maintains a larger market share compared to Anatase due to its superior properties.
- Key Drivers (Asia Pacific): Rapid industrialization, infrastructure development, rising disposable incomes.
- Key Drivers (Paints & Coatings): Growth in construction, automotive, and other sectors.
- Key Drivers (Rutile Grade): Superior brightness, opacity, and weather resistance.
- Market Share: Asia Pacific holds xx% market share in 2024; Paints & Coatings holds xx%; Rutile grade holds xx%.
- Growth Potential: High growth potential for TiO2 in specialized applications and emerging markets.
TiO2 Industry Product Landscape
TiO2 pigments are primarily offered in two grades: Rutile and Anatase. Recent innovations focus on enhancing particle size distribution, surface treatment, and dispersibility to improve pigment performance. Manufacturers are actively developing high-performance TiO2 with enhanced UV resistance, brightness, and durability, catering to the demands of various applications. Unique selling propositions often revolve around superior whiteness, opacity, and cost-effectiveness.
Key Drivers, Barriers & Challenges in TiO2 Industry
Key Drivers:
- Growing demand from key end-use industries (e.g., construction, automotive).
- Technological advancements leading to improved pigment properties.
- Economic growth in developing economies.
Key Challenges:
- Fluctuations in raw material prices (e.g., ilmenite, titanium slag).
- Stringent environmental regulations.
- Intense competition from existing and new players.
- Supply chain disruptions, impacting availability and cost.
Emerging Opportunities in TiO2 Industry
- Growing demand for high-performance TiO2 in specialized applications (e.g., solar cells, advanced batteries).
- Development of sustainable and eco-friendly TiO2 production processes.
- Expansion into untapped markets in developing economies.
Growth Accelerators in the TiO2 Industry
Technological advancements in TiO2 synthesis, coupled with strategic partnerships and collaborations, are key growth accelerators. Expanding into new applications and markets, especially in developing economies, presents significant opportunities. Sustainable production methods are becoming increasingly important, attracting investment and driving market growth.
Key Players Shaping the TiO2 Industry Market
- INEOS
- Evonik Industries AG
- LB Group
- Grupa Azoty
- Argex Titanium Inc
- Kemipex
- Venator Materials PLC
- TAYCA
- The Chemours Company
- Tronox Holdings PLC
- Precheza
- KRONOS Worldwide Inc
- The Kish Company Inc
Notable Milestones in TiO2 Industry Sector
- August 2022: Chemours commenced mining at its new Florida sand mine, boosting TiO2 production capacity.
- January 2022: LB Group invested CNY 1 billion (USD 157.6 million) in a new 200ktpa TiO2 pigment finishing plant in Xiangyang.
In-Depth TiO2 Industry Market Outlook
The TiO2 market is poised for sustained growth, driven by technological innovation, increasing demand from key end-use industries, and expansion into new markets. Strategic partnerships and investments in sustainable production technologies will further shape the industry landscape. The market presents significant opportunities for companies to capitalize on emerging trends and capitalize on the growing demand for high-performance and eco-friendly TiO2 pigments.
TiO2 Industry Segmentation
-
1. Grade
- 1.1. Rutile
- 1.2. Anatase
-
2. Application
- 2.1. Paints and Coatings
- 2.2. Plastics
- 2.3. Paper and Pulp
- 2.4. Cosmetics
- 2.5. Other Applications (Leather, Textiles)
TiO2 Industry Segmentation By Geography
-
1. Asia Pacific
- 1.1. China
- 1.2. India
- 1.3. Japan
- 1.4. South Korea
- 1.5. Rest of Asia Pacific
-
2. North America
- 2.1. United States
- 2.2. Canada
- 2.3. Mexico
-
3. Europe
- 3.1. Germany
- 3.2. United Kingdom
- 3.3. France
- 3.4. Italy
- 3.5. Rest of Europe
-
4. South America
- 4.1. Brazil
- 4.2. Argentina
- 4.3. Rest of South America
-
5. Middle East and Africa
- 5.1. Saudi Arabia
- 5.2. South Africa
- 5.3. Rest of Middle East and Africa
TiO2 Industry Regional Market Share
Geographic Coverage of TiO2 Industry
TiO2 Industry REPORT HIGHLIGHTS
| Aspects | Details |
|---|---|
| Study Period | 2020-2034 |
| Base Year | 2025 |
| Estimated Year | 2026 |
| Forecast Period | 2026-2034 |
| Historical Period | 2020-2025 |
| Growth Rate | CAGR of 7.1% from 2020-2034 |
| Segmentation |
|
Table of Contents
- 1. Introduction
- 1.1. Research Scope
- 1.2. Market Segmentation
- 1.3. Research Objective
- 1.4. Definitions and Assumptions
- 2. Executive Summary
- 2.1. Market Snapshot
- 3. Market Dynamics
- 3.1. Market Drivers
- 3.2. Market Restrains
- 3.3. Market Trends
- 3.4. Market Opportunities
- 4. Market Factor Analysis
- 4.1. Porters Five Forces
- 4.1.1. Bargaining Power of Suppliers
- 4.1.2. Bargaining Power of Buyers
- 4.1.3. Threat of New Entrants
- 4.1.4. Threat of Substitutes
- 4.1.5. Competitive Rivalry
- 4.2. PESTEL analysis
- 4.3. BCG Analysis
- 4.3.1. Stars (High Growth, High Market Share)
- 4.3.2. Cash Cows (Low Growth, High Market Share)
- 4.3.3. Question Mark (High Growth, Low Market Share)
- 4.3.4. Dogs (Low Growth, Low Market Share)
- 4.4. Ansoff Matrix Analysis
- 4.5. Supply Chain Analysis
- 4.6. Regulatory Landscape
- 4.7. Current Market Potential and Opportunity Assessment (TAM–SAM–SOM Framework)
- 4.8. IMR Analyst Note
- 4.1. Porters Five Forces
- 5. Market Analysis, Insights and Forecast 2021-2033
- 5.1. Market Analysis, Insights and Forecast - by Grade
- 5.1.1. Rutile
- 5.1.2. Anatase
- 5.2. Market Analysis, Insights and Forecast - by Application
- 5.2.1. Paints and Coatings
- 5.2.2. Plastics
- 5.2.3. Paper and Pulp
- 5.2.4. Cosmetics
- 5.2.5. Other Applications (Leather, Textiles)
- 5.3. Market Analysis, Insights and Forecast - by Region
- 5.3.1. Asia Pacific
- 5.3.2. North America
- 5.3.3. Europe
- 5.3.4. South America
- 5.3.5. Middle East and Africa
- 5.1. Market Analysis, Insights and Forecast - by Grade
- 6. Global TiO2 Industry Analysis, Insights and Forecast, 2021-2033
- 6.1. Market Analysis, Insights and Forecast - by Grade
- 6.1.1. Rutile
- 6.1.2. Anatase
- 6.2. Market Analysis, Insights and Forecast - by Application
- 6.2.1. Paints and Coatings
- 6.2.2. Plastics
- 6.2.3. Paper and Pulp
- 6.2.4. Cosmetics
- 6.2.5. Other Applications (Leather, Textiles)
- 6.1. Market Analysis, Insights and Forecast - by Grade
- 7. Asia Pacific TiO2 Industry Analysis, Insights and Forecast, 2020-2032
- 7.1. Market Analysis, Insights and Forecast - by Grade
- 7.1.1. Rutile
- 7.1.2. Anatase
- 7.2. Market Analysis, Insights and Forecast - by Application
- 7.2.1. Paints and Coatings
- 7.2.2. Plastics
- 7.2.3. Paper and Pulp
- 7.2.4. Cosmetics
- 7.2.5. Other Applications (Leather, Textiles)
- 7.1. Market Analysis, Insights and Forecast - by Grade
- 8. North America TiO2 Industry Analysis, Insights and Forecast, 2020-2032
- 8.1. Market Analysis, Insights and Forecast - by Grade
- 8.1.1. Rutile
- 8.1.2. Anatase
- 8.2. Market Analysis, Insights and Forecast - by Application
- 8.2.1. Paints and Coatings
- 8.2.2. Plastics
- 8.2.3. Paper and Pulp
- 8.2.4. Cosmetics
- 8.2.5. Other Applications (Leather, Textiles)
- 8.1. Market Analysis, Insights and Forecast - by Grade
- 9. Europe TiO2 Industry Analysis, Insights and Forecast, 2020-2032
- 9.1. Market Analysis, Insights and Forecast - by Grade
- 9.1.1. Rutile
- 9.1.2. Anatase
- 9.2. Market Analysis, Insights and Forecast - by Application
- 9.2.1. Paints and Coatings
- 9.2.2. Plastics
- 9.2.3. Paper and Pulp
- 9.2.4. Cosmetics
- 9.2.5. Other Applications (Leather, Textiles)
- 9.1. Market Analysis, Insights and Forecast - by Grade
- 10. South America TiO2 Industry Analysis, Insights and Forecast, 2020-2032
- 10.1. Market Analysis, Insights and Forecast - by Grade
- 10.1.1. Rutile
- 10.1.2. Anatase
- 10.2. Market Analysis, Insights and Forecast - by Application
- 10.2.1. Paints and Coatings
- 10.2.2. Plastics
- 10.2.3. Paper and Pulp
- 10.2.4. Cosmetics
- 10.2.5. Other Applications (Leather, Textiles)
- 10.1. Market Analysis, Insights and Forecast - by Grade
- 11. Middle East and Africa TiO2 Industry Analysis, Insights and Forecast, 2020-2032
- 11.1. Market Analysis, Insights and Forecast - by Grade
- 11.1.1. Rutile
- 11.1.2. Anatase
- 11.2. Market Analysis, Insights and Forecast - by Application
- 11.2.1. Paints and Coatings
- 11.2.2. Plastics
- 11.2.3. Paper and Pulp
- 11.2.4. Cosmetics
- 11.2.5. Other Applications (Leather, Textiles)
- 11.1. Market Analysis, Insights and Forecast - by Grade
- 12. Competitive Analysis
- 12.1. Company Profiles
- 12.1.1 INEOS
- 12.1.1.1. Company Overview
- 12.1.1.2. Products
- 12.1.1.3. Company Financials
- 12.1.1.4. SWOT Analysis
- 12.1.2 Evonik Industries AG
- 12.1.2.1. Company Overview
- 12.1.2.2. Products
- 12.1.2.3. Company Financials
- 12.1.2.4. SWOT Analysis
- 12.1.3 LB Group
- 12.1.3.1. Company Overview
- 12.1.3.2. Products
- 12.1.3.3. Company Financials
- 12.1.3.4. SWOT Analysis
- 12.1.4 Grupa Azoty
- 12.1.4.1. Company Overview
- 12.1.4.2. Products
- 12.1.4.3. Company Financials
- 12.1.4.4. SWOT Analysis
- 12.1.5 Argex Titanium Inc
- 12.1.5.1. Company Overview
- 12.1.5.2. Products
- 12.1.5.3. Company Financials
- 12.1.5.4. SWOT Analysis
- 12.1.6 Kemipex
- 12.1.6.1. Company Overview
- 12.1.6.2. Products
- 12.1.6.3. Company Financials
- 12.1.6.4. SWOT Analysis
- 12.1.7 Venator Materials PLC
- 12.1.7.1. Company Overview
- 12.1.7.2. Products
- 12.1.7.3. Company Financials
- 12.1.7.4. SWOT Analysis
- 12.1.8 TAYCA
- 12.1.8.1. Company Overview
- 12.1.8.2. Products
- 12.1.8.3. Company Financials
- 12.1.8.4. SWOT Analysis
- 12.1.9 The Chemours Company
- 12.1.9.1. Company Overview
- 12.1.9.2. Products
- 12.1.9.3. Company Financials
- 12.1.9.4. SWOT Analysis
- 12.1.10 Tronox Holdings PLC
- 12.1.10.1. Company Overview
- 12.1.10.2. Products
- 12.1.10.3. Company Financials
- 12.1.10.4. SWOT Analysis
- 12.1.11 Precheza
- 12.1.11.1. Company Overview
- 12.1.11.2. Products
- 12.1.11.3. Company Financials
- 12.1.11.4. SWOT Analysis
- 12.1.12 KRONOS Worldwide Inc
- 12.1.12.1. Company Overview
- 12.1.12.2. Products
- 12.1.12.3. Company Financials
- 12.1.12.4. SWOT Analysis
- 12.1.13 The Kish Company Inc
- 12.1.13.1. Company Overview
- 12.1.13.2. Products
- 12.1.13.3. Company Financials
- 12.1.13.4. SWOT Analysis
- 12.1.1 INEOS
- 12.2. Market Entropy
- 12.2.1 Company's Key Areas Served
- 12.2.2 Recent Developments
- 12.3. Company Market Share Analysis 2025
- 12.3.1 Top 5 Companies Market Share Analysis
- 12.3.2 Top 3 Companies Market Share Analysis
- 12.4. List of Potential Customers
- 13. Research Methodology
List of Figures
- Figure 1: Global TiO2 Industry Revenue Breakdown (billion, %) by Region 2025 & 2033
- Figure 2: Global TiO2 Industry Volume Breakdown (K Tons, %) by Region 2025 & 2033
- Figure 3: Asia Pacific TiO2 Industry Revenue (billion), by Grade 2025 & 2033
- Figure 4: Asia Pacific TiO2 Industry Volume (K Tons), by Grade 2025 & 2033
- Figure 5: Asia Pacific TiO2 Industry Revenue Share (%), by Grade 2025 & 2033
- Figure 6: Asia Pacific TiO2 Industry Volume Share (%), by Grade 2025 & 2033
- Figure 7: Asia Pacific TiO2 Industry Revenue (billion), by Application 2025 & 2033
- Figure 8: Asia Pacific TiO2 Industry Volume (K Tons), by Application 2025 & 2033
- Figure 9: Asia Pacific TiO2 Industry Revenue Share (%), by Application 2025 & 2033
- Figure 10: Asia Pacific TiO2 Industry Volume Share (%), by Application 2025 & 2033
- Figure 11: Asia Pacific TiO2 Industry Revenue (billion), by Country 2025 & 2033
- Figure 12: Asia Pacific TiO2 Industry Volume (K Tons), by Country 2025 & 2033
- Figure 13: Asia Pacific TiO2 Industry Revenue Share (%), by Country 2025 & 2033
- Figure 14: Asia Pacific TiO2 Industry Volume Share (%), by Country 2025 & 2033
- Figure 15: North America TiO2 Industry Revenue (billion), by Grade 2025 & 2033
- Figure 16: North America TiO2 Industry Volume (K Tons), by Grade 2025 & 2033
- Figure 17: North America TiO2 Industry Revenue Share (%), by Grade 2025 & 2033
- Figure 18: North America TiO2 Industry Volume Share (%), by Grade 2025 & 2033
- Figure 19: North America TiO2 Industry Revenue (billion), by Application 2025 & 2033
- Figure 20: North America TiO2 Industry Volume (K Tons), by Application 2025 & 2033
- Figure 21: North America TiO2 Industry Revenue Share (%), by Application 2025 & 2033
- Figure 22: North America TiO2 Industry Volume Share (%), by Application 2025 & 2033
- Figure 23: North America TiO2 Industry Revenue (billion), by Country 2025 & 2033
- Figure 24: North America TiO2 Industry Volume (K Tons), by Country 2025 & 2033
- Figure 25: North America TiO2 Industry Revenue Share (%), by Country 2025 & 2033
- Figure 26: North America TiO2 Industry Volume Share (%), by Country 2025 & 2033
- Figure 27: Europe TiO2 Industry Revenue (billion), by Grade 2025 & 2033
- Figure 28: Europe TiO2 Industry Volume (K Tons), by Grade 2025 & 2033
- Figure 29: Europe TiO2 Industry Revenue Share (%), by Grade 2025 & 2033
- Figure 30: Europe TiO2 Industry Volume Share (%), by Grade 2025 & 2033
- Figure 31: Europe TiO2 Industry Revenue (billion), by Application 2025 & 2033
- Figure 32: Europe TiO2 Industry Volume (K Tons), by Application 2025 & 2033
- Figure 33: Europe TiO2 Industry Revenue Share (%), by Application 2025 & 2033
- Figure 34: Europe TiO2 Industry Volume Share (%), by Application 2025 & 2033
- Figure 35: Europe TiO2 Industry Revenue (billion), by Country 2025 & 2033
- Figure 36: Europe TiO2 Industry Volume (K Tons), by Country 2025 & 2033
- Figure 37: Europe TiO2 Industry Revenue Share (%), by Country 2025 & 2033
- Figure 38: Europe TiO2 Industry Volume Share (%), by Country 2025 & 2033
- Figure 39: South America TiO2 Industry Revenue (billion), by Grade 2025 & 2033
- Figure 40: South America TiO2 Industry Volume (K Tons), by Grade 2025 & 2033
- Figure 41: South America TiO2 Industry Revenue Share (%), by Grade 2025 & 2033
- Figure 42: South America TiO2 Industry Volume Share (%), by Grade 2025 & 2033
- Figure 43: South America TiO2 Industry Revenue (billion), by Application 2025 & 2033
- Figure 44: South America TiO2 Industry Volume (K Tons), by Application 2025 & 2033
- Figure 45: South America TiO2 Industry Revenue Share (%), by Application 2025 & 2033
- Figure 46: South America TiO2 Industry Volume Share (%), by Application 2025 & 2033
- Figure 47: South America TiO2 Industry Revenue (billion), by Country 2025 & 2033
- Figure 48: South America TiO2 Industry Volume (K Tons), by Country 2025 & 2033
- Figure 49: South America TiO2 Industry Revenue Share (%), by Country 2025 & 2033
- Figure 50: South America TiO2 Industry Volume Share (%), by Country 2025 & 2033
- Figure 51: Middle East and Africa TiO2 Industry Revenue (billion), by Grade 2025 & 2033
- Figure 52: Middle East and Africa TiO2 Industry Volume (K Tons), by Grade 2025 & 2033
- Figure 53: Middle East and Africa TiO2 Industry Revenue Share (%), by Grade 2025 & 2033
- Figure 54: Middle East and Africa TiO2 Industry Volume Share (%), by Grade 2025 & 2033
- Figure 55: Middle East and Africa TiO2 Industry Revenue (billion), by Application 2025 & 2033
- Figure 56: Middle East and Africa TiO2 Industry Volume (K Tons), by Application 2025 & 2033
- Figure 57: Middle East and Africa TiO2 Industry Revenue Share (%), by Application 2025 & 2033
- Figure 58: Middle East and Africa TiO2 Industry Volume Share (%), by Application 2025 & 2033
- Figure 59: Middle East and Africa TiO2 Industry Revenue (billion), by Country 2025 & 2033
- Figure 60: Middle East and Africa TiO2 Industry Volume (K Tons), by Country 2025 & 2033
- Figure 61: Middle East and Africa TiO2 Industry Revenue Share (%), by Country 2025 & 2033
- Figure 62: Middle East and Africa TiO2 Industry Volume Share (%), by Country 2025 & 2033
List of Tables
- Table 1: Global TiO2 Industry Revenue billion Forecast, by Grade 2020 & 2033
- Table 2: Global TiO2 Industry Volume K Tons Forecast, by Grade 2020 & 2033
- Table 3: Global TiO2 Industry Revenue billion Forecast, by Application 2020 & 2033
- Table 4: Global TiO2 Industry Volume K Tons Forecast, by Application 2020 & 2033
- Table 5: Global TiO2 Industry Revenue billion Forecast, by Region 2020 & 2033
- Table 6: Global TiO2 Industry Volume K Tons Forecast, by Region 2020 & 2033
- Table 7: Global TiO2 Industry Revenue billion Forecast, by Grade 2020 & 2033
- Table 8: Global TiO2 Industry Volume K Tons Forecast, by Grade 2020 & 2033
- Table 9: Global TiO2 Industry Revenue billion Forecast, by Application 2020 & 2033
- Table 10: Global TiO2 Industry Volume K Tons Forecast, by Application 2020 & 2033
- Table 11: Global TiO2 Industry Revenue billion Forecast, by Country 2020 & 2033
- Table 12: Global TiO2 Industry Volume K Tons Forecast, by Country 2020 & 2033
- Table 13: China TiO2 Industry Revenue (billion) Forecast, by Application 2020 & 2033
- Table 14: China TiO2 Industry Volume (K Tons) Forecast, by Application 2020 & 2033
- Table 15: India TiO2 Industry Revenue (billion) Forecast, by Application 2020 & 2033
- Table 16: India TiO2 Industry Volume (K Tons) Forecast, by Application 2020 & 2033
- Table 17: Japan TiO2 Industry Revenue (billion) Forecast, by Application 2020 & 2033
- Table 18: Japan TiO2 Industry Volume (K Tons) Forecast, by Application 2020 & 2033
- Table 19: South Korea TiO2 Industry Revenue (billion) Forecast, by Application 2020 & 2033
- Table 20: South Korea TiO2 Industry Volume (K Tons) Forecast, by Application 2020 & 2033
- Table 21: Rest of Asia Pacific TiO2 Industry Revenue (billion) Forecast, by Application 2020 & 2033
- Table 22: Rest of Asia Pacific TiO2 Industry Volume (K Tons) Forecast, by Application 2020 & 2033
- Table 23: Global TiO2 Industry Revenue billion Forecast, by Grade 2020 & 2033
- Table 24: Global TiO2 Industry Volume K Tons Forecast, by Grade 2020 & 2033
- Table 25: Global TiO2 Industry Revenue billion Forecast, by Application 2020 & 2033
- Table 26: Global TiO2 Industry Volume K Tons Forecast, by Application 2020 & 2033
- Table 27: Global TiO2 Industry Revenue billion Forecast, by Country 2020 & 2033
- Table 28: Global TiO2 Industry Volume K Tons Forecast, by Country 2020 & 2033
- Table 29: United States TiO2 Industry Revenue (billion) Forecast, by Application 2020 & 2033
- Table 30: United States TiO2 Industry Volume (K Tons) Forecast, by Application 2020 & 2033
- Table 31: Canada TiO2 Industry Revenue (billion) Forecast, by Application 2020 & 2033
- Table 32: Canada TiO2 Industry Volume (K Tons) Forecast, by Application 2020 & 2033
- Table 33: Mexico TiO2 Industry Revenue (billion) Forecast, by Application 2020 & 2033
- Table 34: Mexico TiO2 Industry Volume (K Tons) Forecast, by Application 2020 & 2033
- Table 35: Global TiO2 Industry Revenue billion Forecast, by Grade 2020 & 2033
- Table 36: Global TiO2 Industry Volume K Tons Forecast, by Grade 2020 & 2033
- Table 37: Global TiO2 Industry Revenue billion Forecast, by Application 2020 & 2033
- Table 38: Global TiO2 Industry Volume K Tons Forecast, by Application 2020 & 2033
- Table 39: Global TiO2 Industry Revenue billion Forecast, by Country 2020 & 2033
- Table 40: Global TiO2 Industry Volume K Tons Forecast, by Country 2020 & 2033
- Table 41: Germany TiO2 Industry Revenue (billion) Forecast, by Application 2020 & 2033
- Table 42: Germany TiO2 Industry Volume (K Tons) Forecast, by Application 2020 & 2033
- Table 43: United Kingdom TiO2 Industry Revenue (billion) Forecast, by Application 2020 & 2033
- Table 44: United Kingdom TiO2 Industry Volume (K Tons) Forecast, by Application 2020 & 2033
- Table 45: France TiO2 Industry Revenue (billion) Forecast, by Application 2020 & 2033
- Table 46: France TiO2 Industry Volume (K Tons) Forecast, by Application 2020 & 2033
- Table 47: Italy TiO2 Industry Revenue (billion) Forecast, by Application 2020 & 2033
- Table 48: Italy TiO2 Industry Volume (K Tons) Forecast, by Application 2020 & 2033
- Table 49: Rest of Europe TiO2 Industry Revenue (billion) Forecast, by Application 2020 & 2033
- Table 50: Rest of Europe TiO2 Industry Volume (K Tons) Forecast, by Application 2020 & 2033
- Table 51: Global TiO2 Industry Revenue billion Forecast, by Grade 2020 & 2033
- Table 52: Global TiO2 Industry Volume K Tons Forecast, by Grade 2020 & 2033
- Table 53: Global TiO2 Industry Revenue billion Forecast, by Application 2020 & 2033
- Table 54: Global TiO2 Industry Volume K Tons Forecast, by Application 2020 & 2033
- Table 55: Global TiO2 Industry Revenue billion Forecast, by Country 2020 & 2033
- Table 56: Global TiO2 Industry Volume K Tons Forecast, by Country 2020 & 2033
- Table 57: Brazil TiO2 Industry Revenue (billion) Forecast, by Application 2020 & 2033
- Table 58: Brazil TiO2 Industry Volume (K Tons) Forecast, by Application 2020 & 2033
- Table 59: Argentina TiO2 Industry Revenue (billion) Forecast, by Application 2020 & 2033
- Table 60: Argentina TiO2 Industry Volume (K Tons) Forecast, by Application 2020 & 2033
- Table 61: Rest of South America TiO2 Industry Revenue (billion) Forecast, by Application 2020 & 2033
- Table 62: Rest of South America TiO2 Industry Volume (K Tons) Forecast, by Application 2020 & 2033
- Table 63: Global TiO2 Industry Revenue billion Forecast, by Grade 2020 & 2033
- Table 64: Global TiO2 Industry Volume K Tons Forecast, by Grade 2020 & 2033
- Table 65: Global TiO2 Industry Revenue billion Forecast, by Application 2020 & 2033
- Table 66: Global TiO2 Industry Volume K Tons Forecast, by Application 2020 & 2033
- Table 67: Global TiO2 Industry Revenue billion Forecast, by Country 2020 & 2033
- Table 68: Global TiO2 Industry Volume K Tons Forecast, by Country 2020 & 2033
- Table 69: Saudi Arabia TiO2 Industry Revenue (billion) Forecast, by Application 2020 & 2033
- Table 70: Saudi Arabia TiO2 Industry Volume (K Tons) Forecast, by Application 2020 & 2033
- Table 71: South Africa TiO2 Industry Revenue (billion) Forecast, by Application 2020 & 2033
- Table 72: South Africa TiO2 Industry Volume (K Tons) Forecast, by Application 2020 & 2033
- Table 73: Rest of Middle East and Africa TiO2 Industry Revenue (billion) Forecast, by Application 2020 & 2033
- Table 74: Rest of Middle East and Africa TiO2 Industry Volume (K Tons) Forecast, by Application 2020 & 2033
Frequently Asked Questions
1. What is the projected Compound Annual Growth Rate (CAGR) of the TiO2 Industry?
The projected CAGR is approximately 7.1%.
2. Which companies are prominent players in the TiO2 Industry?
Key companies in the market include INEOS, Evonik Industries AG, LB Group, Grupa Azoty, Argex Titanium Inc, Kemipex, Venator Materials PLC, TAYCA, The Chemours Company, Tronox Holdings PLC, Precheza, KRONOS Worldwide Inc, The Kish Company Inc.
3. What are the main segments of the TiO2 Industry?
The market segments include Grade, Application.
4. Can you provide details about the market size?
The market size is estimated to be USD 19.06 billion as of 2022.
5. What are some drivers contributing to market growth?
Rapidly Increasing Demand for Paints and Coatings; Other Drivers.
6. What are the notable trends driving market growth?
Paints and Coatings Segment is Expected to Dominate the Market.
7. Are there any restraints impacting market growth?
Toxicity and Stringent Environmental Policies of Titanium Dioxide; Other Restraints.
8. Can you provide examples of recent developments in the market?
In August 2022, Chemours started mining at its newest sand mine in Florida, which will increase the company's titanium oxide production. Chemours will get ilmenite from the mine, which will be used in their chloride-based TiO2 synthesis process. The site's mining life should be eight years.
9. What pricing options are available for accessing the report?
Pricing options include single-user, multi-user, and enterprise licenses priced at USD 4750, USD 5250, and USD 8750 respectively.
10. Is the market size provided in terms of value or volume?
The market size is provided in terms of value, measured in billion and volume, measured in K Tons.
11. Are there any specific market keywords associated with the report?
Yes, the market keyword associated with the report is "TiO2 Industry," which aids in identifying and referencing the specific market segment covered.
12. How do I determine which pricing option suits my needs best?
The pricing options vary based on user requirements and access needs. Individual users may opt for single-user licenses, while businesses requiring broader access may choose multi-user or enterprise licenses for cost-effective access to the report.
13. Are there any additional resources or data provided in the TiO2 Industry report?
While the report offers comprehensive insights, it's advisable to review the specific contents or supplementary materials provided to ascertain if additional resources or data are available.
14. How can I stay updated on further developments or reports in the TiO2 Industry?
To stay informed about further developments, trends, and reports in the TiO2 Industry, consider subscribing to industry newsletters, following relevant companies and organizations, or regularly checking reputable industry news sources and publications.
Methodology
Step 1 - Identification of Relevant Samples Size from Population Database


Step 2 - Approaches for Defining Global Market Size (Value, Volume* & Price*)

Note*: In applicable scenarios
Step 3 - Data Sources
Primary Research
- Web Analytics
- Survey Reports
- Research Institute
- Latest Research Reports
- Opinion Leaders
Secondary Research
- Annual Reports
- White Paper
- Latest Press Release
- Industry Association
- Paid Database
- Investor Presentations

Step 4 - Data Triangulation
Involves using different sources of information in order to increase the validity of a study
These sources are likely to be stakeholders in a program - participants, other researchers, program staff, other community members, and so on.
Then we put all data in single framework & apply various statistical tools to find out the dynamic on the market.
During the analysis stage, feedback from the stakeholder groups would be compared to determine areas of agreement as well as areas of divergence