

Key Insights
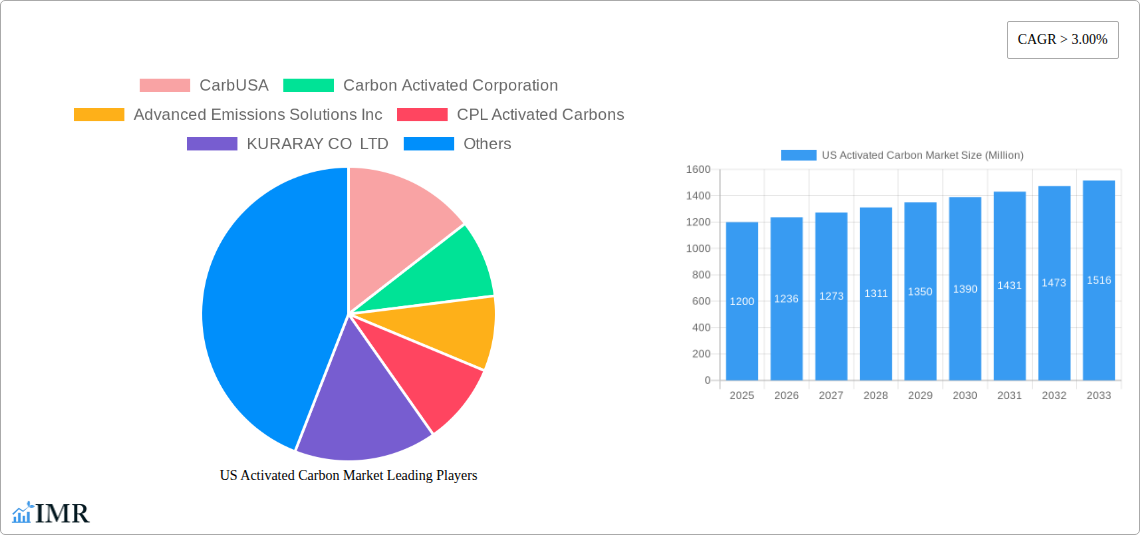
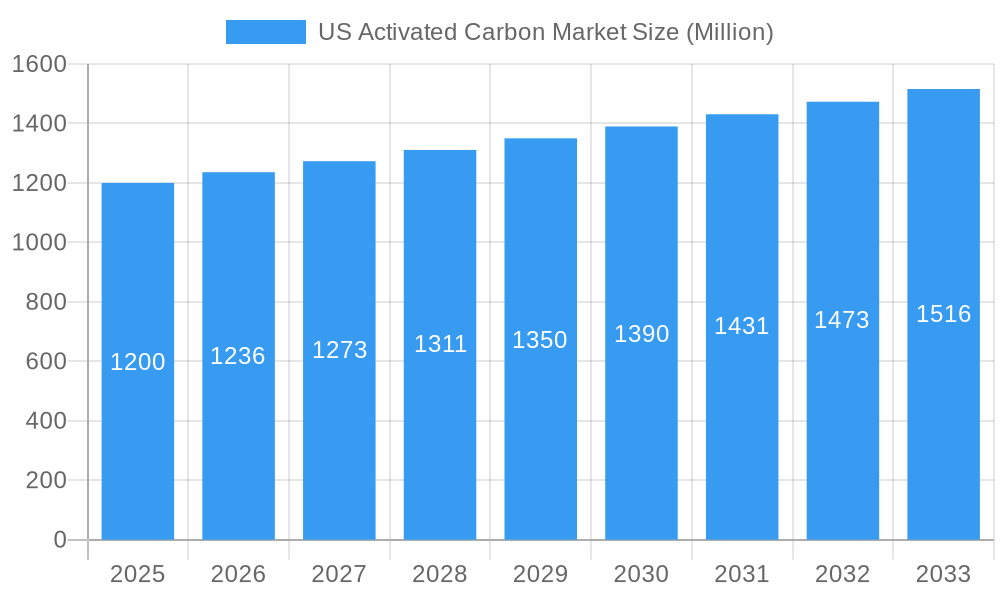
The US activated carbon market, valued at approximately $1.2 billion in 2025, is projected to experience robust growth, exceeding a 3% CAGR through 2033. This expansion is driven by several key factors. Increasing environmental regulations mandating cleaner water and air are fueling demand across water purification, gas purification, and industrial processing sectors. The growing food and beverage industry, emphasizing product safety and quality, is another significant contributor, demanding high-quality activated carbon for filtration and purification. Furthermore, advancements in activated carbon technology, leading to improved adsorption capabilities and broader applications in medicine and metal extraction, are further propelling market growth. Regional variations exist, with the Northeast and West Coast exhibiting higher market penetration due to concentrated industrial activity and stringent environmental regulations.
US Activated Carbon Market Market Size (In Billion)
However, the market also faces certain restraints. Fluctuations in raw material prices (primarily coal and coconut shells) and the emergence of alternative purification technologies can impact market growth. Competition among established players and new entrants necessitates continuous innovation and cost optimization strategies. Despite these challenges, the long-term outlook remains positive. The increasing global focus on sustainability, coupled with rising disposable incomes and the expansion of industrial sectors, is likely to maintain consistent demand for activated carbon in the US market throughout the forecast period. The granular and powdered forms are expected to continue dominating the product type segment due to their cost-effectiveness and wide applicability. Water treatment remains the largest end-user industry, followed by the food and beverage sector.
US Activated Carbon Market Company Market Share
US Activated Carbon Market: A Comprehensive Market Report (2019-2033)
This comprehensive report provides an in-depth analysis of the US activated carbon market, encompassing market dynamics, growth trends, regional segmentation, product landscape, key players, and future outlook. The study period covers 2019-2033, with 2025 as the base and estimated year. The report is invaluable for industry professionals, investors, and strategic decision-makers seeking a clear understanding of this dynamic market. The market is segmented by product type (Powdered Activated Carbon, Granular Activated Carbon, Extruded or Pelletized Activated Carbon), application (Gas Purification, Water Purification, Metal Extraction, Medicine, Other Applications), and end-user industry (Water Treatment, Food & Beverage, Healthcare, Automotive, Industrial Processing, Other End-user Industries). The total market size in 2025 is estimated at $xx Million.
US Activated Carbon Market Market Dynamics & Structure
The US activated carbon market is characterized by a moderate level of concentration, featuring a mix of prominent industry leaders and specialized niche players. Technological advancement, particularly in enhancing adsorption capacities and engineering carbons for precise applications, stands as a primary growth catalyst. Stringent environmental mandates concerning water and air quality exert a significant influence on market expansion. Nevertheless, competitive alternatives, such as advanced membrane filtration technologies, present a notable challenge. The landscape also witnesses ongoing market consolidation through strategic mergers and acquisitions (M&A). While specific figures are subject to ongoing analysis, the trend of M&A activity is expected to reshape market share dynamics, often benefiting larger entities.
- Market Concentration: Moderately concentrated, with a significant market share held by the top players, indicating a competitive yet consolidated environment.
- Technological Innovation: Continuous innovation is focused on augmenting adsorption efficiency and developing bespoke activated carbon solutions for specialized industries including pharmaceuticals, advanced materials, and industrial processing.
- Regulatory Framework: Increasingly stringent environmental regulations globally and within the US are a major impetus for the adoption of high-performance activated carbon solutions across various sectors.
- Competitive Substitutes: While effective, membrane filtration and other separation technologies present competitive pressures in certain applications, necessitating ongoing innovation in activated carbon performance.
- End-User Demographics: Sustained growth is fueled by escalating demand from municipal water treatment facilities, diverse industrial applications (including chemical processing and manufacturing), and the food & beverage sector's commitment to quality and safety.
- M&A Trends: Market consolidation through strategic acquisitions is anticipated to continue, potentially leading to increased market concentration. High research and development expenditures and the rigorous regulatory approval processes can act as barriers to entry for new players.
US Activated Carbon Market Growth Trends & Insights
The US activated carbon market experienced steady growth during the historical period (2019-2024), with a CAGR of xx%. This growth is projected to continue during the forecast period (2025-2033), driven by increasing industrialization, stricter environmental regulations, and rising consumer awareness regarding water and air quality. Technological advancements, including the development of novel activated carbon materials with enhanced performance characteristics, are fueling market expansion. Adoption rates are particularly high in water treatment and industrial processing sectors. Shifting consumer preferences towards sustainable and eco-friendly products are indirectly contributing to the market’s expansion. The market penetration is expected to reach xx% by 2033.
Dominant Regions, Countries, or Segments in US Activated Carbon Market
The Water Treatment sector stands as the most significant segment within the US activated carbon market, with a pronounced presence in the Western and Southern regions of the United States. Granular Activated Carbon (GAC) maintains its dominance in terms of market share, owing to its exceptional versatility and widespread deployment in both water and air purification processes. Key drivers propelling this segment include substantial investments in upgrading water infrastructure, the enforcement of rigorous environmental standards, and a growing societal emphasis on securing clean water and air resources. States like California and Texas are at the forefront, driven by their large populations, substantial industrial bases, and proactive environmental policies. The Food and Beverage sector is also experiencing robust growth, primarily due to increasingly stringent quality assurance and safety regulations.
- Water Treatment: The leading segment, propelled by stringent regulatory requirements, ongoing infrastructure development, and a strong focus on public health, particularly in the Western and Southern US.
- Granular Activated Carbon (GAC): Remains the most prevalent form, favored for its broad applicability in diverse purification and treatment processes.
- California and Texas: These states lead market activity due to high population density, significant industrial output, and stringent environmental enforcement driving demand.
- Economic Policies: Supportive government initiatives, including those promoting water conservation, air quality improvements, and sustainable industrial practices, are significant contributors to market expansion.
- Infrastructure Development: Continuous investment in the modernization and expansion of water and wastewater treatment facilities directly translates to increased demand for activated carbon solutions.
US Activated Carbon Market Product Landscape
The US activated carbon market showcases a diverse product landscape, featuring powdered, granular, and extruded/pelletized activated carbons, each tailored for specific applications. Powdered activated carbon excels in liquid-phase adsorption, while granular activated carbon is widely used in gas and liquid purification. Extruded/pelletized forms provide enhanced mechanical strength and are suitable for applications requiring high flow rates. Ongoing innovation focuses on improving adsorption capacity, enhancing selectivity, and developing sustainable production methods. These advancements lead to improved product performance, driving greater adoption across various sectors.
Key Drivers, Barriers & Challenges in US Activated Carbon Market
Key Drivers:
Stringent environmental regulations, growth of industrial sectors (e.g., chemical manufacturing, pharmaceuticals), and increasing demand for clean water and air are driving market growth. Technological advancements such as the development of activated carbon composites enhance adsorption capabilities.
Key Challenges and Restraints:
Fluctuations in raw material prices, particularly coal and coconut shells, can impact profitability. Competition from alternative technologies (e.g., membrane filtration) presents a significant challenge. Supply chain disruptions can affect product availability and prices. Regulatory hurdles and stringent environmental compliance requirements can also increase costs.
Emerging Opportunities in US Activated Carbon Market
The US activated carbon market is poised for significant growth driven by the development of highly specialized activated carbons tailored for niche and high-value applications. This includes advancements in pharmaceutical purification, where ultra-high purity is paramount, and sophisticated air purification systems for emerging markets and sensitive environments. The burgeoning renewable energy sector, especially biomass gasification processes, presents a fertile ground for activated carbon applications in gas purification and syngas cleaning. Furthermore, a growing emphasis on sustainability is opening new avenues for market expansion. This involves exploring and implementing eco-friendly production methods, optimizing manufacturing processes to minimize environmental impact, and developing activated carbons from renewable or recycled feedstocks.
Growth Accelerators in the US Activated Carbon Market Industry
Strategic partnerships between activated carbon producers and end-users are creating synergistic growth opportunities. Advancements in carbon materials science are leading to the development of high-performance activated carbons with enhanced properties. Expansion into new geographic markets and diversification into new applications will drive future growth. Increased research and development funding dedicated to enhancing activated carbon performance and production efficiency will also contribute significantly to the market’s acceleration.
Key Players Shaping the US Activated Carbon Market Market
- Calgon Carbon Corporation
- KURARAY CO LTD
- Evoqua Water Technologies LLC
- Cabot Corporation
- Ingevity
- KUREHA CORPORATION
- Advanced Emissions Solutions Inc
- Albemarle Corporation
- JACOBI CARBONS GROUP
- Carbon Activated Corporation
- CarbUSA
- CPL Activated Carbons
- Veolia
- Donau Chemie AG
- PURAGEN ACTIVATED CARBONS
- Prominent Systems Inc
Notable Milestones in US Activated Carbon Market Sector
- 2021: Calgon Carbon Corporation launched an innovative portfolio of advanced activated carbons designed for enhanced water purification efficacy, addressing critical contaminant removal needs.
- 2022: Albemarle Corporation announced a significant strategic partnership aimed at bolstering its activated carbon production capacity and expanding its market reach.
- 2023: A trend of consolidation was observed with several mid-sized and smaller activated carbon manufacturers merging or being acquired to achieve greater operational efficiencies, economies of scale, and enhanced market competitiveness. (Further detailed specific milestones would necessitate in-depth industry research and proprietary data.)
In-Depth US Activated Carbon Market Market Outlook
The US activated carbon market is poised for continued growth, driven by technological advancements, increasing environmental regulations, and expanding industrial activities. Strategic investments in R&D, coupled with strategic partnerships and market expansion initiatives, will further fuel this growth. The focus on sustainable production methods and the development of high-performance, specialized activated carbons will shape the future market landscape, creating significant opportunities for industry players and fostering innovation within this essential sector. The market is predicted to reach $xx Million by 2033.
US Activated Carbon Market Segmentation
-
1. Product Type
- 1.1. Powdered Activated Carbon
- 1.2. Granular Activated Carbon
- 1.3. Extruded or Pelletized Activated Carbon
-
2. Application
- 2.1. Gas Purification
- 2.2. Water Purification
- 2.3. Metal Extraction
- 2.4. Medicine
- 2.5. Other Applications
-
3. End-user Industry
- 3.1. Water Treatment
- 3.2. Food & Beverage
- 3.3. Healthcare
- 3.4. Automotive
- 3.5. Industrial Processing
- 3.6. Other End-user Industries
US Activated Carbon Market Segmentation By Geography
-
1. North America
- 1.1. United States
- 1.2. Canada
- 1.3. Mexico
-
2. South America
- 2.1. Brazil
- 2.2. Argentina
- 2.3. Rest of South America
-
3. Europe
- 3.1. United Kingdom
- 3.2. Germany
- 3.3. France
- 3.4. Italy
- 3.5. Spain
- 3.6. Russia
- 3.7. Benelux
- 3.8. Nordics
- 3.9. Rest of Europe
-
4. Middle East & Africa
- 4.1. Turkey
- 4.2. Israel
- 4.3. GCC
- 4.4. North Africa
- 4.5. South Africa
- 4.6. Rest of Middle East & Africa
-
5. Asia Pacific
- 5.1. China
- 5.2. India
- 5.3. Japan
- 5.4. South Korea
- 5.5. ASEAN
- 5.6. Oceania
- 5.7. Rest of Asia Pacific
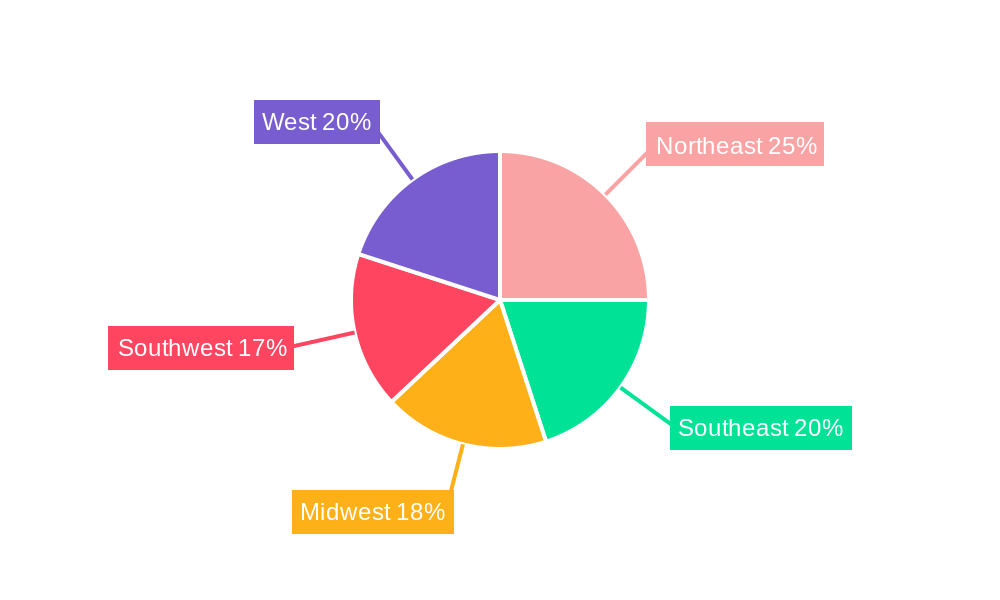
US Activated Carbon Market Regional Market Share
Geographic Coverage of US Activated Carbon Market
US Activated Carbon Market REPORT HIGHLIGHTS
| Aspects | Details |
|---|---|
| Study Period | 2020-2034 |
| Base Year | 2025 |
| Estimated Year | 2026 |
| Forecast Period | 2026-2034 |
| Historical Period | 2020-2025 |
| Growth Rate | CAGR of 8.8% from 2020-2034 |
| Segmentation |
|
Table of Contents
- 1. Introduction
- 1.1. Research Scope
- 1.2. Market Segmentation
- 1.3. Research Objective
- 1.4. Definitions and Assumptions
- 2. Executive Summary
- 2.1. Market Snapshot
- 3. Market Dynamics
- 3.1. Market Drivers
- 3.2. Market Restrains
- 3.3. Market Trends
- 3.4. Market Opportunities
- 4. Market Factor Analysis
- 4.1. Porters Five Forces
- 4.1.1. Bargaining Power of Suppliers
- 4.1.2. Bargaining Power of Buyers
- 4.1.3. Threat of New Entrants
- 4.1.4. Threat of Substitutes
- 4.1.5. Competitive Rivalry
- 4.2. PESTEL analysis
- 4.3. BCG Analysis
- 4.3.1. Stars (High Growth, High Market Share)
- 4.3.2. Cash Cows (Low Growth, High Market Share)
- 4.3.3. Question Mark (High Growth, Low Market Share)
- 4.3.4. Dogs (Low Growth, Low Market Share)
- 4.4. Ansoff Matrix Analysis
- 4.5. Supply Chain Analysis
- 4.6. Regulatory Landscape
- 4.7. Current Market Potential and Opportunity Assessment (TAM–SAM–SOM Framework)
- 4.8. IMR Analyst Note
- 4.1. Porters Five Forces
- 5. Market Analysis, Insights and Forecast 2021-2033
- 5.1. Market Analysis, Insights and Forecast - by Product Type
- 5.1.1. Powdered Activated Carbon
- 5.1.2. Granular Activated Carbon
- 5.1.3. Extruded or Pelletized Activated Carbon
- 5.2. Market Analysis, Insights and Forecast - by Application
- 5.2.1. Gas Purification
- 5.2.2. Water Purification
- 5.2.3. Metal Extraction
- 5.2.4. Medicine
- 5.2.5. Other Applications
- 5.3. Market Analysis, Insights and Forecast - by End-user Industry
- 5.3.1. Water Treatment
- 5.3.2. Food & Beverage
- 5.3.3. Healthcare
- 5.3.4. Automotive
- 5.3.5. Industrial Processing
- 5.3.6. Other End-user Industries
- 5.4. Market Analysis, Insights and Forecast - by Region
- 5.4.1. North America
- 5.4.2. South America
- 5.4.3. Europe
- 5.4.4. Middle East & Africa
- 5.4.5. Asia Pacific
- 5.1. Market Analysis, Insights and Forecast - by Product Type
- 6. Global US Activated Carbon Market Analysis, Insights and Forecast, 2021-2033
- 6.1. Market Analysis, Insights and Forecast - by Product Type
- 6.1.1. Powdered Activated Carbon
- 6.1.2. Granular Activated Carbon
- 6.1.3. Extruded or Pelletized Activated Carbon
- 6.2. Market Analysis, Insights and Forecast - by Application
- 6.2.1. Gas Purification
- 6.2.2. Water Purification
- 6.2.3. Metal Extraction
- 6.2.4. Medicine
- 6.2.5. Other Applications
- 6.3. Market Analysis, Insights and Forecast - by End-user Industry
- 6.3.1. Water Treatment
- 6.3.2. Food & Beverage
- 6.3.3. Healthcare
- 6.3.4. Automotive
- 6.3.5. Industrial Processing
- 6.3.6. Other End-user Industries
- 6.1. Market Analysis, Insights and Forecast - by Product Type
- 7. North America US Activated Carbon Market Analysis, Insights and Forecast, 2020-2032
- 7.1. Market Analysis, Insights and Forecast - by Product Type
- 7.1.1. Powdered Activated Carbon
- 7.1.2. Granular Activated Carbon
- 7.1.3. Extruded or Pelletized Activated Carbon
- 7.2. Market Analysis, Insights and Forecast - by Application
- 7.2.1. Gas Purification
- 7.2.2. Water Purification
- 7.2.3. Metal Extraction
- 7.2.4. Medicine
- 7.2.5. Other Applications
- 7.3. Market Analysis, Insights and Forecast - by End-user Industry
- 7.3.1. Water Treatment
- 7.3.2. Food & Beverage
- 7.3.3. Healthcare
- 7.3.4. Automotive
- 7.3.5. Industrial Processing
- 7.3.6. Other End-user Industries
- 7.1. Market Analysis, Insights and Forecast - by Product Type
- 8. South America US Activated Carbon Market Analysis, Insights and Forecast, 2020-2032
- 8.1. Market Analysis, Insights and Forecast - by Product Type
- 8.1.1. Powdered Activated Carbon
- 8.1.2. Granular Activated Carbon
- 8.1.3. Extruded or Pelletized Activated Carbon
- 8.2. Market Analysis, Insights and Forecast - by Application
- 8.2.1. Gas Purification
- 8.2.2. Water Purification
- 8.2.3. Metal Extraction
- 8.2.4. Medicine
- 8.2.5. Other Applications
- 8.3. Market Analysis, Insights and Forecast - by End-user Industry
- 8.3.1. Water Treatment
- 8.3.2. Food & Beverage
- 8.3.3. Healthcare
- 8.3.4. Automotive
- 8.3.5. Industrial Processing
- 8.3.6. Other End-user Industries
- 8.1. Market Analysis, Insights and Forecast - by Product Type
- 9. Europe US Activated Carbon Market Analysis, Insights and Forecast, 2020-2032
- 9.1. Market Analysis, Insights and Forecast - by Product Type
- 9.1.1. Powdered Activated Carbon
- 9.1.2. Granular Activated Carbon
- 9.1.3. Extruded or Pelletized Activated Carbon
- 9.2. Market Analysis, Insights and Forecast - by Application
- 9.2.1. Gas Purification
- 9.2.2. Water Purification
- 9.2.3. Metal Extraction
- 9.2.4. Medicine
- 9.2.5. Other Applications
- 9.3. Market Analysis, Insights and Forecast - by End-user Industry
- 9.3.1. Water Treatment
- 9.3.2. Food & Beverage
- 9.3.3. Healthcare
- 9.3.4. Automotive
- 9.3.5. Industrial Processing
- 9.3.6. Other End-user Industries
- 9.1. Market Analysis, Insights and Forecast - by Product Type
- 10. Middle East & Africa US Activated Carbon Market Analysis, Insights and Forecast, 2020-2032
- 10.1. Market Analysis, Insights and Forecast - by Product Type
- 10.1.1. Powdered Activated Carbon
- 10.1.2. Granular Activated Carbon
- 10.1.3. Extruded or Pelletized Activated Carbon
- 10.2. Market Analysis, Insights and Forecast - by Application
- 10.2.1. Gas Purification
- 10.2.2. Water Purification
- 10.2.3. Metal Extraction
- 10.2.4. Medicine
- 10.2.5. Other Applications
- 10.3. Market Analysis, Insights and Forecast - by End-user Industry
- 10.3.1. Water Treatment
- 10.3.2. Food & Beverage
- 10.3.3. Healthcare
- 10.3.4. Automotive
- 10.3.5. Industrial Processing
- 10.3.6. Other End-user Industries
- 10.1. Market Analysis, Insights and Forecast - by Product Type
- 11. Asia Pacific US Activated Carbon Market Analysis, Insights and Forecast, 2020-2032
- 11.1. Market Analysis, Insights and Forecast - by Product Type
- 11.1.1. Powdered Activated Carbon
- 11.1.2. Granular Activated Carbon
- 11.1.3. Extruded or Pelletized Activated Carbon
- 11.2. Market Analysis, Insights and Forecast - by Application
- 11.2.1. Gas Purification
- 11.2.2. Water Purification
- 11.2.3. Metal Extraction
- 11.2.4. Medicine
- 11.2.5. Other Applications
- 11.3. Market Analysis, Insights and Forecast - by End-user Industry
- 11.3.1. Water Treatment
- 11.3.2. Food & Beverage
- 11.3.3. Healthcare
- 11.3.4. Automotive
- 11.3.5. Industrial Processing
- 11.3.6. Other End-user Industries
- 11.1. Market Analysis, Insights and Forecast - by Product Type
- 12. Competitive Analysis
- 12.1. Company Profiles
- 12.1.1 CarbUSA
- 12.1.1.1. Company Overview
- 12.1.1.2. Products
- 12.1.1.3. Company Financials
- 12.1.1.4. SWOT Analysis
- 12.1.2 Carbon Activated Corporation
- 12.1.2.1. Company Overview
- 12.1.2.2. Products
- 12.1.2.3. Company Financials
- 12.1.2.4. SWOT Analysis
- 12.1.3 Advanced Emissions Solutions Inc
- 12.1.3.1. Company Overview
- 12.1.3.2. Products
- 12.1.3.3. Company Financials
- 12.1.3.4. SWOT Analysis
- 12.1.4 CPL Activated Carbons
- 12.1.4.1. Company Overview
- 12.1.4.2. Products
- 12.1.4.3. Company Financials
- 12.1.4.4. SWOT Analysis
- 12.1.5 KURARAY CO LTD
- 12.1.5.1. Company Overview
- 12.1.5.2. Products
- 12.1.5.3. Company Financials
- 12.1.5.4. SWOT Analysis
- 12.1.6 JACOBI CARBONS GROUP
- 12.1.6.1. Company Overview
- 12.1.6.2. Products
- 12.1.6.3. Company Financials
- 12.1.6.4. SWOT Analysis
- 12.1.7 Evoqua Water Technologies LLC
- 12.1.7.1. Company Overview
- 12.1.7.2. Products
- 12.1.7.3. Company Financials
- 12.1.7.4. SWOT Analysis
- 12.1.8 Cabot Corporation
- 12.1.8.1. Company Overview
- 12.1.8.2. Products
- 12.1.8.3. Company Financials
- 12.1.8.4. SWOT Analysis
- 12.1.9 Prominent Systems Inc
- 12.1.9.1. Company Overview
- 12.1.9.2. Products
- 12.1.9.3. Company Financials
- 12.1.9.4. SWOT Analysis
- 12.1.10 Calgon Carbon Corporation
- 12.1.10.1. Company Overview
- 12.1.10.2. Products
- 12.1.10.3. Company Financials
- 12.1.10.4. SWOT Analysis
- 12.1.11 Ingevity
- 12.1.11.1. Company Overview
- 12.1.11.2. Products
- 12.1.11.3. Company Financials
- 12.1.11.4. SWOT Analysis
- 12.1.12 KUREHA CORPORATION
- 12.1.12.1. Company Overview
- 12.1.12.2. Products
- 12.1.12.3. Company Financials
- 12.1.12.4. SWOT Analysis
- 12.1.13 Veolia*List Not Exhaustive
- 12.1.13.1. Company Overview
- 12.1.13.2. Products
- 12.1.13.3. Company Financials
- 12.1.13.4. SWOT Analysis
- 12.1.14 Donau Chemie AG
- 12.1.14.1. Company Overview
- 12.1.14.2. Products
- 12.1.14.3. Company Financials
- 12.1.14.4. SWOT Analysis
- 12.1.15 Albemarle Corporation
- 12.1.15.1. Company Overview
- 12.1.15.2. Products
- 12.1.15.3. Company Financials
- 12.1.15.4. SWOT Analysis
- 12.1.16 PURAGEN ACTIVATED CARBONS
- 12.1.16.1. Company Overview
- 12.1.16.2. Products
- 12.1.16.3. Company Financials
- 12.1.16.4. SWOT Analysis
- 12.1.1 CarbUSA
- 12.2. Market Entropy
- 12.2.1 Company's Key Areas Served
- 12.2.2 Recent Developments
- 12.3. Company Market Share Analysis 2025
- 12.3.1 Top 5 Companies Market Share Analysis
- 12.3.2 Top 3 Companies Market Share Analysis
- 12.4. List of Potential Customers
- 13. Research Methodology
List of Figures
- Figure 1: Global US Activated Carbon Market Revenue Breakdown (million, %) by Region 2025 & 2033
- Figure 2: North America US Activated Carbon Market Revenue (million), by Product Type 2025 & 2033
- Figure 3: North America US Activated Carbon Market Revenue Share (%), by Product Type 2025 & 2033
- Figure 4: North America US Activated Carbon Market Revenue (million), by Application 2025 & 2033
- Figure 5: North America US Activated Carbon Market Revenue Share (%), by Application 2025 & 2033
- Figure 6: North America US Activated Carbon Market Revenue (million), by End-user Industry 2025 & 2033
- Figure 7: North America US Activated Carbon Market Revenue Share (%), by End-user Industry 2025 & 2033
- Figure 8: North America US Activated Carbon Market Revenue (million), by Country 2025 & 2033
- Figure 9: North America US Activated Carbon Market Revenue Share (%), by Country 2025 & 2033
- Figure 10: South America US Activated Carbon Market Revenue (million), by Product Type 2025 & 2033
- Figure 11: South America US Activated Carbon Market Revenue Share (%), by Product Type 2025 & 2033
- Figure 12: South America US Activated Carbon Market Revenue (million), by Application 2025 & 2033
- Figure 13: South America US Activated Carbon Market Revenue Share (%), by Application 2025 & 2033
- Figure 14: South America US Activated Carbon Market Revenue (million), by End-user Industry 2025 & 2033
- Figure 15: South America US Activated Carbon Market Revenue Share (%), by End-user Industry 2025 & 2033
- Figure 16: South America US Activated Carbon Market Revenue (million), by Country 2025 & 2033
- Figure 17: South America US Activated Carbon Market Revenue Share (%), by Country 2025 & 2033
- Figure 18: Europe US Activated Carbon Market Revenue (million), by Product Type 2025 & 2033
- Figure 19: Europe US Activated Carbon Market Revenue Share (%), by Product Type 2025 & 2033
- Figure 20: Europe US Activated Carbon Market Revenue (million), by Application 2025 & 2033
- Figure 21: Europe US Activated Carbon Market Revenue Share (%), by Application 2025 & 2033
- Figure 22: Europe US Activated Carbon Market Revenue (million), by End-user Industry 2025 & 2033
- Figure 23: Europe US Activated Carbon Market Revenue Share (%), by End-user Industry 2025 & 2033
- Figure 24: Europe US Activated Carbon Market Revenue (million), by Country 2025 & 2033
- Figure 25: Europe US Activated Carbon Market Revenue Share (%), by Country 2025 & 2033
- Figure 26: Middle East & Africa US Activated Carbon Market Revenue (million), by Product Type 2025 & 2033
- Figure 27: Middle East & Africa US Activated Carbon Market Revenue Share (%), by Product Type 2025 & 2033
- Figure 28: Middle East & Africa US Activated Carbon Market Revenue (million), by Application 2025 & 2033
- Figure 29: Middle East & Africa US Activated Carbon Market Revenue Share (%), by Application 2025 & 2033
- Figure 30: Middle East & Africa US Activated Carbon Market Revenue (million), by End-user Industry 2025 & 2033
- Figure 31: Middle East & Africa US Activated Carbon Market Revenue Share (%), by End-user Industry 2025 & 2033
- Figure 32: Middle East & Africa US Activated Carbon Market Revenue (million), by Country 2025 & 2033
- Figure 33: Middle East & Africa US Activated Carbon Market Revenue Share (%), by Country 2025 & 2033
- Figure 34: Asia Pacific US Activated Carbon Market Revenue (million), by Product Type 2025 & 2033
- Figure 35: Asia Pacific US Activated Carbon Market Revenue Share (%), by Product Type 2025 & 2033
- Figure 36: Asia Pacific US Activated Carbon Market Revenue (million), by Application 2025 & 2033
- Figure 37: Asia Pacific US Activated Carbon Market Revenue Share (%), by Application 2025 & 2033
- Figure 38: Asia Pacific US Activated Carbon Market Revenue (million), by End-user Industry 2025 & 2033
- Figure 39: Asia Pacific US Activated Carbon Market Revenue Share (%), by End-user Industry 2025 & 2033
- Figure 40: Asia Pacific US Activated Carbon Market Revenue (million), by Country 2025 & 2033
- Figure 41: Asia Pacific US Activated Carbon Market Revenue Share (%), by Country 2025 & 2033
List of Tables
- Table 1: Global US Activated Carbon Market Revenue million Forecast, by Product Type 2020 & 2033
- Table 2: Global US Activated Carbon Market Revenue million Forecast, by Application 2020 & 2033
- Table 3: Global US Activated Carbon Market Revenue million Forecast, by End-user Industry 2020 & 2033
- Table 4: Global US Activated Carbon Market Revenue million Forecast, by Region 2020 & 2033
- Table 5: Global US Activated Carbon Market Revenue million Forecast, by Product Type 2020 & 2033
- Table 6: Global US Activated Carbon Market Revenue million Forecast, by Application 2020 & 2033
- Table 7: Global US Activated Carbon Market Revenue million Forecast, by End-user Industry 2020 & 2033
- Table 8: Global US Activated Carbon Market Revenue million Forecast, by Country 2020 & 2033
- Table 9: United States US Activated Carbon Market Revenue (million) Forecast, by Application 2020 & 2033
- Table 10: Canada US Activated Carbon Market Revenue (million) Forecast, by Application 2020 & 2033
- Table 11: Mexico US Activated Carbon Market Revenue (million) Forecast, by Application 2020 & 2033
- Table 12: Global US Activated Carbon Market Revenue million Forecast, by Product Type 2020 & 2033
- Table 13: Global US Activated Carbon Market Revenue million Forecast, by Application 2020 & 2033
- Table 14: Global US Activated Carbon Market Revenue million Forecast, by End-user Industry 2020 & 2033
- Table 15: Global US Activated Carbon Market Revenue million Forecast, by Country 2020 & 2033
- Table 16: Brazil US Activated Carbon Market Revenue (million) Forecast, by Application 2020 & 2033
- Table 17: Argentina US Activated Carbon Market Revenue (million) Forecast, by Application 2020 & 2033
- Table 18: Rest of South America US Activated Carbon Market Revenue (million) Forecast, by Application 2020 & 2033
- Table 19: Global US Activated Carbon Market Revenue million Forecast, by Product Type 2020 & 2033
- Table 20: Global US Activated Carbon Market Revenue million Forecast, by Application 2020 & 2033
- Table 21: Global US Activated Carbon Market Revenue million Forecast, by End-user Industry 2020 & 2033
- Table 22: Global US Activated Carbon Market Revenue million Forecast, by Country 2020 & 2033
- Table 23: United Kingdom US Activated Carbon Market Revenue (million) Forecast, by Application 2020 & 2033
- Table 24: Germany US Activated Carbon Market Revenue (million) Forecast, by Application 2020 & 2033
- Table 25: France US Activated Carbon Market Revenue (million) Forecast, by Application 2020 & 2033
- Table 26: Italy US Activated Carbon Market Revenue (million) Forecast, by Application 2020 & 2033
- Table 27: Spain US Activated Carbon Market Revenue (million) Forecast, by Application 2020 & 2033
- Table 28: Russia US Activated Carbon Market Revenue (million) Forecast, by Application 2020 & 2033
- Table 29: Benelux US Activated Carbon Market Revenue (million) Forecast, by Application 2020 & 2033
- Table 30: Nordics US Activated Carbon Market Revenue (million) Forecast, by Application 2020 & 2033
- Table 31: Rest of Europe US Activated Carbon Market Revenue (million) Forecast, by Application 2020 & 2033
- Table 32: Global US Activated Carbon Market Revenue million Forecast, by Product Type 2020 & 2033
- Table 33: Global US Activated Carbon Market Revenue million Forecast, by Application 2020 & 2033
- Table 34: Global US Activated Carbon Market Revenue million Forecast, by End-user Industry 2020 & 2033
- Table 35: Global US Activated Carbon Market Revenue million Forecast, by Country 2020 & 2033
- Table 36: Turkey US Activated Carbon Market Revenue (million) Forecast, by Application 2020 & 2033
- Table 37: Israel US Activated Carbon Market Revenue (million) Forecast, by Application 2020 & 2033
- Table 38: GCC US Activated Carbon Market Revenue (million) Forecast, by Application 2020 & 2033
- Table 39: North Africa US Activated Carbon Market Revenue (million) Forecast, by Application 2020 & 2033
- Table 40: South Africa US Activated Carbon Market Revenue (million) Forecast, by Application 2020 & 2033
- Table 41: Rest of Middle East & Africa US Activated Carbon Market Revenue (million) Forecast, by Application 2020 & 2033
- Table 42: Global US Activated Carbon Market Revenue million Forecast, by Product Type 2020 & 2033
- Table 43: Global US Activated Carbon Market Revenue million Forecast, by Application 2020 & 2033
- Table 44: Global US Activated Carbon Market Revenue million Forecast, by End-user Industry 2020 & 2033
- Table 45: Global US Activated Carbon Market Revenue million Forecast, by Country 2020 & 2033
- Table 46: China US Activated Carbon Market Revenue (million) Forecast, by Application 2020 & 2033
- Table 47: India US Activated Carbon Market Revenue (million) Forecast, by Application 2020 & 2033
- Table 48: Japan US Activated Carbon Market Revenue (million) Forecast, by Application 2020 & 2033
- Table 49: South Korea US Activated Carbon Market Revenue (million) Forecast, by Application 2020 & 2033
- Table 50: ASEAN US Activated Carbon Market Revenue (million) Forecast, by Application 2020 & 2033
- Table 51: Oceania US Activated Carbon Market Revenue (million) Forecast, by Application 2020 & 2033
- Table 52: Rest of Asia Pacific US Activated Carbon Market Revenue (million) Forecast, by Application 2020 & 2033
Frequently Asked Questions
1. What is the projected Compound Annual Growth Rate (CAGR) of the US Activated Carbon Market?
The projected CAGR is approximately 8.8%.
2. Which companies are prominent players in the US Activated Carbon Market?
Key companies in the market include CarbUSA, Carbon Activated Corporation, Advanced Emissions Solutions Inc, CPL Activated Carbons, KURARAY CO LTD, JACOBI CARBONS GROUP, Evoqua Water Technologies LLC, Cabot Corporation, Prominent Systems Inc, Calgon Carbon Corporation, Ingevity, KUREHA CORPORATION, Veolia*List Not Exhaustive, Donau Chemie AG, Albemarle Corporation, PURAGEN ACTIVATED CARBONS.
3. What are the main segments of the US Activated Carbon Market?
The market segments include Product Type, Application, End-user Industry.
4. Can you provide details about the market size?
The market size is estimated to be USD 1214.47 million as of 2022.
5. What are some drivers contributing to market growth?
; Conformance to Stringent Environmental Regulations In Water Treatment Applications; Augmenting Prominence for Air Pollution Control (Especially Mercury Removal).
6. What are the notable trends driving market growth?
Emerging Applications in the Medical and Pharmaceutical Sector.
7. Are there any restraints impacting market growth?
; Narrower Markets Due to Increased Costs of Some Grades of Activated Carbon; Threat of Substitutes Like Silica Gel and Supersand.
8. Can you provide examples of recent developments in the market?
N/A
9. What pricing options are available for accessing the report?
Pricing options include single-user, multi-user, and enterprise licenses priced at USD 3800, USD 4500, and USD 5800 respectively.
10. Is the market size provided in terms of value or volume?
The market size is provided in terms of value, measured in million.
11. Are there any specific market keywords associated with the report?
Yes, the market keyword associated with the report is "US Activated Carbon Market," which aids in identifying and referencing the specific market segment covered.
12. How do I determine which pricing option suits my needs best?
The pricing options vary based on user requirements and access needs. Individual users may opt for single-user licenses, while businesses requiring broader access may choose multi-user or enterprise licenses for cost-effective access to the report.
13. Are there any additional resources or data provided in the US Activated Carbon Market report?
While the report offers comprehensive insights, it's advisable to review the specific contents or supplementary materials provided to ascertain if additional resources or data are available.
14. How can I stay updated on further developments or reports in the US Activated Carbon Market?
To stay informed about further developments, trends, and reports in the US Activated Carbon Market, consider subscribing to industry newsletters, following relevant companies and organizations, or regularly checking reputable industry news sources and publications.
Methodology
Step 1 - Identification of Relevant Samples Size from Population Database


Step 2 - Approaches for Defining Global Market Size (Value, Volume* & Price*)

Note*: In applicable scenarios
Step 3 - Data Sources
Primary Research
- Web Analytics
- Survey Reports
- Research Institute
- Latest Research Reports
- Opinion Leaders
Secondary Research
- Annual Reports
- White Paper
- Latest Press Release
- Industry Association
- Paid Database
- Investor Presentations

Step 4 - Data Triangulation
Involves using different sources of information in order to increase the validity of a study
These sources are likely to be stakeholders in a program - participants, other researchers, program staff, other community members, and so on.
Then we put all data in single framework & apply various statistical tools to find out the dynamic on the market.
During the analysis stage, feedback from the stakeholder groups would be compared to determine areas of agreement as well as areas of divergence