

Key Insights
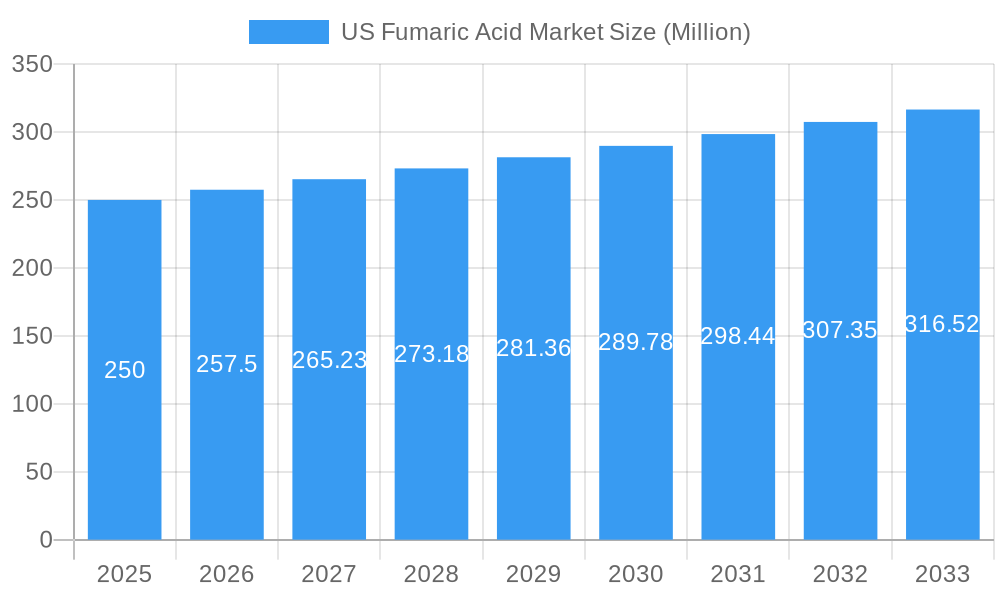
The US fumaric acid market, valued at an estimated $XX million in 2025, is projected to experience robust growth, exhibiting a Compound Annual Growth Rate (CAGR) exceeding 3.00% from 2025 to 2033. This expansion is driven by several key factors. The increasing demand for fumaric acid in the food and beverage industry as a food additive and acidity regulator is a significant contributor. The rising popularity of healthier food options and the growing awareness of the health benefits of fumaric acid are further fueling market growth. Simultaneously, the expanding applications of fumaric acid in the production of unsaturated polyester resins and alkyd resins within the chemical industry represent another major driver. Growth in the construction and automotive sectors, reliant on these resins, indirectly boosts demand. Furthermore, the personal care and cosmetics industry's adoption of fumaric acid as a component in various products contributes to the market's upward trajectory. The diverse applications across various sectors ensure a broad and relatively stable demand base, mitigating risks associated with reliance on a single industry.
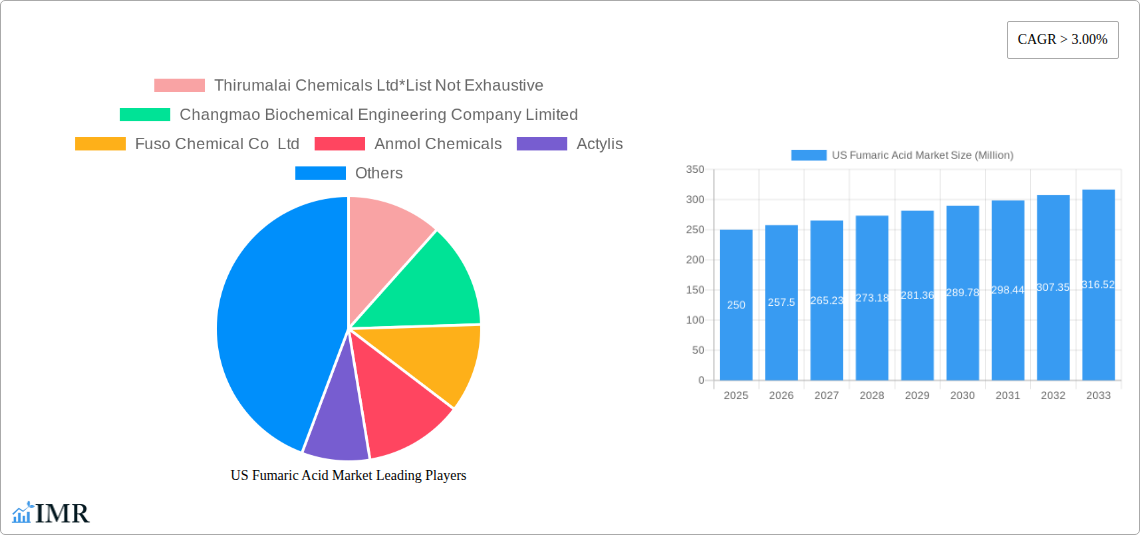
US Fumaric Acid Market Market Size (In Million)
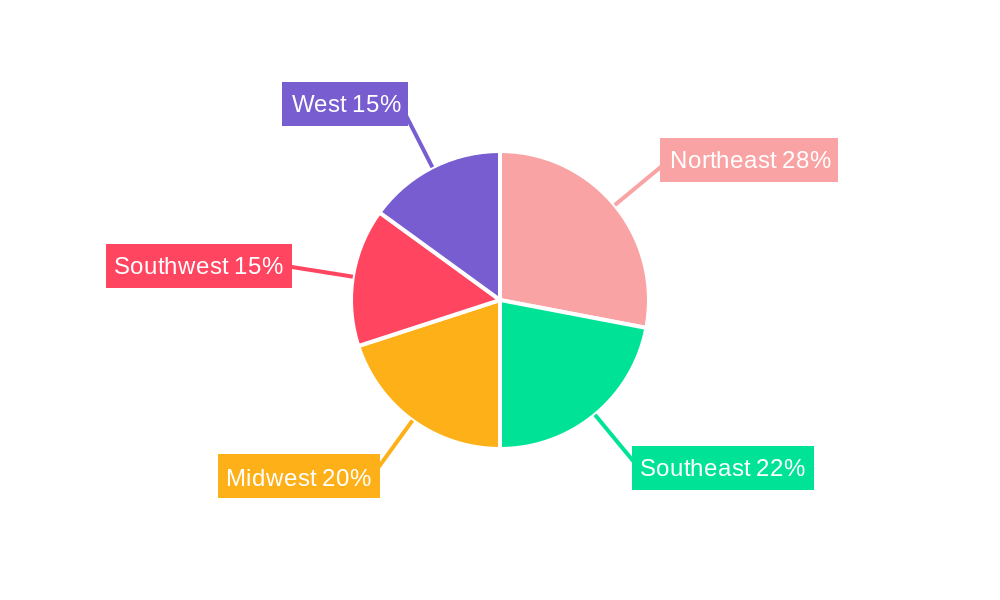
However, certain restraints could potentially moderate the market's growth rate. Fluctuations in raw material prices, primarily maleic anhydride, can impact production costs and profitability. The presence of substitute acids, such as malic and tartaric acids, could also present competitive challenges. Regulatory changes and evolving consumer preferences regarding food additives might necessitate adjustments within the industry. Despite these potential obstacles, the overall market outlook remains positive, owing to the consistent demand across diverse application segments and the anticipated growth in key end-user industries, such as food and beverage, cosmetics, and chemicals. The Northeast and West regions of the US are anticipated to lead market growth, reflecting higher concentrations of key industries and consumer demand.
US Fumaric Acid Market Company Market Share
US Fumaric Acid Market Report: A Comprehensive Analysis (2019-2033)
This comprehensive report provides an in-depth analysis of the US Fumaric Acid market, encompassing market dynamics, growth trends, competitive landscape, and future outlook. It serves as an essential resource for industry professionals, investors, and strategic decision-makers seeking to understand and capitalize on opportunities within this dynamic sector. The report covers the parent market of chemical intermediates and the child market of food additives, providing a granular view of market segmentation and growth drivers. All values are presented in million units.
Study Period: 2019-2033 | Base Year: 2025 | Estimated Year: 2025 | Forecast Period: 2025-2033 | Historical Period: 2019-2024
US Fumaric Acid Market Market Dynamics & Structure
This section analyzes the US fumaric acid market's competitive landscape, technological advancements, regulatory environment, and market concentration. We delve into the dynamics influencing market growth, including mergers & acquisitions (M&A) activities and the presence of substitute products.
- Market Concentration: The US fumaric acid market exhibits a moderately concentrated structure, with a few major players holding significant market share (estimated at xx%). Smaller players contribute to the remaining xx%.
- Technological Innovation: Innovation focuses on enhancing production efficiency, improving product purity, and developing new applications, particularly in the food and beverage sector. However, high initial investment costs present a barrier to entry for new players.
- Regulatory Framework: Stringent food safety regulations and environmental standards impact manufacturing processes and product specifications. Compliance costs represent a key challenge for market players.
- Competitive Product Substitutes: Malic acid and citric acid are key substitutes for fumaric acid, creating competitive pressure within specific applications. Price competitiveness and functional attributes influence market share dynamics.
- End-User Demographics: The growing health-conscious consumer base fuels demand for natural and clean-label food ingredients, driving growth in the food-grade fumaric acid segment.
- M&A Trends: The past five years have witnessed xx M&A deals within the US fumaric acid market. Consolidation aims to enhance market share, broaden product portfolios, and improve supply chain efficiency. Deal value averaged approximately xx million USD.
US Fumaric Acid Market Growth Trends & Insights
The US fumaric acid market experienced steady growth during the historical period (2019-2024), with an estimated CAGR of xx%. This growth is attributed to increasing demand across various end-use industries, including food and beverages, pharmaceuticals, and plastics. The market size in 2024 was approximately xx million units. The forecast period (2025-2033) projects sustained growth, driven by expanding applications and technological advancements. Market penetration within niche segments like personal care and cosmetics also contributes to this growth trajectory. A shift towards sustainable and eco-friendly solutions fuels demand for bio-based fumaric acid. Consumer preference for natural food additives and increasing health consciousness positively impacts market growth. Technological disruptions are expected to lead to increased production efficiency and cost reduction in the coming years.
Dominant Regions, Countries, or Segments in US Fumaric Acid Market
The Northeast and West Coast regions of the US represent the most significant markets for fumaric acid due to the concentration of key end-use industries. California and New York are leading states within these regions. Within segments:
- Type: The food-grade segment dominates, driven by rising demand in the food and beverage industry for acidulants and leavening agents. The technical-grade segment holds significant market share due to its application in the chemical and plastics industries.
- Application: Food & beverage processing commands the largest market share, followed by unsaturated polyester resin and alkyd resin applications. Growth in the personal care and cosmetics segment is expected to accelerate.
- End-user Industry: The food and beverage industry is the dominant end-user, followed by the chemical and pharmaceutical industries.
The growth in these regions and segments is primarily driven by strong industrial activity and substantial consumer base. Government policies promoting sustainable practices further stimulate growth.
US Fumaric Acid Market Product Landscape
The US fumaric acid market offers both food-grade and technical-grade products, with variations in purity and particle size catering to specific application requirements. Recent product innovations focus on enhancing purity, improving solubility, and developing specialized formulations for niche applications. The key selling propositions revolve around purity, consistent quality, and cost-effectiveness. Technological advancements have led to improvements in production processes, resulting in higher yields and reduced manufacturing costs.
Key Drivers, Barriers & Challenges in US Fumaric Acid Market
Key Drivers:
- Growing demand for natural food additives and preservatives in the food and beverage industry.
- Increasing application in the chemical industry, specifically in the production of resins and polymers.
- Technological advancements leading to improved production efficiency and reduced costs.
Key Challenges & Restraints:
- Price volatility of raw materials impacting production costs.
- Stringent regulatory requirements and compliance costs.
- Competition from substitute acids such as malic acid and citric acid. This competition pressures profit margins and limits market growth by approximately xx% in the forecast period.
Emerging Opportunities in US Fumaric Acid Market
- Expanding applications in the personal care and cosmetics sector.
- Growing demand for bio-based fumaric acid to meet sustainability goals.
- Penetration into new markets such as animal feed and agricultural chemicals.
Growth Accelerators in the US Fumaric Acid Market Industry
Technological breakthroughs in fermentation processes are improving production efficiency and reducing manufacturing costs. Strategic partnerships between manufacturers and end-users are fostering innovation and market expansion. A focus on sustainable and eco-friendly production processes aligns with growing environmental concerns, attracting a broader customer base.
Key Players Shaping the US Fumaric Acid Market Market
- Thirumalai Chemicals Ltd
- Changmao Biochemical Engineering Company Limited
- Fuso Chemical Co Ltd
- Anmol Chemicals
- Actylis
- Merck KGaA
- NIPPON SHOKUBAI CO LTD
- Polynt SpA
Notable Milestones in US Fumaric Acid Market Sector
- 2022: Introduction of a new, high-purity food-grade fumaric acid by Merck KGaA.
- 2021: Acquisition of a smaller fumaric acid producer by Polynt SpA, consolidating market share.
- 2020: Implementation of stricter environmental regulations impacting production processes across the industry.
In-Depth US Fumaric Acid Market Market Outlook
The US fumaric acid market exhibits robust growth potential in the coming years, driven by technological advancements, expanding applications, and a growing emphasis on sustainability. Strategic partnerships and market expansion initiatives will play a crucial role in shaping the market landscape. Opportunities exist in untapped markets and innovative applications, presenting significant growth potential for existing and new players. The market is poised for continued expansion, with a projected CAGR of xx% during the forecast period.
US Fumaric Acid Market Segmentation
-
1. Type
- 1.1. Food Grade
- 1.2. Technical Grade
-
2. Application
- 2.1. Food & Beverage Processing
- 2.2. Rosin Paper Sizing
- 2.3. Unsaturated Polyester Resin
- 2.4. Alkyd Resin
- 2.5. Personal Care and Cosmetics
- 2.6. Other Ap
-
3. End-user Industry
- 3.1. Food and Beverage
- 3.2. Cosmetics
- 3.3. Pharmaceutical
- 3.4. Chemical
- 3.5. Other End-user Industries (Rubber, Paint)
US Fumaric Acid Market Segmentation By Geography
-
1. North America
- 1.1. United States
- 1.2. Canada
- 1.3. Mexico
-
2. South America
- 2.1. Brazil
- 2.2. Argentina
- 2.3. Rest of South America
-
3. Europe
- 3.1. United Kingdom
- 3.2. Germany
- 3.3. France
- 3.4. Italy
- 3.5. Spain
- 3.6. Russia
- 3.7. Benelux
- 3.8. Nordics
- 3.9. Rest of Europe
-
4. Middle East & Africa
- 4.1. Turkey
- 4.2. Israel
- 4.3. GCC
- 4.4. North Africa
- 4.5. South Africa
- 4.6. Rest of Middle East & Africa
-
5. Asia Pacific
- 5.1. China
- 5.2. India
- 5.3. Japan
- 5.4. South Korea
- 5.5. ASEAN
- 5.6. Oceania
- 5.7. Rest of Asia Pacific
US Fumaric Acid Market Regional Market Share
Geographic Coverage of US Fumaric Acid Market
US Fumaric Acid Market REPORT HIGHLIGHTS
| Aspects | Details |
|---|---|
| Study Period | 2020-2034 |
| Base Year | 2025 |
| Estimated Year | 2026 |
| Forecast Period | 2026-2034 |
| Historical Period | 2020-2025 |
| Growth Rate | CAGR of 5.41% from 2020-2034 |
| Segmentation |
|
Table of Contents
- 1. Introduction
- 1.1. Research Scope
- 1.2. Market Segmentation
- 1.3. Research Objective
- 1.4. Definitions and Assumptions
- 2. Executive Summary
- 2.1. Market Snapshot
- 3. Market Dynamics
- 3.1. Market Drivers
- 3.2. Market Restrains
- 3.3. Market Trends
- 3.4. Market Opportunities
- 4. Market Factor Analysis
- 4.1. Porters Five Forces
- 4.1.1. Bargaining Power of Suppliers
- 4.1.2. Bargaining Power of Buyers
- 4.1.3. Threat of New Entrants
- 4.1.4. Threat of Substitutes
- 4.1.5. Competitive Rivalry
- 4.2. PESTEL analysis
- 4.3. BCG Analysis
- 4.3.1. Stars (High Growth, High Market Share)
- 4.3.2. Cash Cows (Low Growth, High Market Share)
- 4.3.3. Question Mark (High Growth, Low Market Share)
- 4.3.4. Dogs (Low Growth, Low Market Share)
- 4.4. Ansoff Matrix Analysis
- 4.5. Supply Chain Analysis
- 4.6. Regulatory Landscape
- 4.7. Current Market Potential and Opportunity Assessment (TAM–SAM–SOM Framework)
- 4.8. IMR Analyst Note
- 4.1. Porters Five Forces
- 5. Market Analysis, Insights and Forecast 2021-2033
- 5.1. Market Analysis, Insights and Forecast - by Type
- 5.1.1. Food Grade
- 5.1.2. Technical Grade
- 5.2. Market Analysis, Insights and Forecast - by Application
- 5.2.1. Food & Beverage Processing
- 5.2.2. Rosin Paper Sizing
- 5.2.3. Unsaturated Polyester Resin
- 5.2.4. Alkyd Resin
- 5.2.5. Personal Care and Cosmetics
- 5.2.6. Other Ap
- 5.3. Market Analysis, Insights and Forecast - by End-user Industry
- 5.3.1. Food and Beverage
- 5.3.2. Cosmetics
- 5.3.3. Pharmaceutical
- 5.3.4. Chemical
- 5.3.5. Other End-user Industries (Rubber, Paint)
- 5.4. Market Analysis, Insights and Forecast - by Region
- 5.4.1. North America
- 5.4.2. South America
- 5.4.3. Europe
- 5.4.4. Middle East & Africa
- 5.4.5. Asia Pacific
- 5.1. Market Analysis, Insights and Forecast - by Type
- 6. Global US Fumaric Acid Market Analysis, Insights and Forecast, 2021-2033
- 6.1. Market Analysis, Insights and Forecast - by Type
- 6.1.1. Food Grade
- 6.1.2. Technical Grade
- 6.2. Market Analysis, Insights and Forecast - by Application
- 6.2.1. Food & Beverage Processing
- 6.2.2. Rosin Paper Sizing
- 6.2.3. Unsaturated Polyester Resin
- 6.2.4. Alkyd Resin
- 6.2.5. Personal Care and Cosmetics
- 6.2.6. Other Ap
- 6.3. Market Analysis, Insights and Forecast - by End-user Industry
- 6.3.1. Food and Beverage
- 6.3.2. Cosmetics
- 6.3.3. Pharmaceutical
- 6.3.4. Chemical
- 6.3.5. Other End-user Industries (Rubber, Paint)
- 6.1. Market Analysis, Insights and Forecast - by Type
- 7. North America US Fumaric Acid Market Analysis, Insights and Forecast, 2020-2032
- 7.1. Market Analysis, Insights and Forecast - by Type
- 7.1.1. Food Grade
- 7.1.2. Technical Grade
- 7.2. Market Analysis, Insights and Forecast - by Application
- 7.2.1. Food & Beverage Processing
- 7.2.2. Rosin Paper Sizing
- 7.2.3. Unsaturated Polyester Resin
- 7.2.4. Alkyd Resin
- 7.2.5. Personal Care and Cosmetics
- 7.2.6. Other Ap
- 7.3. Market Analysis, Insights and Forecast - by End-user Industry
- 7.3.1. Food and Beverage
- 7.3.2. Cosmetics
- 7.3.3. Pharmaceutical
- 7.3.4. Chemical
- 7.3.5. Other End-user Industries (Rubber, Paint)
- 7.1. Market Analysis, Insights and Forecast - by Type
- 8. South America US Fumaric Acid Market Analysis, Insights and Forecast, 2020-2032
- 8.1. Market Analysis, Insights and Forecast - by Type
- 8.1.1. Food Grade
- 8.1.2. Technical Grade
- 8.2. Market Analysis, Insights and Forecast - by Application
- 8.2.1. Food & Beverage Processing
- 8.2.2. Rosin Paper Sizing
- 8.2.3. Unsaturated Polyester Resin
- 8.2.4. Alkyd Resin
- 8.2.5. Personal Care and Cosmetics
- 8.2.6. Other Ap
- 8.3. Market Analysis, Insights and Forecast - by End-user Industry
- 8.3.1. Food and Beverage
- 8.3.2. Cosmetics
- 8.3.3. Pharmaceutical
- 8.3.4. Chemical
- 8.3.5. Other End-user Industries (Rubber, Paint)
- 8.1. Market Analysis, Insights and Forecast - by Type
- 9. Europe US Fumaric Acid Market Analysis, Insights and Forecast, 2020-2032
- 9.1. Market Analysis, Insights and Forecast - by Type
- 9.1.1. Food Grade
- 9.1.2. Technical Grade
- 9.2. Market Analysis, Insights and Forecast - by Application
- 9.2.1. Food & Beverage Processing
- 9.2.2. Rosin Paper Sizing
- 9.2.3. Unsaturated Polyester Resin
- 9.2.4. Alkyd Resin
- 9.2.5. Personal Care and Cosmetics
- 9.2.6. Other Ap
- 9.3. Market Analysis, Insights and Forecast - by End-user Industry
- 9.3.1. Food and Beverage
- 9.3.2. Cosmetics
- 9.3.3. Pharmaceutical
- 9.3.4. Chemical
- 9.3.5. Other End-user Industries (Rubber, Paint)
- 9.1. Market Analysis, Insights and Forecast - by Type
- 10. Middle East & Africa US Fumaric Acid Market Analysis, Insights and Forecast, 2020-2032
- 10.1. Market Analysis, Insights and Forecast - by Type
- 10.1.1. Food Grade
- 10.1.2. Technical Grade
- 10.2. Market Analysis, Insights and Forecast - by Application
- 10.2.1. Food & Beverage Processing
- 10.2.2. Rosin Paper Sizing
- 10.2.3. Unsaturated Polyester Resin
- 10.2.4. Alkyd Resin
- 10.2.5. Personal Care and Cosmetics
- 10.2.6. Other Ap
- 10.3. Market Analysis, Insights and Forecast - by End-user Industry
- 10.3.1. Food and Beverage
- 10.3.2. Cosmetics
- 10.3.3. Pharmaceutical
- 10.3.4. Chemical
- 10.3.5. Other End-user Industries (Rubber, Paint)
- 10.1. Market Analysis, Insights and Forecast - by Type
- 11. Asia Pacific US Fumaric Acid Market Analysis, Insights and Forecast, 2020-2032
- 11.1. Market Analysis, Insights and Forecast - by Type
- 11.1.1. Food Grade
- 11.1.2. Technical Grade
- 11.2. Market Analysis, Insights and Forecast - by Application
- 11.2.1. Food & Beverage Processing
- 11.2.2. Rosin Paper Sizing
- 11.2.3. Unsaturated Polyester Resin
- 11.2.4. Alkyd Resin
- 11.2.5. Personal Care and Cosmetics
- 11.2.6. Other Ap
- 11.3. Market Analysis, Insights and Forecast - by End-user Industry
- 11.3.1. Food and Beverage
- 11.3.2. Cosmetics
- 11.3.3. Pharmaceutical
- 11.3.4. Chemical
- 11.3.5. Other End-user Industries (Rubber, Paint)
- 11.1. Market Analysis, Insights and Forecast - by Type
- 12. Competitive Analysis
- 12.1. Company Profiles
- 12.1.1 Thirumalai Chemicals Ltd*List Not Exhaustive
- 12.1.1.1. Company Overview
- 12.1.1.2. Products
- 12.1.1.3. Company Financials
- 12.1.1.4. SWOT Analysis
- 12.1.2 Changmao Biochemical Engineering Company Limited
- 12.1.2.1. Company Overview
- 12.1.2.2. Products
- 12.1.2.3. Company Financials
- 12.1.2.4. SWOT Analysis
- 12.1.3 Fuso Chemical Co Ltd
- 12.1.3.1. Company Overview
- 12.1.3.2. Products
- 12.1.3.3. Company Financials
- 12.1.3.4. SWOT Analysis
- 12.1.4 Anmol Chemicals
- 12.1.4.1. Company Overview
- 12.1.4.2. Products
- 12.1.4.3. Company Financials
- 12.1.4.4. SWOT Analysis
- 12.1.5 Actylis
- 12.1.5.1. Company Overview
- 12.1.5.2. Products
- 12.1.5.3. Company Financials
- 12.1.5.4. SWOT Analysis
- 12.1.6 Merck KGaA
- 12.1.6.1. Company Overview
- 12.1.6.2. Products
- 12.1.6.3. Company Financials
- 12.1.6.4. SWOT Analysis
- 12.1.7 NIPPON SHOKUBAI CO LTD
- 12.1.7.1. Company Overview
- 12.1.7.2. Products
- 12.1.7.3. Company Financials
- 12.1.7.4. SWOT Analysis
- 12.1.8 Polynt SpA
- 12.1.8.1. Company Overview
- 12.1.8.2. Products
- 12.1.8.3. Company Financials
- 12.1.8.4. SWOT Analysis
- 12.1.1 Thirumalai Chemicals Ltd*List Not Exhaustive
- 12.2. Market Entropy
- 12.2.1 Company's Key Areas Served
- 12.2.2 Recent Developments
- 12.3. Company Market Share Analysis 2025
- 12.3.1 Top 5 Companies Market Share Analysis
- 12.3.2 Top 3 Companies Market Share Analysis
- 12.4. List of Potential Customers
- 13. Research Methodology
List of Figures
- Figure 1: Global US Fumaric Acid Market Revenue Breakdown (undefined, %) by Region 2025 & 2033
- Figure 2: North America US Fumaric Acid Market Revenue (undefined), by Type 2025 & 2033
- Figure 3: North America US Fumaric Acid Market Revenue Share (%), by Type 2025 & 2033
- Figure 4: North America US Fumaric Acid Market Revenue (undefined), by Application 2025 & 2033
- Figure 5: North America US Fumaric Acid Market Revenue Share (%), by Application 2025 & 2033
- Figure 6: North America US Fumaric Acid Market Revenue (undefined), by End-user Industry 2025 & 2033
- Figure 7: North America US Fumaric Acid Market Revenue Share (%), by End-user Industry 2025 & 2033
- Figure 8: North America US Fumaric Acid Market Revenue (undefined), by Country 2025 & 2033
- Figure 9: North America US Fumaric Acid Market Revenue Share (%), by Country 2025 & 2033
- Figure 10: South America US Fumaric Acid Market Revenue (undefined), by Type 2025 & 2033
- Figure 11: South America US Fumaric Acid Market Revenue Share (%), by Type 2025 & 2033
- Figure 12: South America US Fumaric Acid Market Revenue (undefined), by Application 2025 & 2033
- Figure 13: South America US Fumaric Acid Market Revenue Share (%), by Application 2025 & 2033
- Figure 14: South America US Fumaric Acid Market Revenue (undefined), by End-user Industry 2025 & 2033
- Figure 15: South America US Fumaric Acid Market Revenue Share (%), by End-user Industry 2025 & 2033
- Figure 16: South America US Fumaric Acid Market Revenue (undefined), by Country 2025 & 2033
- Figure 17: South America US Fumaric Acid Market Revenue Share (%), by Country 2025 & 2033
- Figure 18: Europe US Fumaric Acid Market Revenue (undefined), by Type 2025 & 2033
- Figure 19: Europe US Fumaric Acid Market Revenue Share (%), by Type 2025 & 2033
- Figure 20: Europe US Fumaric Acid Market Revenue (undefined), by Application 2025 & 2033
- Figure 21: Europe US Fumaric Acid Market Revenue Share (%), by Application 2025 & 2033
- Figure 22: Europe US Fumaric Acid Market Revenue (undefined), by End-user Industry 2025 & 2033
- Figure 23: Europe US Fumaric Acid Market Revenue Share (%), by End-user Industry 2025 & 2033
- Figure 24: Europe US Fumaric Acid Market Revenue (undefined), by Country 2025 & 2033
- Figure 25: Europe US Fumaric Acid Market Revenue Share (%), by Country 2025 & 2033
- Figure 26: Middle East & Africa US Fumaric Acid Market Revenue (undefined), by Type 2025 & 2033
- Figure 27: Middle East & Africa US Fumaric Acid Market Revenue Share (%), by Type 2025 & 2033
- Figure 28: Middle East & Africa US Fumaric Acid Market Revenue (undefined), by Application 2025 & 2033
- Figure 29: Middle East & Africa US Fumaric Acid Market Revenue Share (%), by Application 2025 & 2033
- Figure 30: Middle East & Africa US Fumaric Acid Market Revenue (undefined), by End-user Industry 2025 & 2033
- Figure 31: Middle East & Africa US Fumaric Acid Market Revenue Share (%), by End-user Industry 2025 & 2033
- Figure 32: Middle East & Africa US Fumaric Acid Market Revenue (undefined), by Country 2025 & 2033
- Figure 33: Middle East & Africa US Fumaric Acid Market Revenue Share (%), by Country 2025 & 2033
- Figure 34: Asia Pacific US Fumaric Acid Market Revenue (undefined), by Type 2025 & 2033
- Figure 35: Asia Pacific US Fumaric Acid Market Revenue Share (%), by Type 2025 & 2033
- Figure 36: Asia Pacific US Fumaric Acid Market Revenue (undefined), by Application 2025 & 2033
- Figure 37: Asia Pacific US Fumaric Acid Market Revenue Share (%), by Application 2025 & 2033
- Figure 38: Asia Pacific US Fumaric Acid Market Revenue (undefined), by End-user Industry 2025 & 2033
- Figure 39: Asia Pacific US Fumaric Acid Market Revenue Share (%), by End-user Industry 2025 & 2033
- Figure 40: Asia Pacific US Fumaric Acid Market Revenue (undefined), by Country 2025 & 2033
- Figure 41: Asia Pacific US Fumaric Acid Market Revenue Share (%), by Country 2025 & 2033
List of Tables
- Table 1: Global US Fumaric Acid Market Revenue undefined Forecast, by Type 2020 & 2033
- Table 2: Global US Fumaric Acid Market Revenue undefined Forecast, by Application 2020 & 2033
- Table 3: Global US Fumaric Acid Market Revenue undefined Forecast, by End-user Industry 2020 & 2033
- Table 4: Global US Fumaric Acid Market Revenue undefined Forecast, by Region 2020 & 2033
- Table 5: Global US Fumaric Acid Market Revenue undefined Forecast, by Type 2020 & 2033
- Table 6: Global US Fumaric Acid Market Revenue undefined Forecast, by Application 2020 & 2033
- Table 7: Global US Fumaric Acid Market Revenue undefined Forecast, by End-user Industry 2020 & 2033
- Table 8: Global US Fumaric Acid Market Revenue undefined Forecast, by Country 2020 & 2033
- Table 9: United States US Fumaric Acid Market Revenue (undefined) Forecast, by Application 2020 & 2033
- Table 10: Canada US Fumaric Acid Market Revenue (undefined) Forecast, by Application 2020 & 2033
- Table 11: Mexico US Fumaric Acid Market Revenue (undefined) Forecast, by Application 2020 & 2033
- Table 12: Global US Fumaric Acid Market Revenue undefined Forecast, by Type 2020 & 2033
- Table 13: Global US Fumaric Acid Market Revenue undefined Forecast, by Application 2020 & 2033
- Table 14: Global US Fumaric Acid Market Revenue undefined Forecast, by End-user Industry 2020 & 2033
- Table 15: Global US Fumaric Acid Market Revenue undefined Forecast, by Country 2020 & 2033
- Table 16: Brazil US Fumaric Acid Market Revenue (undefined) Forecast, by Application 2020 & 2033
- Table 17: Argentina US Fumaric Acid Market Revenue (undefined) Forecast, by Application 2020 & 2033
- Table 18: Rest of South America US Fumaric Acid Market Revenue (undefined) Forecast, by Application 2020 & 2033
- Table 19: Global US Fumaric Acid Market Revenue undefined Forecast, by Type 2020 & 2033
- Table 20: Global US Fumaric Acid Market Revenue undefined Forecast, by Application 2020 & 2033
- Table 21: Global US Fumaric Acid Market Revenue undefined Forecast, by End-user Industry 2020 & 2033
- Table 22: Global US Fumaric Acid Market Revenue undefined Forecast, by Country 2020 & 2033
- Table 23: United Kingdom US Fumaric Acid Market Revenue (undefined) Forecast, by Application 2020 & 2033
- Table 24: Germany US Fumaric Acid Market Revenue (undefined) Forecast, by Application 2020 & 2033
- Table 25: France US Fumaric Acid Market Revenue (undefined) Forecast, by Application 2020 & 2033
- Table 26: Italy US Fumaric Acid Market Revenue (undefined) Forecast, by Application 2020 & 2033
- Table 27: Spain US Fumaric Acid Market Revenue (undefined) Forecast, by Application 2020 & 2033
- Table 28: Russia US Fumaric Acid Market Revenue (undefined) Forecast, by Application 2020 & 2033
- Table 29: Benelux US Fumaric Acid Market Revenue (undefined) Forecast, by Application 2020 & 2033
- Table 30: Nordics US Fumaric Acid Market Revenue (undefined) Forecast, by Application 2020 & 2033
- Table 31: Rest of Europe US Fumaric Acid Market Revenue (undefined) Forecast, by Application 2020 & 2033
- Table 32: Global US Fumaric Acid Market Revenue undefined Forecast, by Type 2020 & 2033
- Table 33: Global US Fumaric Acid Market Revenue undefined Forecast, by Application 2020 & 2033
- Table 34: Global US Fumaric Acid Market Revenue undefined Forecast, by End-user Industry 2020 & 2033
- Table 35: Global US Fumaric Acid Market Revenue undefined Forecast, by Country 2020 & 2033
- Table 36: Turkey US Fumaric Acid Market Revenue (undefined) Forecast, by Application 2020 & 2033
- Table 37: Israel US Fumaric Acid Market Revenue (undefined) Forecast, by Application 2020 & 2033
- Table 38: GCC US Fumaric Acid Market Revenue (undefined) Forecast, by Application 2020 & 2033
- Table 39: North Africa US Fumaric Acid Market Revenue (undefined) Forecast, by Application 2020 & 2033
- Table 40: South Africa US Fumaric Acid Market Revenue (undefined) Forecast, by Application 2020 & 2033
- Table 41: Rest of Middle East & Africa US Fumaric Acid Market Revenue (undefined) Forecast, by Application 2020 & 2033
- Table 42: Global US Fumaric Acid Market Revenue undefined Forecast, by Type 2020 & 2033
- Table 43: Global US Fumaric Acid Market Revenue undefined Forecast, by Application 2020 & 2033
- Table 44: Global US Fumaric Acid Market Revenue undefined Forecast, by End-user Industry 2020 & 2033
- Table 45: Global US Fumaric Acid Market Revenue undefined Forecast, by Country 2020 & 2033
- Table 46: China US Fumaric Acid Market Revenue (undefined) Forecast, by Application 2020 & 2033
- Table 47: India US Fumaric Acid Market Revenue (undefined) Forecast, by Application 2020 & 2033
- Table 48: Japan US Fumaric Acid Market Revenue (undefined) Forecast, by Application 2020 & 2033
- Table 49: South Korea US Fumaric Acid Market Revenue (undefined) Forecast, by Application 2020 & 2033
- Table 50: ASEAN US Fumaric Acid Market Revenue (undefined) Forecast, by Application 2020 & 2033
- Table 51: Oceania US Fumaric Acid Market Revenue (undefined) Forecast, by Application 2020 & 2033
- Table 52: Rest of Asia Pacific US Fumaric Acid Market Revenue (undefined) Forecast, by Application 2020 & 2033
Frequently Asked Questions
1. What is the projected Compound Annual Growth Rate (CAGR) of the US Fumaric Acid Market?
The projected CAGR is approximately 5.41%.
2. Which companies are prominent players in the US Fumaric Acid Market?
Key companies in the market include Thirumalai Chemicals Ltd*List Not Exhaustive, Changmao Biochemical Engineering Company Limited, Fuso Chemical Co Ltd, Anmol Chemicals, Actylis, Merck KGaA, NIPPON SHOKUBAI CO LTD, Polynt SpA.
3. What are the main segments of the US Fumaric Acid Market?
The market segments include Type, Application, End-user Industry.
4. Can you provide details about the market size?
The market size is estimated to be USD XXX N/A as of 2022.
5. What are some drivers contributing to market growth?
Increasing Demand from Food and Beverage Industry; Growing Application in Pharmaceutical Industry; Other Drivers.
6. What are the notable trends driving market growth?
Food and Beverage Sector to Dominate the Market.
7. Are there any restraints impacting market growth?
Health hazard Related to Fumaric Acid; Other Restraints.
8. Can you provide examples of recent developments in the market?
N/A
9. What pricing options are available for accessing the report?
Pricing options include single-user, multi-user, and enterprise licenses priced at USD 3800, USD 4500, and USD 5800 respectively.
10. Is the market size provided in terms of value or volume?
The market size is provided in terms of value, measured in N/A.
11. Are there any specific market keywords associated with the report?
Yes, the market keyword associated with the report is "US Fumaric Acid Market," which aids in identifying and referencing the specific market segment covered.
12. How do I determine which pricing option suits my needs best?
The pricing options vary based on user requirements and access needs. Individual users may opt for single-user licenses, while businesses requiring broader access may choose multi-user or enterprise licenses for cost-effective access to the report.
13. Are there any additional resources or data provided in the US Fumaric Acid Market report?
While the report offers comprehensive insights, it's advisable to review the specific contents or supplementary materials provided to ascertain if additional resources or data are available.
14. How can I stay updated on further developments or reports in the US Fumaric Acid Market?
To stay informed about further developments, trends, and reports in the US Fumaric Acid Market, consider subscribing to industry newsletters, following relevant companies and organizations, or regularly checking reputable industry news sources and publications.
Methodology
Step 1 - Identification of Relevant Samples Size from Population Database


Step 2 - Approaches for Defining Global Market Size (Value, Volume* & Price*)

Note*: In applicable scenarios
Step 3 - Data Sources
Primary Research
- Web Analytics
- Survey Reports
- Research Institute
- Latest Research Reports
- Opinion Leaders
Secondary Research
- Annual Reports
- White Paper
- Latest Press Release
- Industry Association
- Paid Database
- Investor Presentations

Step 4 - Data Triangulation
Involves using different sources of information in order to increase the validity of a study
These sources are likely to be stakeholders in a program - participants, other researchers, program staff, other community members, and so on.
Then we put all data in single framework & apply various statistical tools to find out the dynamic on the market.
During the analysis stage, feedback from the stakeholder groups would be compared to determine areas of agreement as well as areas of divergence