

Key Insights
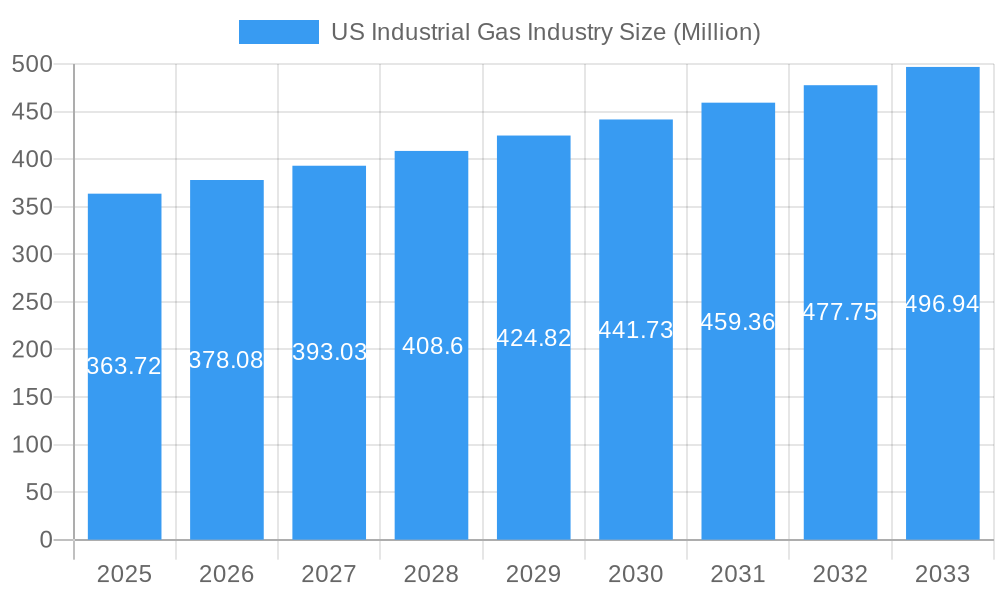
The US industrial gas market, valued at $363.72 million in 2025, is projected to experience steady growth, driven by increasing demand across various end-use industries. A Compound Annual Growth Rate (CAGR) of 3.79% from 2025 to 2033 indicates a substantial market expansion over the forecast period. Key drivers include the burgeoning oil and gas sector, the expanding petrochemical and chemical manufacturing industries, and the growing need for medical and pharmaceutical gases. Technological advancements in gas production and delivery systems, along with a rising focus on energy efficiency and sustainability, are also contributing to market growth. Growth may be slightly tempered by fluctuations in raw material prices and potential regulatory changes impacting industrial production. The market is segmented by product type (nitrogen, oxygen, carbon dioxide, hydrogen, helium, argon, ammonia, methane, propane, butane, and others) and end-user industry (oil and gas, energy and power, petrochemical and chemical manufacturing, medical and pharmaceutical, food and beverage, metal manufacturing and fabrication, transportation, and others). Major players like Linde PLC, Air Products and Chemicals Inc., and Air Liquide are actively shaping the market through strategic investments, technological innovations, and mergers and acquisitions. Regional variations in growth rates are expected, with regions like the Southwest and West potentially exhibiting stronger growth due to robust industrial activity. The overall outlook remains positive, reflecting the indispensable role of industrial gases in numerous key economic sectors.
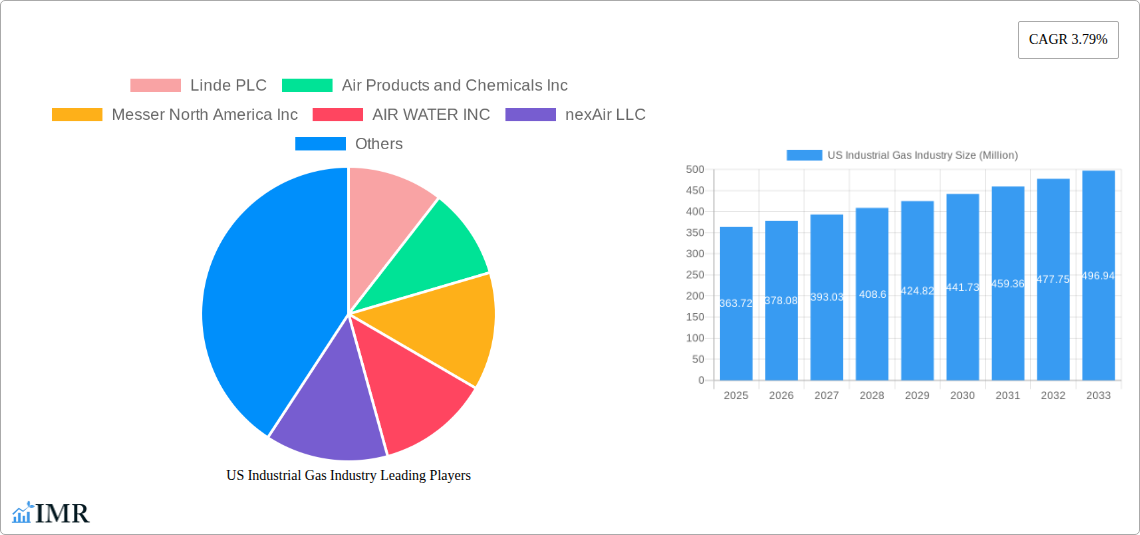
US Industrial Gas Industry Market Size (In Million)
The regional breakdown within the United States suggests varied growth trajectories. While precise data for each region (Northeast, Southeast, Midwest, Southwest, West) is unavailable, a reasonable estimation based on existing industrial concentrations and economic activity would show the Southwest and West regions exhibiting potentially higher growth rates than the others. This is largely due to the concentration of energy and technology industries in those areas. The Northeast and Midwest, with their established manufacturing bases, are also likely to experience solid growth, albeit potentially at a slightly slower pace than the western regions. The Southeast, with a more diversified industrial landscape, might show moderate growth. This regional analysis underscores the importance of understanding the geographic nuances within the US market for effective business strategy and investment decisions. Further detailed regional analysis would require more specific data, but the present data strongly suggests a dynamic and diverse market landscape.
US Industrial Gas Industry Company Market Share
US Industrial Gas Industry Market Report: 2019-2033
This comprehensive report provides an in-depth analysis of the US industrial gas market, offering invaluable insights for industry professionals, investors, and strategic decision-makers. Covering the period 2019-2033, with a focus on 2025, this report meticulously examines market dynamics, growth trends, and future prospects across various segments and key players. The report leverages extensive data analysis to provide a clear and actionable understanding of this crucial sector.
US Industrial Gas Industry Market Dynamics & Structure
The US industrial gas market, valued at xx million in 2024, is characterized by a moderately concentrated structure dominated by a few major players. Market share is largely determined by production capacity, distribution network reach, and technological capabilities. Technological innovation, particularly in gas purification and delivery systems, plays a vital role in driving market growth and enhancing efficiency. Stringent environmental regulations, focused on emissions reduction and safety protocols, significantly influence industry practices and investment strategies. The market experiences competitive pressure from substitute products in specific applications. End-user demographics, particularly the growth of energy-intensive industries and the expanding medical sector, significantly impact demand. Mergers and acquisitions (M&A) activities are frequent, reflecting consolidation efforts and the pursuit of market leadership and geographic expansion.
- Market Concentration: High, with top 5 players holding approximately xx% market share in 2024.
- Technological Innovation: Driven by efficiency improvements, renewable energy integration, and advanced gas separation techniques.
- Regulatory Framework: Stringent environmental regulations impacting operational costs and investment decisions.
- Competitive Substitutes: Limited in many applications, but notable in specific niche segments.
- M&A Activity: Significant in recent years, contributing to market consolidation and expansion. xx major M&A deals were recorded between 2019 and 2024.
US Industrial Gas Industry Growth Trends & Insights
The US industrial gas market exhibited a CAGR of xx% during the historical period (2019-2024), driven by strong demand from various end-user industries. Adoption rates for advanced gas delivery systems are increasing steadily, reflecting a shift towards enhanced efficiency and safety. Technological disruptions, such as the rise of renewable energy sources and the increasing adoption of hydrogen-based solutions, are reshaping market dynamics. Consumer behavior shifts, including a growing emphasis on sustainability and environmental responsibility, are influencing procurement decisions and driving demand for eco-friendly gas production and delivery methods. Market penetration for specific gas types varies significantly based on end-user applications and regional development patterns. The forecast period (2025-2033) anticipates continued growth, albeit at a slightly moderated pace, propelled by ongoing industrial expansion and technological advancements. The market is expected to reach xx million by 2033 with a projected CAGR of xx%.
Dominant Regions, Countries, or Segments in US Industrial Gas Industry
The US industrial gas market showcases diverse regional growth patterns. Texas and California emerge as leading regions due to concentrated industrial activity, particularly in oil and gas, petrochemicals, and technology. The Petrochemical and Chemical Manufacturing segment represents the largest end-user industry segment, driven by robust production activity and continued investment in plant expansions. Nitrogen and Oxygen dominate the product type segment, reflecting their extensive use in various industrial processes.
- Key Drivers: Robust industrial growth, particularly in the petrochemical and energy sectors; increasing adoption of advanced technologies; supportive government policies promoting industrial development.
- Dominance Factors: Strong industrial base in certain regions; established infrastructure supporting gas production, storage, and distribution; the critical role of gases in numerous manufacturing processes.
US Industrial Gas Industry Product Landscape
The industrial gas market is characterized by a range of products, with ongoing innovation focusing on enhancing purity, delivery efficiency, and safety. Advancements include improved gas separation technologies, advanced cryogenic storage solutions, and innovative delivery systems optimized for different applications. Unique selling propositions often focus on purity levels, customized delivery options, and comprehensive service packages. Technological advancements are driven by increased automation, digitalization, and data analytics to optimize gas production, distribution, and use.
Key Drivers, Barriers & Challenges in US Industrial Gas Industry
Key Drivers: The market is fueled by increasing industrial output, expanding energy sectors (particularly renewable energy), and growing demand from the healthcare and food & beverage industries. Government policies promoting cleaner energy and manufacturing contribute positively.
Challenges: Supply chain disruptions can cause volatility in pricing and availability. Stringent environmental regulations necessitate significant investment in emission control technologies and sustainable practices. Intense competition necessitates continuous innovation and cost optimization strategies.
Emerging Opportunities in US Industrial Gas Industry
Emerging opportunities lie in hydrogen production for fuel cell applications, supporting the growth of the hydrogen economy. The increasing demand for high-purity gases in semiconductor manufacturing represents a significant growth avenue. Innovation in gas delivery systems, focused on efficiency and sustainability, offers further expansion possibilities.
Growth Accelerators in the US Industrial Gas Industry Industry
Long-term growth is propelled by the rising adoption of renewable energy sources, driving demand for gases in related technologies. Strategic partnerships between gas producers and end-users facilitate collaboration and customized solutions. Expansions into emerging markets and geographic diversification contribute to sustainable growth.
Key Players Shaping the US Industrial Gas Industry Market
- Linde PLC
- Air Products and Chemicals Inc
- Messer North America Inc
- AIR WATER INC
- nexAir LLC
- Matheson Tri-Gas Inc
- BASF SE
- Iwatani Corporation
- NIPPON SANSO HOLDINGS CORPORATION
- Air Liquide
- UIG
- *List Not Exhaustive
Notable Milestones in US Industrial Gas Industry Sector
- May 2022: Air Liquide's USD 250 million investment in a liquid hydrogen production facility in Nevada highlights the growing focus on hydrogen energy.
- January 2023: Iwatani Corporation's acquisition of Aspen Air US signals a new entrant's ambition in the US industrial gas market.
In-Depth US Industrial Gas Industry Market Outlook
The US industrial gas market is poised for continued growth, driven by sustained industrial activity and technological advancements. Strategic investments in renewable energy, hydrogen production, and high-purity gas applications present significant opportunities. Companies that successfully navigate regulatory landscapes and embrace innovation will be best positioned to capture future market share.
US Industrial Gas Industry Segmentation
-
1. Product Type
- 1.1. Nitrogen
- 1.2. Oxygen
- 1.3. Carbon Dioxide
- 1.4. Hydrogen
- 1.5. Helium
- 1.6. Argon
- 1.7. Ammonia
- 1.8. Methane
- 1.9. Propane
- 1.10. Butane
- 1.11. Other Product Types
-
2. End-User Industry
- 2.1. Oil and Gas
- 2.2. Energy and Power
- 2.3. Petrochemical and Chemical Manufacturing
- 2.4. Medical and Pharmaceutical
- 2.5. Food and Beverage
- 2.6. Metal Manufacturing and Fabrication
- 2.7. Transportation
- 2.8. Other En
US Industrial Gas Industry Segmentation By Geography
-
1. North America
- 1.1. United States
- 1.2. Canada
- 1.3. Mexico
-
2. South America
- 2.1. Brazil
- 2.2. Argentina
- 2.3. Rest of South America
-
3. Europe
- 3.1. United Kingdom
- 3.2. Germany
- 3.3. France
- 3.4. Italy
- 3.5. Spain
- 3.6. Russia
- 3.7. Benelux
- 3.8. Nordics
- 3.9. Rest of Europe
-
4. Middle East & Africa
- 4.1. Turkey
- 4.2. Israel
- 4.3. GCC
- 4.4. North Africa
- 4.5. South Africa
- 4.6. Rest of Middle East & Africa
-
5. Asia Pacific
- 5.1. China
- 5.2. India
- 5.3. Japan
- 5.4. South Korea
- 5.5. ASEAN
- 5.6. Oceania
- 5.7. Rest of Asia Pacific

US Industrial Gas Industry Regional Market Share
Geographic Coverage of US Industrial Gas Industry
US Industrial Gas Industry REPORT HIGHLIGHTS
| Aspects | Details |
|---|---|
| Study Period | 2020-2034 |
| Base Year | 2025 |
| Estimated Year | 2026 |
| Forecast Period | 2026-2034 |
| Historical Period | 2020-2025 |
| Growth Rate | CAGR of 3.79% from 2020-2034 |
| Segmentation |
|
Table of Contents
- 1. Introduction
- 1.1. Research Scope
- 1.2. Market Segmentation
- 1.3. Research Objective
- 1.4. Definitions and Assumptions
- 2. Executive Summary
- 2.1. Market Snapshot
- 3. Market Dynamics
- 3.1. Market Drivers
- 3.2. Market Restrains
- 3.3. Market Trends
- 3.4. Market Opportunities
- 4. Market Factor Analysis
- 4.1. Porters Five Forces
- 4.1.1. Bargaining Power of Suppliers
- 4.1.2. Bargaining Power of Buyers
- 4.1.3. Threat of New Entrants
- 4.1.4. Threat of Substitutes
- 4.1.5. Competitive Rivalry
- 4.2. PESTEL analysis
- 4.3. BCG Analysis
- 4.3.1. Stars (High Growth, High Market Share)
- 4.3.2. Cash Cows (Low Growth, High Market Share)
- 4.3.3. Question Mark (High Growth, Low Market Share)
- 4.3.4. Dogs (Low Growth, Low Market Share)
- 4.4. Ansoff Matrix Analysis
- 4.5. Supply Chain Analysis
- 4.6. Regulatory Landscape
- 4.7. Current Market Potential and Opportunity Assessment (TAM–SAM–SOM Framework)
- 4.8. IMR Analyst Note
- 4.1. Porters Five Forces
- 5. Market Analysis, Insights and Forecast 2021-2033
- 5.1. Market Analysis, Insights and Forecast - by Product Type
- 5.1.1. Nitrogen
- 5.1.2. Oxygen
- 5.1.3. Carbon Dioxide
- 5.1.4. Hydrogen
- 5.1.5. Helium
- 5.1.6. Argon
- 5.1.7. Ammonia
- 5.1.8. Methane
- 5.1.9. Propane
- 5.1.10. Butane
- 5.1.11. Other Product Types
- 5.2. Market Analysis, Insights and Forecast - by End-User Industry
- 5.2.1. Oil and Gas
- 5.2.2. Energy and Power
- 5.2.3. Petrochemical and Chemical Manufacturing
- 5.2.4. Medical and Pharmaceutical
- 5.2.5. Food and Beverage
- 5.2.6. Metal Manufacturing and Fabrication
- 5.2.7. Transportation
- 5.2.8. Other En
- 5.3. Market Analysis, Insights and Forecast - by Region
- 5.3.1. North America
- 5.3.2. South America
- 5.3.3. Europe
- 5.3.4. Middle East & Africa
- 5.3.5. Asia Pacific
- 5.1. Market Analysis, Insights and Forecast - by Product Type
- 6. Global US Industrial Gas Industry Analysis, Insights and Forecast, 2021-2033
- 6.1. Market Analysis, Insights and Forecast - by Product Type
- 6.1.1. Nitrogen
- 6.1.2. Oxygen
- 6.1.3. Carbon Dioxide
- 6.1.4. Hydrogen
- 6.1.5. Helium
- 6.1.6. Argon
- 6.1.7. Ammonia
- 6.1.8. Methane
- 6.1.9. Propane
- 6.1.10. Butane
- 6.1.11. Other Product Types
- 6.2. Market Analysis, Insights and Forecast - by End-User Industry
- 6.2.1. Oil and Gas
- 6.2.2. Energy and Power
- 6.2.3. Petrochemical and Chemical Manufacturing
- 6.2.4. Medical and Pharmaceutical
- 6.2.5. Food and Beverage
- 6.2.6. Metal Manufacturing and Fabrication
- 6.2.7. Transportation
- 6.2.8. Other En
- 6.1. Market Analysis, Insights and Forecast - by Product Type
- 7. North America US Industrial Gas Industry Analysis, Insights and Forecast, 2020-2032
- 7.1. Market Analysis, Insights and Forecast - by Product Type
- 7.1.1. Nitrogen
- 7.1.2. Oxygen
- 7.1.3. Carbon Dioxide
- 7.1.4. Hydrogen
- 7.1.5. Helium
- 7.1.6. Argon
- 7.1.7. Ammonia
- 7.1.8. Methane
- 7.1.9. Propane
- 7.1.10. Butane
- 7.1.11. Other Product Types
- 7.2. Market Analysis, Insights and Forecast - by End-User Industry
- 7.2.1. Oil and Gas
- 7.2.2. Energy and Power
- 7.2.3. Petrochemical and Chemical Manufacturing
- 7.2.4. Medical and Pharmaceutical
- 7.2.5. Food and Beverage
- 7.2.6. Metal Manufacturing and Fabrication
- 7.2.7. Transportation
- 7.2.8. Other En
- 7.1. Market Analysis, Insights and Forecast - by Product Type
- 8. South America US Industrial Gas Industry Analysis, Insights and Forecast, 2020-2032
- 8.1. Market Analysis, Insights and Forecast - by Product Type
- 8.1.1. Nitrogen
- 8.1.2. Oxygen
- 8.1.3. Carbon Dioxide
- 8.1.4. Hydrogen
- 8.1.5. Helium
- 8.1.6. Argon
- 8.1.7. Ammonia
- 8.1.8. Methane
- 8.1.9. Propane
- 8.1.10. Butane
- 8.1.11. Other Product Types
- 8.2. Market Analysis, Insights and Forecast - by End-User Industry
- 8.2.1. Oil and Gas
- 8.2.2. Energy and Power
- 8.2.3. Petrochemical and Chemical Manufacturing
- 8.2.4. Medical and Pharmaceutical
- 8.2.5. Food and Beverage
- 8.2.6. Metal Manufacturing and Fabrication
- 8.2.7. Transportation
- 8.2.8. Other En
- 8.1. Market Analysis, Insights and Forecast - by Product Type
- 9. Europe US Industrial Gas Industry Analysis, Insights and Forecast, 2020-2032
- 9.1. Market Analysis, Insights and Forecast - by Product Type
- 9.1.1. Nitrogen
- 9.1.2. Oxygen
- 9.1.3. Carbon Dioxide
- 9.1.4. Hydrogen
- 9.1.5. Helium
- 9.1.6. Argon
- 9.1.7. Ammonia
- 9.1.8. Methane
- 9.1.9. Propane
- 9.1.10. Butane
- 9.1.11. Other Product Types
- 9.2. Market Analysis, Insights and Forecast - by End-User Industry
- 9.2.1. Oil and Gas
- 9.2.2. Energy and Power
- 9.2.3. Petrochemical and Chemical Manufacturing
- 9.2.4. Medical and Pharmaceutical
- 9.2.5. Food and Beverage
- 9.2.6. Metal Manufacturing and Fabrication
- 9.2.7. Transportation
- 9.2.8. Other En
- 9.1. Market Analysis, Insights and Forecast - by Product Type
- 10. Middle East & Africa US Industrial Gas Industry Analysis, Insights and Forecast, 2020-2032
- 10.1. Market Analysis, Insights and Forecast - by Product Type
- 10.1.1. Nitrogen
- 10.1.2. Oxygen
- 10.1.3. Carbon Dioxide
- 10.1.4. Hydrogen
- 10.1.5. Helium
- 10.1.6. Argon
- 10.1.7. Ammonia
- 10.1.8. Methane
- 10.1.9. Propane
- 10.1.10. Butane
- 10.1.11. Other Product Types
- 10.2. Market Analysis, Insights and Forecast - by End-User Industry
- 10.2.1. Oil and Gas
- 10.2.2. Energy and Power
- 10.2.3. Petrochemical and Chemical Manufacturing
- 10.2.4. Medical and Pharmaceutical
- 10.2.5. Food and Beverage
- 10.2.6. Metal Manufacturing and Fabrication
- 10.2.7. Transportation
- 10.2.8. Other En
- 10.1. Market Analysis, Insights and Forecast - by Product Type
- 11. Asia Pacific US Industrial Gas Industry Analysis, Insights and Forecast, 2020-2032
- 11.1. Market Analysis, Insights and Forecast - by Product Type
- 11.1.1. Nitrogen
- 11.1.2. Oxygen
- 11.1.3. Carbon Dioxide
- 11.1.4. Hydrogen
- 11.1.5. Helium
- 11.1.6. Argon
- 11.1.7. Ammonia
- 11.1.8. Methane
- 11.1.9. Propane
- 11.1.10. Butane
- 11.1.11. Other Product Types
- 11.2. Market Analysis, Insights and Forecast - by End-User Industry
- 11.2.1. Oil and Gas
- 11.2.2. Energy and Power
- 11.2.3. Petrochemical and Chemical Manufacturing
- 11.2.4. Medical and Pharmaceutical
- 11.2.5. Food and Beverage
- 11.2.6. Metal Manufacturing and Fabrication
- 11.2.7. Transportation
- 11.2.8. Other En
- 11.1. Market Analysis, Insights and Forecast - by Product Type
- 12. Competitive Analysis
- 12.1. Company Profiles
- 12.1.1 Linde PLC
- 12.1.1.1. Company Overview
- 12.1.1.2. Products
- 12.1.1.3. Company Financials
- 12.1.1.4. SWOT Analysis
- 12.1.2 Air Products and Chemicals Inc
- 12.1.2.1. Company Overview
- 12.1.2.2. Products
- 12.1.2.3. Company Financials
- 12.1.2.4. SWOT Analysis
- 12.1.3 Messer North America Inc
- 12.1.3.1. Company Overview
- 12.1.3.2. Products
- 12.1.3.3. Company Financials
- 12.1.3.4. SWOT Analysis
- 12.1.4 AIR WATER INC
- 12.1.4.1. Company Overview
- 12.1.4.2. Products
- 12.1.4.3. Company Financials
- 12.1.4.4. SWOT Analysis
- 12.1.5 nexAir LLC
- 12.1.5.1. Company Overview
- 12.1.5.2. Products
- 12.1.5.3. Company Financials
- 12.1.5.4. SWOT Analysis
- 12.1.6 Matheson Tri-Gas Inc
- 12.1.6.1. Company Overview
- 12.1.6.2. Products
- 12.1.6.3. Company Financials
- 12.1.6.4. SWOT Analysis
- 12.1.7 BASF SE
- 12.1.7.1. Company Overview
- 12.1.7.2. Products
- 12.1.7.3. Company Financials
- 12.1.7.4. SWOT Analysis
- 12.1.8 Iwatani Corporation
- 12.1.8.1. Company Overview
- 12.1.8.2. Products
- 12.1.8.3. Company Financials
- 12.1.8.4. SWOT Analysis
- 12.1.9 NIPPON SANSO HOLDINGS CORPORATION
- 12.1.9.1. Company Overview
- 12.1.9.2. Products
- 12.1.9.3. Company Financials
- 12.1.9.4. SWOT Analysis
- 12.1.10 Air Liquide
- 12.1.10.1. Company Overview
- 12.1.10.2. Products
- 12.1.10.3. Company Financials
- 12.1.10.4. SWOT Analysis
- 12.1.11 UIG*List Not Exhaustive
- 12.1.11.1. Company Overview
- 12.1.11.2. Products
- 12.1.11.3. Company Financials
- 12.1.11.4. SWOT Analysis
- 12.1.1 Linde PLC
- 12.2. Market Entropy
- 12.2.1 Company's Key Areas Served
- 12.2.2 Recent Developments
- 12.3. Company Market Share Analysis 2025
- 12.3.1 Top 5 Companies Market Share Analysis
- 12.3.2 Top 3 Companies Market Share Analysis
- 12.4. List of Potential Customers
- 13. Research Methodology
List of Figures
- Figure 1: Global US Industrial Gas Industry Revenue Breakdown (Million, %) by Region 2025 & 2033
- Figure 2: Global US Industrial Gas Industry Volume Breakdown (K Tons, %) by Region 2025 & 2033
- Figure 3: North America US Industrial Gas Industry Revenue (Million), by Product Type 2025 & 2033
- Figure 4: North America US Industrial Gas Industry Volume (K Tons), by Product Type 2025 & 2033
- Figure 5: North America US Industrial Gas Industry Revenue Share (%), by Product Type 2025 & 2033
- Figure 6: North America US Industrial Gas Industry Volume Share (%), by Product Type 2025 & 2033
- Figure 7: North America US Industrial Gas Industry Revenue (Million), by End-User Industry 2025 & 2033
- Figure 8: North America US Industrial Gas Industry Volume (K Tons), by End-User Industry 2025 & 2033
- Figure 9: North America US Industrial Gas Industry Revenue Share (%), by End-User Industry 2025 & 2033
- Figure 10: North America US Industrial Gas Industry Volume Share (%), by End-User Industry 2025 & 2033
- Figure 11: North America US Industrial Gas Industry Revenue (Million), by Country 2025 & 2033
- Figure 12: North America US Industrial Gas Industry Volume (K Tons), by Country 2025 & 2033
- Figure 13: North America US Industrial Gas Industry Revenue Share (%), by Country 2025 & 2033
- Figure 14: North America US Industrial Gas Industry Volume Share (%), by Country 2025 & 2033
- Figure 15: South America US Industrial Gas Industry Revenue (Million), by Product Type 2025 & 2033
- Figure 16: South America US Industrial Gas Industry Volume (K Tons), by Product Type 2025 & 2033
- Figure 17: South America US Industrial Gas Industry Revenue Share (%), by Product Type 2025 & 2033
- Figure 18: South America US Industrial Gas Industry Volume Share (%), by Product Type 2025 & 2033
- Figure 19: South America US Industrial Gas Industry Revenue (Million), by End-User Industry 2025 & 2033
- Figure 20: South America US Industrial Gas Industry Volume (K Tons), by End-User Industry 2025 & 2033
- Figure 21: South America US Industrial Gas Industry Revenue Share (%), by End-User Industry 2025 & 2033
- Figure 22: South America US Industrial Gas Industry Volume Share (%), by End-User Industry 2025 & 2033
- Figure 23: South America US Industrial Gas Industry Revenue (Million), by Country 2025 & 2033
- Figure 24: South America US Industrial Gas Industry Volume (K Tons), by Country 2025 & 2033
- Figure 25: South America US Industrial Gas Industry Revenue Share (%), by Country 2025 & 2033
- Figure 26: South America US Industrial Gas Industry Volume Share (%), by Country 2025 & 2033
- Figure 27: Europe US Industrial Gas Industry Revenue (Million), by Product Type 2025 & 2033
- Figure 28: Europe US Industrial Gas Industry Volume (K Tons), by Product Type 2025 & 2033
- Figure 29: Europe US Industrial Gas Industry Revenue Share (%), by Product Type 2025 & 2033
- Figure 30: Europe US Industrial Gas Industry Volume Share (%), by Product Type 2025 & 2033
- Figure 31: Europe US Industrial Gas Industry Revenue (Million), by End-User Industry 2025 & 2033
- Figure 32: Europe US Industrial Gas Industry Volume (K Tons), by End-User Industry 2025 & 2033
- Figure 33: Europe US Industrial Gas Industry Revenue Share (%), by End-User Industry 2025 & 2033
- Figure 34: Europe US Industrial Gas Industry Volume Share (%), by End-User Industry 2025 & 2033
- Figure 35: Europe US Industrial Gas Industry Revenue (Million), by Country 2025 & 2033
- Figure 36: Europe US Industrial Gas Industry Volume (K Tons), by Country 2025 & 2033
- Figure 37: Europe US Industrial Gas Industry Revenue Share (%), by Country 2025 & 2033
- Figure 38: Europe US Industrial Gas Industry Volume Share (%), by Country 2025 & 2033
- Figure 39: Middle East & Africa US Industrial Gas Industry Revenue (Million), by Product Type 2025 & 2033
- Figure 40: Middle East & Africa US Industrial Gas Industry Volume (K Tons), by Product Type 2025 & 2033
- Figure 41: Middle East & Africa US Industrial Gas Industry Revenue Share (%), by Product Type 2025 & 2033
- Figure 42: Middle East & Africa US Industrial Gas Industry Volume Share (%), by Product Type 2025 & 2033
- Figure 43: Middle East & Africa US Industrial Gas Industry Revenue (Million), by End-User Industry 2025 & 2033
- Figure 44: Middle East & Africa US Industrial Gas Industry Volume (K Tons), by End-User Industry 2025 & 2033
- Figure 45: Middle East & Africa US Industrial Gas Industry Revenue Share (%), by End-User Industry 2025 & 2033
- Figure 46: Middle East & Africa US Industrial Gas Industry Volume Share (%), by End-User Industry 2025 & 2033
- Figure 47: Middle East & Africa US Industrial Gas Industry Revenue (Million), by Country 2025 & 2033
- Figure 48: Middle East & Africa US Industrial Gas Industry Volume (K Tons), by Country 2025 & 2033
- Figure 49: Middle East & Africa US Industrial Gas Industry Revenue Share (%), by Country 2025 & 2033
- Figure 50: Middle East & Africa US Industrial Gas Industry Volume Share (%), by Country 2025 & 2033
- Figure 51: Asia Pacific US Industrial Gas Industry Revenue (Million), by Product Type 2025 & 2033
- Figure 52: Asia Pacific US Industrial Gas Industry Volume (K Tons), by Product Type 2025 & 2033
- Figure 53: Asia Pacific US Industrial Gas Industry Revenue Share (%), by Product Type 2025 & 2033
- Figure 54: Asia Pacific US Industrial Gas Industry Volume Share (%), by Product Type 2025 & 2033
- Figure 55: Asia Pacific US Industrial Gas Industry Revenue (Million), by End-User Industry 2025 & 2033
- Figure 56: Asia Pacific US Industrial Gas Industry Volume (K Tons), by End-User Industry 2025 & 2033
- Figure 57: Asia Pacific US Industrial Gas Industry Revenue Share (%), by End-User Industry 2025 & 2033
- Figure 58: Asia Pacific US Industrial Gas Industry Volume Share (%), by End-User Industry 2025 & 2033
- Figure 59: Asia Pacific US Industrial Gas Industry Revenue (Million), by Country 2025 & 2033
- Figure 60: Asia Pacific US Industrial Gas Industry Volume (K Tons), by Country 2025 & 2033
- Figure 61: Asia Pacific US Industrial Gas Industry Revenue Share (%), by Country 2025 & 2033
- Figure 62: Asia Pacific US Industrial Gas Industry Volume Share (%), by Country 2025 & 2033
List of Tables
- Table 1: Global US Industrial Gas Industry Revenue Million Forecast, by Product Type 2020 & 2033
- Table 2: Global US Industrial Gas Industry Volume K Tons Forecast, by Product Type 2020 & 2033
- Table 3: Global US Industrial Gas Industry Revenue Million Forecast, by End-User Industry 2020 & 2033
- Table 4: Global US Industrial Gas Industry Volume K Tons Forecast, by End-User Industry 2020 & 2033
- Table 5: Global US Industrial Gas Industry Revenue Million Forecast, by Region 2020 & 2033
- Table 6: Global US Industrial Gas Industry Volume K Tons Forecast, by Region 2020 & 2033
- Table 7: Global US Industrial Gas Industry Revenue Million Forecast, by Product Type 2020 & 2033
- Table 8: Global US Industrial Gas Industry Volume K Tons Forecast, by Product Type 2020 & 2033
- Table 9: Global US Industrial Gas Industry Revenue Million Forecast, by End-User Industry 2020 & 2033
- Table 10: Global US Industrial Gas Industry Volume K Tons Forecast, by End-User Industry 2020 & 2033
- Table 11: Global US Industrial Gas Industry Revenue Million Forecast, by Country 2020 & 2033
- Table 12: Global US Industrial Gas Industry Volume K Tons Forecast, by Country 2020 & 2033
- Table 13: United States US Industrial Gas Industry Revenue (Million) Forecast, by Application 2020 & 2033
- Table 14: United States US Industrial Gas Industry Volume (K Tons) Forecast, by Application 2020 & 2033
- Table 15: Canada US Industrial Gas Industry Revenue (Million) Forecast, by Application 2020 & 2033
- Table 16: Canada US Industrial Gas Industry Volume (K Tons) Forecast, by Application 2020 & 2033
- Table 17: Mexico US Industrial Gas Industry Revenue (Million) Forecast, by Application 2020 & 2033
- Table 18: Mexico US Industrial Gas Industry Volume (K Tons) Forecast, by Application 2020 & 2033
- Table 19: Global US Industrial Gas Industry Revenue Million Forecast, by Product Type 2020 & 2033
- Table 20: Global US Industrial Gas Industry Volume K Tons Forecast, by Product Type 2020 & 2033
- Table 21: Global US Industrial Gas Industry Revenue Million Forecast, by End-User Industry 2020 & 2033
- Table 22: Global US Industrial Gas Industry Volume K Tons Forecast, by End-User Industry 2020 & 2033
- Table 23: Global US Industrial Gas Industry Revenue Million Forecast, by Country 2020 & 2033
- Table 24: Global US Industrial Gas Industry Volume K Tons Forecast, by Country 2020 & 2033
- Table 25: Brazil US Industrial Gas Industry Revenue (Million) Forecast, by Application 2020 & 2033
- Table 26: Brazil US Industrial Gas Industry Volume (K Tons) Forecast, by Application 2020 & 2033
- Table 27: Argentina US Industrial Gas Industry Revenue (Million) Forecast, by Application 2020 & 2033
- Table 28: Argentina US Industrial Gas Industry Volume (K Tons) Forecast, by Application 2020 & 2033
- Table 29: Rest of South America US Industrial Gas Industry Revenue (Million) Forecast, by Application 2020 & 2033
- Table 30: Rest of South America US Industrial Gas Industry Volume (K Tons) Forecast, by Application 2020 & 2033
- Table 31: Global US Industrial Gas Industry Revenue Million Forecast, by Product Type 2020 & 2033
- Table 32: Global US Industrial Gas Industry Volume K Tons Forecast, by Product Type 2020 & 2033
- Table 33: Global US Industrial Gas Industry Revenue Million Forecast, by End-User Industry 2020 & 2033
- Table 34: Global US Industrial Gas Industry Volume K Tons Forecast, by End-User Industry 2020 & 2033
- Table 35: Global US Industrial Gas Industry Revenue Million Forecast, by Country 2020 & 2033
- Table 36: Global US Industrial Gas Industry Volume K Tons Forecast, by Country 2020 & 2033
- Table 37: United Kingdom US Industrial Gas Industry Revenue (Million) Forecast, by Application 2020 & 2033
- Table 38: United Kingdom US Industrial Gas Industry Volume (K Tons) Forecast, by Application 2020 & 2033
- Table 39: Germany US Industrial Gas Industry Revenue (Million) Forecast, by Application 2020 & 2033
- Table 40: Germany US Industrial Gas Industry Volume (K Tons) Forecast, by Application 2020 & 2033
- Table 41: France US Industrial Gas Industry Revenue (Million) Forecast, by Application 2020 & 2033
- Table 42: France US Industrial Gas Industry Volume (K Tons) Forecast, by Application 2020 & 2033
- Table 43: Italy US Industrial Gas Industry Revenue (Million) Forecast, by Application 2020 & 2033
- Table 44: Italy US Industrial Gas Industry Volume (K Tons) Forecast, by Application 2020 & 2033
- Table 45: Spain US Industrial Gas Industry Revenue (Million) Forecast, by Application 2020 & 2033
- Table 46: Spain US Industrial Gas Industry Volume (K Tons) Forecast, by Application 2020 & 2033
- Table 47: Russia US Industrial Gas Industry Revenue (Million) Forecast, by Application 2020 & 2033
- Table 48: Russia US Industrial Gas Industry Volume (K Tons) Forecast, by Application 2020 & 2033
- Table 49: Benelux US Industrial Gas Industry Revenue (Million) Forecast, by Application 2020 & 2033
- Table 50: Benelux US Industrial Gas Industry Volume (K Tons) Forecast, by Application 2020 & 2033
- Table 51: Nordics US Industrial Gas Industry Revenue (Million) Forecast, by Application 2020 & 2033
- Table 52: Nordics US Industrial Gas Industry Volume (K Tons) Forecast, by Application 2020 & 2033
- Table 53: Rest of Europe US Industrial Gas Industry Revenue (Million) Forecast, by Application 2020 & 2033
- Table 54: Rest of Europe US Industrial Gas Industry Volume (K Tons) Forecast, by Application 2020 & 2033
- Table 55: Global US Industrial Gas Industry Revenue Million Forecast, by Product Type 2020 & 2033
- Table 56: Global US Industrial Gas Industry Volume K Tons Forecast, by Product Type 2020 & 2033
- Table 57: Global US Industrial Gas Industry Revenue Million Forecast, by End-User Industry 2020 & 2033
- Table 58: Global US Industrial Gas Industry Volume K Tons Forecast, by End-User Industry 2020 & 2033
- Table 59: Global US Industrial Gas Industry Revenue Million Forecast, by Country 2020 & 2033
- Table 60: Global US Industrial Gas Industry Volume K Tons Forecast, by Country 2020 & 2033
- Table 61: Turkey US Industrial Gas Industry Revenue (Million) Forecast, by Application 2020 & 2033
- Table 62: Turkey US Industrial Gas Industry Volume (K Tons) Forecast, by Application 2020 & 2033
- Table 63: Israel US Industrial Gas Industry Revenue (Million) Forecast, by Application 2020 & 2033
- Table 64: Israel US Industrial Gas Industry Volume (K Tons) Forecast, by Application 2020 & 2033
- Table 65: GCC US Industrial Gas Industry Revenue (Million) Forecast, by Application 2020 & 2033
- Table 66: GCC US Industrial Gas Industry Volume (K Tons) Forecast, by Application 2020 & 2033
- Table 67: North Africa US Industrial Gas Industry Revenue (Million) Forecast, by Application 2020 & 2033
- Table 68: North Africa US Industrial Gas Industry Volume (K Tons) Forecast, by Application 2020 & 2033
- Table 69: South Africa US Industrial Gas Industry Revenue (Million) Forecast, by Application 2020 & 2033
- Table 70: South Africa US Industrial Gas Industry Volume (K Tons) Forecast, by Application 2020 & 2033
- Table 71: Rest of Middle East & Africa US Industrial Gas Industry Revenue (Million) Forecast, by Application 2020 & 2033
- Table 72: Rest of Middle East & Africa US Industrial Gas Industry Volume (K Tons) Forecast, by Application 2020 & 2033
- Table 73: Global US Industrial Gas Industry Revenue Million Forecast, by Product Type 2020 & 2033
- Table 74: Global US Industrial Gas Industry Volume K Tons Forecast, by Product Type 2020 & 2033
- Table 75: Global US Industrial Gas Industry Revenue Million Forecast, by End-User Industry 2020 & 2033
- Table 76: Global US Industrial Gas Industry Volume K Tons Forecast, by End-User Industry 2020 & 2033
- Table 77: Global US Industrial Gas Industry Revenue Million Forecast, by Country 2020 & 2033
- Table 78: Global US Industrial Gas Industry Volume K Tons Forecast, by Country 2020 & 2033
- Table 79: China US Industrial Gas Industry Revenue (Million) Forecast, by Application 2020 & 2033
- Table 80: China US Industrial Gas Industry Volume (K Tons) Forecast, by Application 2020 & 2033
- Table 81: India US Industrial Gas Industry Revenue (Million) Forecast, by Application 2020 & 2033
- Table 82: India US Industrial Gas Industry Volume (K Tons) Forecast, by Application 2020 & 2033
- Table 83: Japan US Industrial Gas Industry Revenue (Million) Forecast, by Application 2020 & 2033
- Table 84: Japan US Industrial Gas Industry Volume (K Tons) Forecast, by Application 2020 & 2033
- Table 85: South Korea US Industrial Gas Industry Revenue (Million) Forecast, by Application 2020 & 2033
- Table 86: South Korea US Industrial Gas Industry Volume (K Tons) Forecast, by Application 2020 & 2033
- Table 87: ASEAN US Industrial Gas Industry Revenue (Million) Forecast, by Application 2020 & 2033
- Table 88: ASEAN US Industrial Gas Industry Volume (K Tons) Forecast, by Application 2020 & 2033
- Table 89: Oceania US Industrial Gas Industry Revenue (Million) Forecast, by Application 2020 & 2033
- Table 90: Oceania US Industrial Gas Industry Volume (K Tons) Forecast, by Application 2020 & 2033
- Table 91: Rest of Asia Pacific US Industrial Gas Industry Revenue (Million) Forecast, by Application 2020 & 2033
- Table 92: Rest of Asia Pacific US Industrial Gas Industry Volume (K Tons) Forecast, by Application 2020 & 2033
Frequently Asked Questions
1. What is the projected Compound Annual Growth Rate (CAGR) of the US Industrial Gas Industry?
The projected CAGR is approximately 3.79%.
2. Which companies are prominent players in the US Industrial Gas Industry?
Key companies in the market include Linde PLC, Air Products and Chemicals Inc, Messer North America Inc, AIR WATER INC, nexAir LLC, Matheson Tri-Gas Inc, BASF SE, Iwatani Corporation, NIPPON SANSO HOLDINGS CORPORATION, Air Liquide, UIG*List Not Exhaustive.
3. What are the main segments of the US Industrial Gas Industry?
The market segments include Product Type, End-User Industry.
4. Can you provide details about the market size?
The market size is estimated to be USD 363.72 Million as of 2022.
5. What are some drivers contributing to market growth?
Increasing Demand from the Healthcare Sector; Increasing Demand for Frozen and Stored Food; Growing Need for Alternate Energy Sources.
6. What are the notable trends driving market growth?
Resilient Demand from the Healthcare Industry.
7. Are there any restraints impacting market growth?
Environmental Regulations and Safety Issues; Other Restraints.
8. Can you provide examples of recent developments in the market?
January 2023: Iwatani Corporation of America, a wholly-owned subsidiary of Iwatani Corporation, announced the acquisition of Aspen Air US, LLC, a leading manufacturer and distributor of bulk liquid industrial gases. This acquisition marks Iwatani's entrance into the United States Industrial Gases sector and highlights the company's expansion focus in this business segment.
9. What pricing options are available for accessing the report?
Pricing options include single-user, multi-user, and enterprise licenses priced at USD 3800, USD 4500, and USD 5800 respectively.
10. Is the market size provided in terms of value or volume?
The market size is provided in terms of value, measured in Million and volume, measured in K Tons.
11. Are there any specific market keywords associated with the report?
Yes, the market keyword associated with the report is "US Industrial Gas Industry," which aids in identifying and referencing the specific market segment covered.
12. How do I determine which pricing option suits my needs best?
The pricing options vary based on user requirements and access needs. Individual users may opt for single-user licenses, while businesses requiring broader access may choose multi-user or enterprise licenses for cost-effective access to the report.
13. Are there any additional resources or data provided in the US Industrial Gas Industry report?
While the report offers comprehensive insights, it's advisable to review the specific contents or supplementary materials provided to ascertain if additional resources or data are available.
14. How can I stay updated on further developments or reports in the US Industrial Gas Industry?
To stay informed about further developments, trends, and reports in the US Industrial Gas Industry, consider subscribing to industry newsletters, following relevant companies and organizations, or regularly checking reputable industry news sources and publications.
Methodology
Step 1 - Identification of Relevant Samples Size from Population Database


Step 2 - Approaches for Defining Global Market Size (Value, Volume* & Price*)

Note*: In applicable scenarios
Step 3 - Data Sources
Primary Research
- Web Analytics
- Survey Reports
- Research Institute
- Latest Research Reports
- Opinion Leaders
Secondary Research
- Annual Reports
- White Paper
- Latest Press Release
- Industry Association
- Paid Database
- Investor Presentations

Step 4 - Data Triangulation
Involves using different sources of information in order to increase the validity of a study
These sources are likely to be stakeholders in a program - participants, other researchers, program staff, other community members, and so on.
Then we put all data in single framework & apply various statistical tools to find out the dynamic on the market.
During the analysis stage, feedback from the stakeholder groups would be compared to determine areas of agreement as well as areas of divergence