

Key Insights
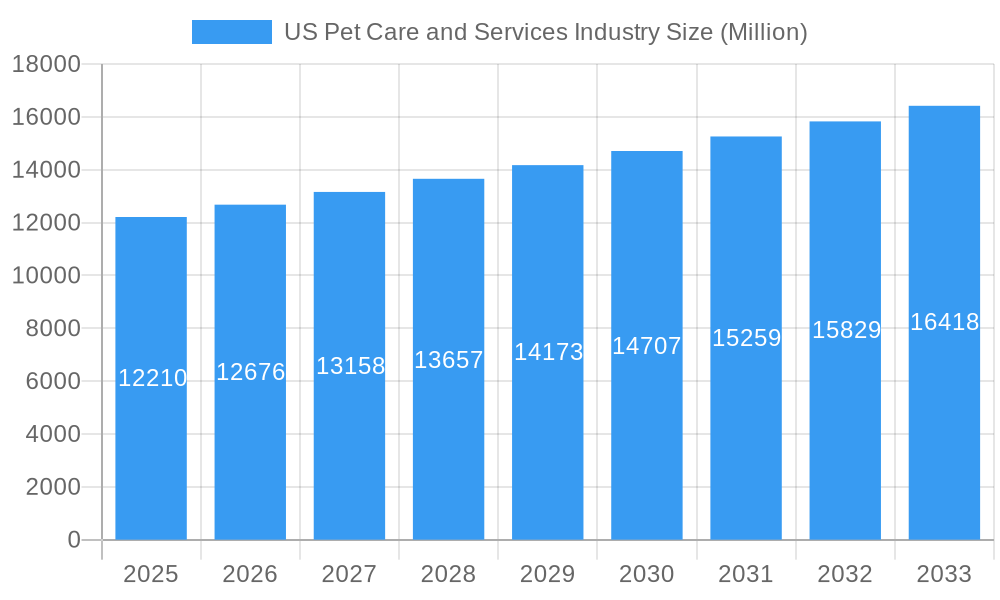
The US pet care and services industry is a robust and expanding market, projected to reach a substantial size. While the provided data indicates a 2025 market size of $12.21 billion and a Compound Annual Growth Rate (CAGR) of 3.51% from 2019-2033, a more granular analysis reveals significant opportunities within specific segments. The increasing humanization of pets is a key driver, fueling demand for premium pet foods, specialized grooming services, and a wider range of pet care options. This trend is evident across all pet types, particularly cats and dogs, but also extends to horses and other animals, driving growth in both product and service categories. The rising disposable incomes within the US population, particularly among millennials and Gen Z who are known for their pet ownership rates, further contributes to this market expansion.
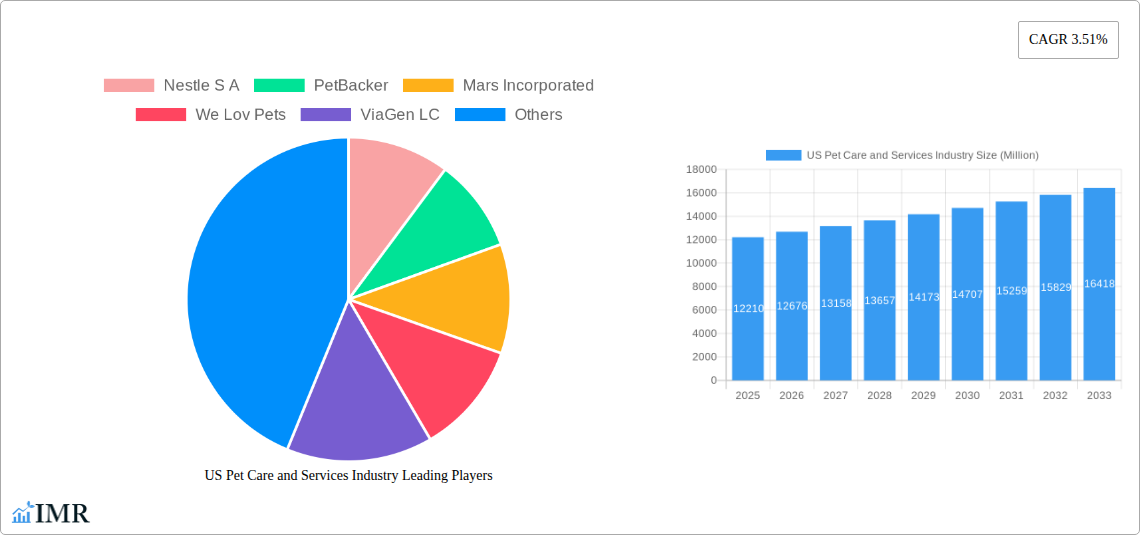
US Pet Care and Services Industry Market Size (In Billion)
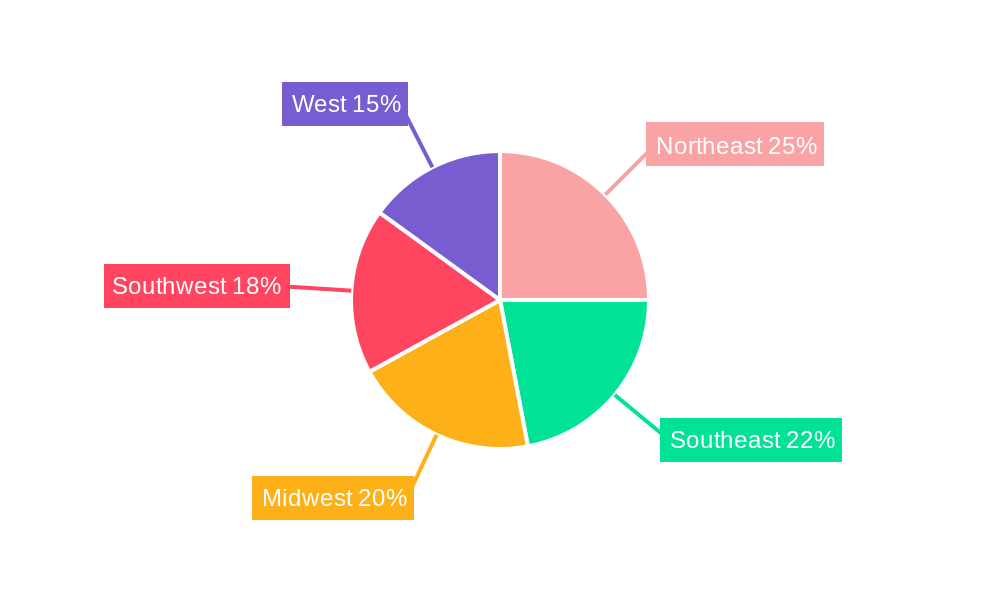
However, economic downturns and potential shifts in consumer spending habits could act as restraints. Competition within the industry, particularly among large corporations like Nestle SA and Mars Incorporated, alongside the rise of smaller, specialized businesses, also influences market dynamics. Geographic variations are expected, with regions like the Northeast and West potentially showing stronger growth due to higher pet ownership density and income levels. The segment analysis reveals opportunities for growth across all service types: from pet grooming and boarding to transportation and walking, reflecting the increasing demand for convenience and personalized pet care solutions. Successful players will need to leverage data-driven insights to understand consumer preferences and offer innovative services that cater to the diverse needs of pet owners.
US Pet Care and Services Industry Company Market Share
This comprehensive report provides a detailed analysis of the US Pet Care and Services industry, offering invaluable insights for businesses, investors, and industry professionals. Covering the period 2019-2033, with a focus on 2025, this report dissects market dynamics, growth trends, key players, and emerging opportunities within this booming sector. The report utilizes a parent-child market approach, segmenting by pet type (cat, dog, horse, other animals), product type (pet food, grooming products, pet care), and service type (grooming, pet transportation, pet boarding, pet sitting, pet walking, other services), providing granular data for informed decision-making.
US Pet Care and Services Industry Market Dynamics & Structure
The US pet care market is a highly dynamic landscape characterized by significant consolidation, rapid technological advancements, and evolving regulatory frameworks. Market concentration is moderate, with several large multinational corporations like Nestle S A and Mars Incorporated holding substantial shares, alongside a diverse range of smaller, specialized businesses. Technological innovation, particularly in areas such as pet health monitoring, personalized nutrition, and on-demand services, is a key driver of growth. However, barriers to innovation exist, including high R&D costs and stringent regulatory approvals. The increasing humanization of pets fuels demand for premium products and services, shaping end-user demographics.
- Market Concentration: Nestle S A and Mars Incorporated combined hold an estimated xx% market share.
- M&A Activity: The historical period (2019-2024) saw approximately xx M&A deals, with an upward trend projected for the forecast period (2025-2033).
- Regulatory Landscape: The FDA and other regulatory bodies influence product development and marketing, creating compliance challenges.
- Competitive Substitutes: Generic pet food brands and DIY grooming solutions pose competitive pressure to premium offerings.
- End-User Demographics: Millennials and Gen Z are driving demand for premium, specialized pet products and services.
US Pet Care and Services Industry Growth Trends & Insights
The US pet care and services market exhibited robust growth throughout the historical period (2019-2024), with a Compound Annual Growth Rate (CAGR) of xx%. This growth is attributed to several factors, including increasing pet ownership, rising disposable incomes, and heightened awareness of pet health and well-being. The market size in 2024 reached $xx billion, and is projected to reach $xx billion by 2025 and $xx billion by 2033. Technological disruptions, such as the rise of pet tech solutions and telehealth for animals, are accelerating this growth. Consumer behavior shifts towards premiumization and personalization further fuel market expansion. The adoption rate of pet insurance and subscription-based services is also increasing significantly, adding to market value. Market penetration for premium pet food continues to rise.
Dominant Regions, Countries, or Segments in US Pet Care and Services Industry
The US pet care market is geographically diverse, with growth concentrated in densely populated areas with high pet ownership rates. However, the dog segment dominates the "By Pet Type" category, followed by cats. Within "By Product Type," pet food commands the largest share, while in "By Service Type," grooming and pet sitting are leading segments.
- Key Drivers (Dog segment): High demand for dog food, toys, and training services due to the popularity of dog ownership.
- Key Drivers (Pet Food): Rising disposable incomes, increasing awareness of pet nutrition, and growing preference for premium and specialized pet foods.
- Key Drivers (Grooming & Pet Sitting): Busy lifestyles of pet owners and increasing demand for convenient and reliable pet care services.
US Pet Care and Services Industry Product Landscape
Product innovation is central to the US pet care industry. Companies are developing innovative pet foods with functional ingredients, advanced grooming products with natural and organic formulations, and technologically advanced pet care solutions, such as smart collars and automated feeders. These innovations emphasize enhanced pet health, convenience, and personalization. Unique selling propositions frequently focus on natural ingredients, tailored nutrition, and smart technology integration.
Key Drivers, Barriers & Challenges in US Pet Care and Services Industry
Key Drivers: Rising pet ownership, increasing disposable incomes, humanization of pets, technological advancements in pet care, and expanding e-commerce channels.
Challenges: Supply chain disruptions, particularly regarding pet food ingredients, can impact availability and pricing. Regulatory changes and stringent safety standards increase compliance costs. Intense competition from both established players and new entrants necessitates continuous innovation and market differentiation. These challenges could limit growth by approximately xx% over the next five years.
Emerging Opportunities in US Pet Care and Services Industry
Emerging opportunities lie in personalized pet nutrition solutions, utilizing data-driven insights for tailored pet food and supplements. The growing demand for sustainable and eco-friendly pet products presents another significant avenue for growth. Moreover, the expansion of pet insurance and subscription-based services presents a considerable opportunity. Finally, the development of innovative technologies such as AI-powered pet monitoring devices offer new market segments.
Growth Accelerators in the US Pet Care and Services Industry
Strategic partnerships between pet care companies and technology providers are driving growth by integrating smart solutions into pet care products and services. Expanding into underserved markets, particularly in rural areas, and focusing on niche pet segments, such as exotic animals, provide further growth potential. Additionally, a focus on sustainability and ethical sourcing will become crucial for maintaining long-term growth.
Key Players Shaping the US Pet Care and Services Industry Market
- Nestle S A
- PetBacker
- Mars Incorporated
- We Lov Pets
- ViaGen LC
- Petmate
- Tail Blazers
- PetSmart LLC
- Hill's Pet Nutrition Inc
- Rover Inc
Notable Milestones in US Pet Care and Services Industry Sector
- January 2023: Village Pet Care launched, receiving strategic investment from General Atlantic. This signals a significant shift towards consolidation and expansion within the pet care services sector.
- February 2023: Bark&Spark launched a new Probiotic Chew for Dogs. This highlights the ongoing innovation in pet health supplements and the market's focus on functional products.
In-Depth US Pet Care and Services Industry Market Outlook
The US pet care market exhibits immense future potential, driven by continued pet humanization, technological advancements, and evolving consumer preferences. Strategic opportunities abound for companies focusing on personalized solutions, sustainable products, and innovative service models. The market's sustained growth trajectory is expected to continue, creating lucrative opportunities for both established players and new entrants alike. The forecast period (2025-2033) projects a CAGR of xx%, indicating substantial market expansion.
US Pet Care and Services Industry Segmentation
-
1. Pet Type
- 1.1. Cat
- 1.2. Dog
- 1.3. Horse
- 1.4. Other Animals
-
2. Product Type
- 2.1. Pet Food
- 2.2. Grooming Products
- 2.3. Pet Care
-
3. Service Type
- 3.1. Grooming
- 3.2. Pet Transportation
- 3.3. Pet Boarding
- 3.4. Pet Sitting
- 3.5. Pet Walking
- 3.6. Other Services
US Pet Care and Services Industry Segmentation By Geography
-
1. North America
- 1.1. United States
- 1.2. Canada
- 1.3. Mexico
-
2. South America
- 2.1. Brazil
- 2.2. Argentina
- 2.3. Rest of South America
-
3. Europe
- 3.1. United Kingdom
- 3.2. Germany
- 3.3. France
- 3.4. Italy
- 3.5. Spain
- 3.6. Russia
- 3.7. Benelux
- 3.8. Nordics
- 3.9. Rest of Europe
-
4. Middle East & Africa
- 4.1. Turkey
- 4.2. Israel
- 4.3. GCC
- 4.4. North Africa
- 4.5. South Africa
- 4.6. Rest of Middle East & Africa
-
5. Asia Pacific
- 5.1. China
- 5.2. India
- 5.3. Japan
- 5.4. South Korea
- 5.5. ASEAN
- 5.6. Oceania
- 5.7. Rest of Asia Pacific
US Pet Care and Services Industry Regional Market Share
Geographic Coverage of US Pet Care and Services Industry
US Pet Care and Services Industry REPORT HIGHLIGHTS
| Aspects | Details |
|---|---|
| Study Period | 2020-2034 |
| Base Year | 2025 |
| Estimated Year | 2026 |
| Forecast Period | 2026-2034 |
| Historical Period | 2020-2025 |
| Growth Rate | CAGR of 3.51% from 2020-2034 |
| Segmentation |
|
Table of Contents
- 1. Introduction
- 1.1. Research Scope
- 1.2. Market Segmentation
- 1.3. Research Objective
- 1.4. Definitions and Assumptions
- 2. Executive Summary
- 2.1. Market Snapshot
- 3. Market Dynamics
- 3.1. Market Drivers
- 3.2. Market Restrains
- 3.3. Market Trends
- 3.4. Market Opportunities
- 4. Market Factor Analysis
- 4.1. Porters Five Forces
- 4.1.1. Bargaining Power of Suppliers
- 4.1.2. Bargaining Power of Buyers
- 4.1.3. Threat of New Entrants
- 4.1.4. Threat of Substitutes
- 4.1.5. Competitive Rivalry
- 4.2. PESTEL analysis
- 4.3. BCG Analysis
- 4.3.1. Stars (High Growth, High Market Share)
- 4.3.2. Cash Cows (Low Growth, High Market Share)
- 4.3.3. Question Mark (High Growth, Low Market Share)
- 4.3.4. Dogs (Low Growth, Low Market Share)
- 4.4. Ansoff Matrix Analysis
- 4.5. Supply Chain Analysis
- 4.6. Regulatory Landscape
- 4.7. Current Market Potential and Opportunity Assessment (TAM–SAM–SOM Framework)
- 4.8. IMR Analyst Note
- 4.1. Porters Five Forces
- 5. Market Analysis, Insights and Forecast 2021-2033
- 5.1. Market Analysis, Insights and Forecast - by Pet Type
- 5.1.1. Cat
- 5.1.2. Dog
- 5.1.3. Horse
- 5.1.4. Other Animals
- 5.2. Market Analysis, Insights and Forecast - by Product Type
- 5.2.1. Pet Food
- 5.2.2. Grooming Products
- 5.2.3. Pet Care
- 5.3. Market Analysis, Insights and Forecast - by Service Type
- 5.3.1. Grooming
- 5.3.2. Pet Transportation
- 5.3.3. Pet Boarding
- 5.3.4. Pet Sitting
- 5.3.5. Pet Walking
- 5.3.6. Other Services
- 5.4. Market Analysis, Insights and Forecast - by Region
- 5.4.1. North America
- 5.4.2. South America
- 5.4.3. Europe
- 5.4.4. Middle East & Africa
- 5.4.5. Asia Pacific
- 5.1. Market Analysis, Insights and Forecast - by Pet Type
- 6. Global US Pet Care and Services Industry Analysis, Insights and Forecast, 2021-2033
- 6.1. Market Analysis, Insights and Forecast - by Pet Type
- 6.1.1. Cat
- 6.1.2. Dog
- 6.1.3. Horse
- 6.1.4. Other Animals
- 6.2. Market Analysis, Insights and Forecast - by Product Type
- 6.2.1. Pet Food
- 6.2.2. Grooming Products
- 6.2.3. Pet Care
- 6.3. Market Analysis, Insights and Forecast - by Service Type
- 6.3.1. Grooming
- 6.3.2. Pet Transportation
- 6.3.3. Pet Boarding
- 6.3.4. Pet Sitting
- 6.3.5. Pet Walking
- 6.3.6. Other Services
- 6.1. Market Analysis, Insights and Forecast - by Pet Type
- 7. North America US Pet Care and Services Industry Analysis, Insights and Forecast, 2020-2032
- 7.1. Market Analysis, Insights and Forecast - by Pet Type
- 7.1.1. Cat
- 7.1.2. Dog
- 7.1.3. Horse
- 7.1.4. Other Animals
- 7.2. Market Analysis, Insights and Forecast - by Product Type
- 7.2.1. Pet Food
- 7.2.2. Grooming Products
- 7.2.3. Pet Care
- 7.3. Market Analysis, Insights and Forecast - by Service Type
- 7.3.1. Grooming
- 7.3.2. Pet Transportation
- 7.3.3. Pet Boarding
- 7.3.4. Pet Sitting
- 7.3.5. Pet Walking
- 7.3.6. Other Services
- 7.1. Market Analysis, Insights and Forecast - by Pet Type
- 8. South America US Pet Care and Services Industry Analysis, Insights and Forecast, 2020-2032
- 8.1. Market Analysis, Insights and Forecast - by Pet Type
- 8.1.1. Cat
- 8.1.2. Dog
- 8.1.3. Horse
- 8.1.4. Other Animals
- 8.2. Market Analysis, Insights and Forecast - by Product Type
- 8.2.1. Pet Food
- 8.2.2. Grooming Products
- 8.2.3. Pet Care
- 8.3. Market Analysis, Insights and Forecast - by Service Type
- 8.3.1. Grooming
- 8.3.2. Pet Transportation
- 8.3.3. Pet Boarding
- 8.3.4. Pet Sitting
- 8.3.5. Pet Walking
- 8.3.6. Other Services
- 8.1. Market Analysis, Insights and Forecast - by Pet Type
- 9. Europe US Pet Care and Services Industry Analysis, Insights and Forecast, 2020-2032
- 9.1. Market Analysis, Insights and Forecast - by Pet Type
- 9.1.1. Cat
- 9.1.2. Dog
- 9.1.3. Horse
- 9.1.4. Other Animals
- 9.2. Market Analysis, Insights and Forecast - by Product Type
- 9.2.1. Pet Food
- 9.2.2. Grooming Products
- 9.2.3. Pet Care
- 9.3. Market Analysis, Insights and Forecast - by Service Type
- 9.3.1. Grooming
- 9.3.2. Pet Transportation
- 9.3.3. Pet Boarding
- 9.3.4. Pet Sitting
- 9.3.5. Pet Walking
- 9.3.6. Other Services
- 9.1. Market Analysis, Insights and Forecast - by Pet Type
- 10. Middle East & Africa US Pet Care and Services Industry Analysis, Insights and Forecast, 2020-2032
- 10.1. Market Analysis, Insights and Forecast - by Pet Type
- 10.1.1. Cat
- 10.1.2. Dog
- 10.1.3. Horse
- 10.1.4. Other Animals
- 10.2. Market Analysis, Insights and Forecast - by Product Type
- 10.2.1. Pet Food
- 10.2.2. Grooming Products
- 10.2.3. Pet Care
- 10.3. Market Analysis, Insights and Forecast - by Service Type
- 10.3.1. Grooming
- 10.3.2. Pet Transportation
- 10.3.3. Pet Boarding
- 10.3.4. Pet Sitting
- 10.3.5. Pet Walking
- 10.3.6. Other Services
- 10.1. Market Analysis, Insights and Forecast - by Pet Type
- 11. Asia Pacific US Pet Care and Services Industry Analysis, Insights and Forecast, 2020-2032
- 11.1. Market Analysis, Insights and Forecast - by Pet Type
- 11.1.1. Cat
- 11.1.2. Dog
- 11.1.3. Horse
- 11.1.4. Other Animals
- 11.2. Market Analysis, Insights and Forecast - by Product Type
- 11.2.1. Pet Food
- 11.2.2. Grooming Products
- 11.2.3. Pet Care
- 11.3. Market Analysis, Insights and Forecast - by Service Type
- 11.3.1. Grooming
- 11.3.2. Pet Transportation
- 11.3.3. Pet Boarding
- 11.3.4. Pet Sitting
- 11.3.5. Pet Walking
- 11.3.6. Other Services
- 11.1. Market Analysis, Insights and Forecast - by Pet Type
- 12. Competitive Analysis
- 12.1. Company Profiles
- 12.1.1 Nestle S A
- 12.1.1.1. Company Overview
- 12.1.1.2. Products
- 12.1.1.3. Company Financials
- 12.1.1.4. SWOT Analysis
- 12.1.2 PetBacker
- 12.1.2.1. Company Overview
- 12.1.2.2. Products
- 12.1.2.3. Company Financials
- 12.1.2.4. SWOT Analysis
- 12.1.3 Mars Incorporated
- 12.1.3.1. Company Overview
- 12.1.3.2. Products
- 12.1.3.3. Company Financials
- 12.1.3.4. SWOT Analysis
- 12.1.4 We Lov Pets
- 12.1.4.1. Company Overview
- 12.1.4.2. Products
- 12.1.4.3. Company Financials
- 12.1.4.4. SWOT Analysis
- 12.1.5 ViaGen LC
- 12.1.5.1. Company Overview
- 12.1.5.2. Products
- 12.1.5.3. Company Financials
- 12.1.5.4. SWOT Analysis
- 12.1.6 Petmate
- 12.1.6.1. Company Overview
- 12.1.6.2. Products
- 12.1.6.3. Company Financials
- 12.1.6.4. SWOT Analysis
- 12.1.7 Tail Blazers
- 12.1.7.1. Company Overview
- 12.1.7.2. Products
- 12.1.7.3. Company Financials
- 12.1.7.4. SWOT Analysis
- 12.1.8 PetSmart LLC
- 12.1.8.1. Company Overview
- 12.1.8.2. Products
- 12.1.8.3. Company Financials
- 12.1.8.4. SWOT Analysis
- 12.1.9 Hill's Pet Nutrition Inc
- 12.1.9.1. Company Overview
- 12.1.9.2. Products
- 12.1.9.3. Company Financials
- 12.1.9.4. SWOT Analysis
- 12.1.10 Rover Inc
- 12.1.10.1. Company Overview
- 12.1.10.2. Products
- 12.1.10.3. Company Financials
- 12.1.10.4. SWOT Analysis
- 12.1.1 Nestle S A
- 12.2. Market Entropy
- 12.2.1 Company's Key Areas Served
- 12.2.2 Recent Developments
- 12.3. Company Market Share Analysis 2025
- 12.3.1 Top 5 Companies Market Share Analysis
- 12.3.2 Top 3 Companies Market Share Analysis
- 12.4. List of Potential Customers
- 13. Research Methodology
List of Figures
- Figure 1: Global US Pet Care and Services Industry Revenue Breakdown (Million, %) by Region 2025 & 2033
- Figure 2: Global US Pet Care and Services Industry Volume Breakdown (K Unit, %) by Region 2025 & 2033
- Figure 3: North America US Pet Care and Services Industry Revenue (Million), by Pet Type 2025 & 2033
- Figure 4: North America US Pet Care and Services Industry Volume (K Unit), by Pet Type 2025 & 2033
- Figure 5: North America US Pet Care and Services Industry Revenue Share (%), by Pet Type 2025 & 2033
- Figure 6: North America US Pet Care and Services Industry Volume Share (%), by Pet Type 2025 & 2033
- Figure 7: North America US Pet Care and Services Industry Revenue (Million), by Product Type 2025 & 2033
- Figure 8: North America US Pet Care and Services Industry Volume (K Unit), by Product Type 2025 & 2033
- Figure 9: North America US Pet Care and Services Industry Revenue Share (%), by Product Type 2025 & 2033
- Figure 10: North America US Pet Care and Services Industry Volume Share (%), by Product Type 2025 & 2033
- Figure 11: North America US Pet Care and Services Industry Revenue (Million), by Service Type 2025 & 2033
- Figure 12: North America US Pet Care and Services Industry Volume (K Unit), by Service Type 2025 & 2033
- Figure 13: North America US Pet Care and Services Industry Revenue Share (%), by Service Type 2025 & 2033
- Figure 14: North America US Pet Care and Services Industry Volume Share (%), by Service Type 2025 & 2033
- Figure 15: North America US Pet Care and Services Industry Revenue (Million), by Country 2025 & 2033
- Figure 16: North America US Pet Care and Services Industry Volume (K Unit), by Country 2025 & 2033
- Figure 17: North America US Pet Care and Services Industry Revenue Share (%), by Country 2025 & 2033
- Figure 18: North America US Pet Care and Services Industry Volume Share (%), by Country 2025 & 2033
- Figure 19: South America US Pet Care and Services Industry Revenue (Million), by Pet Type 2025 & 2033
- Figure 20: South America US Pet Care and Services Industry Volume (K Unit), by Pet Type 2025 & 2033
- Figure 21: South America US Pet Care and Services Industry Revenue Share (%), by Pet Type 2025 & 2033
- Figure 22: South America US Pet Care and Services Industry Volume Share (%), by Pet Type 2025 & 2033
- Figure 23: South America US Pet Care and Services Industry Revenue (Million), by Product Type 2025 & 2033
- Figure 24: South America US Pet Care and Services Industry Volume (K Unit), by Product Type 2025 & 2033
- Figure 25: South America US Pet Care and Services Industry Revenue Share (%), by Product Type 2025 & 2033
- Figure 26: South America US Pet Care and Services Industry Volume Share (%), by Product Type 2025 & 2033
- Figure 27: South America US Pet Care and Services Industry Revenue (Million), by Service Type 2025 & 2033
- Figure 28: South America US Pet Care and Services Industry Volume (K Unit), by Service Type 2025 & 2033
- Figure 29: South America US Pet Care and Services Industry Revenue Share (%), by Service Type 2025 & 2033
- Figure 30: South America US Pet Care and Services Industry Volume Share (%), by Service Type 2025 & 2033
- Figure 31: South America US Pet Care and Services Industry Revenue (Million), by Country 2025 & 2033
- Figure 32: South America US Pet Care and Services Industry Volume (K Unit), by Country 2025 & 2033
- Figure 33: South America US Pet Care and Services Industry Revenue Share (%), by Country 2025 & 2033
- Figure 34: South America US Pet Care and Services Industry Volume Share (%), by Country 2025 & 2033
- Figure 35: Europe US Pet Care and Services Industry Revenue (Million), by Pet Type 2025 & 2033
- Figure 36: Europe US Pet Care and Services Industry Volume (K Unit), by Pet Type 2025 & 2033
- Figure 37: Europe US Pet Care and Services Industry Revenue Share (%), by Pet Type 2025 & 2033
- Figure 38: Europe US Pet Care and Services Industry Volume Share (%), by Pet Type 2025 & 2033
- Figure 39: Europe US Pet Care and Services Industry Revenue (Million), by Product Type 2025 & 2033
- Figure 40: Europe US Pet Care and Services Industry Volume (K Unit), by Product Type 2025 & 2033
- Figure 41: Europe US Pet Care and Services Industry Revenue Share (%), by Product Type 2025 & 2033
- Figure 42: Europe US Pet Care and Services Industry Volume Share (%), by Product Type 2025 & 2033
- Figure 43: Europe US Pet Care and Services Industry Revenue (Million), by Service Type 2025 & 2033
- Figure 44: Europe US Pet Care and Services Industry Volume (K Unit), by Service Type 2025 & 2033
- Figure 45: Europe US Pet Care and Services Industry Revenue Share (%), by Service Type 2025 & 2033
- Figure 46: Europe US Pet Care and Services Industry Volume Share (%), by Service Type 2025 & 2033
- Figure 47: Europe US Pet Care and Services Industry Revenue (Million), by Country 2025 & 2033
- Figure 48: Europe US Pet Care and Services Industry Volume (K Unit), by Country 2025 & 2033
- Figure 49: Europe US Pet Care and Services Industry Revenue Share (%), by Country 2025 & 2033
- Figure 50: Europe US Pet Care and Services Industry Volume Share (%), by Country 2025 & 2033
- Figure 51: Middle East & Africa US Pet Care and Services Industry Revenue (Million), by Pet Type 2025 & 2033
- Figure 52: Middle East & Africa US Pet Care and Services Industry Volume (K Unit), by Pet Type 2025 & 2033
- Figure 53: Middle East & Africa US Pet Care and Services Industry Revenue Share (%), by Pet Type 2025 & 2033
- Figure 54: Middle East & Africa US Pet Care and Services Industry Volume Share (%), by Pet Type 2025 & 2033
- Figure 55: Middle East & Africa US Pet Care and Services Industry Revenue (Million), by Product Type 2025 & 2033
- Figure 56: Middle East & Africa US Pet Care and Services Industry Volume (K Unit), by Product Type 2025 & 2033
- Figure 57: Middle East & Africa US Pet Care and Services Industry Revenue Share (%), by Product Type 2025 & 2033
- Figure 58: Middle East & Africa US Pet Care and Services Industry Volume Share (%), by Product Type 2025 & 2033
- Figure 59: Middle East & Africa US Pet Care and Services Industry Revenue (Million), by Service Type 2025 & 2033
- Figure 60: Middle East & Africa US Pet Care and Services Industry Volume (K Unit), by Service Type 2025 & 2033
- Figure 61: Middle East & Africa US Pet Care and Services Industry Revenue Share (%), by Service Type 2025 & 2033
- Figure 62: Middle East & Africa US Pet Care and Services Industry Volume Share (%), by Service Type 2025 & 2033
- Figure 63: Middle East & Africa US Pet Care and Services Industry Revenue (Million), by Country 2025 & 2033
- Figure 64: Middle East & Africa US Pet Care and Services Industry Volume (K Unit), by Country 2025 & 2033
- Figure 65: Middle East & Africa US Pet Care and Services Industry Revenue Share (%), by Country 2025 & 2033
- Figure 66: Middle East & Africa US Pet Care and Services Industry Volume Share (%), by Country 2025 & 2033
- Figure 67: Asia Pacific US Pet Care and Services Industry Revenue (Million), by Pet Type 2025 & 2033
- Figure 68: Asia Pacific US Pet Care and Services Industry Volume (K Unit), by Pet Type 2025 & 2033
- Figure 69: Asia Pacific US Pet Care and Services Industry Revenue Share (%), by Pet Type 2025 & 2033
- Figure 70: Asia Pacific US Pet Care and Services Industry Volume Share (%), by Pet Type 2025 & 2033
- Figure 71: Asia Pacific US Pet Care and Services Industry Revenue (Million), by Product Type 2025 & 2033
- Figure 72: Asia Pacific US Pet Care and Services Industry Volume (K Unit), by Product Type 2025 & 2033
- Figure 73: Asia Pacific US Pet Care and Services Industry Revenue Share (%), by Product Type 2025 & 2033
- Figure 74: Asia Pacific US Pet Care and Services Industry Volume Share (%), by Product Type 2025 & 2033
- Figure 75: Asia Pacific US Pet Care and Services Industry Revenue (Million), by Service Type 2025 & 2033
- Figure 76: Asia Pacific US Pet Care and Services Industry Volume (K Unit), by Service Type 2025 & 2033
- Figure 77: Asia Pacific US Pet Care and Services Industry Revenue Share (%), by Service Type 2025 & 2033
- Figure 78: Asia Pacific US Pet Care and Services Industry Volume Share (%), by Service Type 2025 & 2033
- Figure 79: Asia Pacific US Pet Care and Services Industry Revenue (Million), by Country 2025 & 2033
- Figure 80: Asia Pacific US Pet Care and Services Industry Volume (K Unit), by Country 2025 & 2033
- Figure 81: Asia Pacific US Pet Care and Services Industry Revenue Share (%), by Country 2025 & 2033
- Figure 82: Asia Pacific US Pet Care and Services Industry Volume Share (%), by Country 2025 & 2033
List of Tables
- Table 1: Global US Pet Care and Services Industry Revenue Million Forecast, by Pet Type 2020 & 2033
- Table 2: Global US Pet Care and Services Industry Volume K Unit Forecast, by Pet Type 2020 & 2033
- Table 3: Global US Pet Care and Services Industry Revenue Million Forecast, by Product Type 2020 & 2033
- Table 4: Global US Pet Care and Services Industry Volume K Unit Forecast, by Product Type 2020 & 2033
- Table 5: Global US Pet Care and Services Industry Revenue Million Forecast, by Service Type 2020 & 2033
- Table 6: Global US Pet Care and Services Industry Volume K Unit Forecast, by Service Type 2020 & 2033
- Table 7: Global US Pet Care and Services Industry Revenue Million Forecast, by Region 2020 & 2033
- Table 8: Global US Pet Care and Services Industry Volume K Unit Forecast, by Region 2020 & 2033
- Table 9: Global US Pet Care and Services Industry Revenue Million Forecast, by Pet Type 2020 & 2033
- Table 10: Global US Pet Care and Services Industry Volume K Unit Forecast, by Pet Type 2020 & 2033
- Table 11: Global US Pet Care and Services Industry Revenue Million Forecast, by Product Type 2020 & 2033
- Table 12: Global US Pet Care and Services Industry Volume K Unit Forecast, by Product Type 2020 & 2033
- Table 13: Global US Pet Care and Services Industry Revenue Million Forecast, by Service Type 2020 & 2033
- Table 14: Global US Pet Care and Services Industry Volume K Unit Forecast, by Service Type 2020 & 2033
- Table 15: Global US Pet Care and Services Industry Revenue Million Forecast, by Country 2020 & 2033
- Table 16: Global US Pet Care and Services Industry Volume K Unit Forecast, by Country 2020 & 2033
- Table 17: United States US Pet Care and Services Industry Revenue (Million) Forecast, by Application 2020 & 2033
- Table 18: United States US Pet Care and Services Industry Volume (K Unit) Forecast, by Application 2020 & 2033
- Table 19: Canada US Pet Care and Services Industry Revenue (Million) Forecast, by Application 2020 & 2033
- Table 20: Canada US Pet Care and Services Industry Volume (K Unit) Forecast, by Application 2020 & 2033
- Table 21: Mexico US Pet Care and Services Industry Revenue (Million) Forecast, by Application 2020 & 2033
- Table 22: Mexico US Pet Care and Services Industry Volume (K Unit) Forecast, by Application 2020 & 2033
- Table 23: Global US Pet Care and Services Industry Revenue Million Forecast, by Pet Type 2020 & 2033
- Table 24: Global US Pet Care and Services Industry Volume K Unit Forecast, by Pet Type 2020 & 2033
- Table 25: Global US Pet Care and Services Industry Revenue Million Forecast, by Product Type 2020 & 2033
- Table 26: Global US Pet Care and Services Industry Volume K Unit Forecast, by Product Type 2020 & 2033
- Table 27: Global US Pet Care and Services Industry Revenue Million Forecast, by Service Type 2020 & 2033
- Table 28: Global US Pet Care and Services Industry Volume K Unit Forecast, by Service Type 2020 & 2033
- Table 29: Global US Pet Care and Services Industry Revenue Million Forecast, by Country 2020 & 2033
- Table 30: Global US Pet Care and Services Industry Volume K Unit Forecast, by Country 2020 & 2033
- Table 31: Brazil US Pet Care and Services Industry Revenue (Million) Forecast, by Application 2020 & 2033
- Table 32: Brazil US Pet Care and Services Industry Volume (K Unit) Forecast, by Application 2020 & 2033
- Table 33: Argentina US Pet Care and Services Industry Revenue (Million) Forecast, by Application 2020 & 2033
- Table 34: Argentina US Pet Care and Services Industry Volume (K Unit) Forecast, by Application 2020 & 2033
- Table 35: Rest of South America US Pet Care and Services Industry Revenue (Million) Forecast, by Application 2020 & 2033
- Table 36: Rest of South America US Pet Care and Services Industry Volume (K Unit) Forecast, by Application 2020 & 2033
- Table 37: Global US Pet Care and Services Industry Revenue Million Forecast, by Pet Type 2020 & 2033
- Table 38: Global US Pet Care and Services Industry Volume K Unit Forecast, by Pet Type 2020 & 2033
- Table 39: Global US Pet Care and Services Industry Revenue Million Forecast, by Product Type 2020 & 2033
- Table 40: Global US Pet Care and Services Industry Volume K Unit Forecast, by Product Type 2020 & 2033
- Table 41: Global US Pet Care and Services Industry Revenue Million Forecast, by Service Type 2020 & 2033
- Table 42: Global US Pet Care and Services Industry Volume K Unit Forecast, by Service Type 2020 & 2033
- Table 43: Global US Pet Care and Services Industry Revenue Million Forecast, by Country 2020 & 2033
- Table 44: Global US Pet Care and Services Industry Volume K Unit Forecast, by Country 2020 & 2033
- Table 45: United Kingdom US Pet Care and Services Industry Revenue (Million) Forecast, by Application 2020 & 2033
- Table 46: United Kingdom US Pet Care and Services Industry Volume (K Unit) Forecast, by Application 2020 & 2033
- Table 47: Germany US Pet Care and Services Industry Revenue (Million) Forecast, by Application 2020 & 2033
- Table 48: Germany US Pet Care and Services Industry Volume (K Unit) Forecast, by Application 2020 & 2033
- Table 49: France US Pet Care and Services Industry Revenue (Million) Forecast, by Application 2020 & 2033
- Table 50: France US Pet Care and Services Industry Volume (K Unit) Forecast, by Application 2020 & 2033
- Table 51: Italy US Pet Care and Services Industry Revenue (Million) Forecast, by Application 2020 & 2033
- Table 52: Italy US Pet Care and Services Industry Volume (K Unit) Forecast, by Application 2020 & 2033
- Table 53: Spain US Pet Care and Services Industry Revenue (Million) Forecast, by Application 2020 & 2033
- Table 54: Spain US Pet Care and Services Industry Volume (K Unit) Forecast, by Application 2020 & 2033
- Table 55: Russia US Pet Care and Services Industry Revenue (Million) Forecast, by Application 2020 & 2033
- Table 56: Russia US Pet Care and Services Industry Volume (K Unit) Forecast, by Application 2020 & 2033
- Table 57: Benelux US Pet Care and Services Industry Revenue (Million) Forecast, by Application 2020 & 2033
- Table 58: Benelux US Pet Care and Services Industry Volume (K Unit) Forecast, by Application 2020 & 2033
- Table 59: Nordics US Pet Care and Services Industry Revenue (Million) Forecast, by Application 2020 & 2033
- Table 60: Nordics US Pet Care and Services Industry Volume (K Unit) Forecast, by Application 2020 & 2033
- Table 61: Rest of Europe US Pet Care and Services Industry Revenue (Million) Forecast, by Application 2020 & 2033
- Table 62: Rest of Europe US Pet Care and Services Industry Volume (K Unit) Forecast, by Application 2020 & 2033
- Table 63: Global US Pet Care and Services Industry Revenue Million Forecast, by Pet Type 2020 & 2033
- Table 64: Global US Pet Care and Services Industry Volume K Unit Forecast, by Pet Type 2020 & 2033
- Table 65: Global US Pet Care and Services Industry Revenue Million Forecast, by Product Type 2020 & 2033
- Table 66: Global US Pet Care and Services Industry Volume K Unit Forecast, by Product Type 2020 & 2033
- Table 67: Global US Pet Care and Services Industry Revenue Million Forecast, by Service Type 2020 & 2033
- Table 68: Global US Pet Care and Services Industry Volume K Unit Forecast, by Service Type 2020 & 2033
- Table 69: Global US Pet Care and Services Industry Revenue Million Forecast, by Country 2020 & 2033
- Table 70: Global US Pet Care and Services Industry Volume K Unit Forecast, by Country 2020 & 2033
- Table 71: Turkey US Pet Care and Services Industry Revenue (Million) Forecast, by Application 2020 & 2033
- Table 72: Turkey US Pet Care and Services Industry Volume (K Unit) Forecast, by Application 2020 & 2033
- Table 73: Israel US Pet Care and Services Industry Revenue (Million) Forecast, by Application 2020 & 2033
- Table 74: Israel US Pet Care and Services Industry Volume (K Unit) Forecast, by Application 2020 & 2033
- Table 75: GCC US Pet Care and Services Industry Revenue (Million) Forecast, by Application 2020 & 2033
- Table 76: GCC US Pet Care and Services Industry Volume (K Unit) Forecast, by Application 2020 & 2033
- Table 77: North Africa US Pet Care and Services Industry Revenue (Million) Forecast, by Application 2020 & 2033
- Table 78: North Africa US Pet Care and Services Industry Volume (K Unit) Forecast, by Application 2020 & 2033
- Table 79: South Africa US Pet Care and Services Industry Revenue (Million) Forecast, by Application 2020 & 2033
- Table 80: South Africa US Pet Care and Services Industry Volume (K Unit) Forecast, by Application 2020 & 2033
- Table 81: Rest of Middle East & Africa US Pet Care and Services Industry Revenue (Million) Forecast, by Application 2020 & 2033
- Table 82: Rest of Middle East & Africa US Pet Care and Services Industry Volume (K Unit) Forecast, by Application 2020 & 2033
- Table 83: Global US Pet Care and Services Industry Revenue Million Forecast, by Pet Type 2020 & 2033
- Table 84: Global US Pet Care and Services Industry Volume K Unit Forecast, by Pet Type 2020 & 2033
- Table 85: Global US Pet Care and Services Industry Revenue Million Forecast, by Product Type 2020 & 2033
- Table 86: Global US Pet Care and Services Industry Volume K Unit Forecast, by Product Type 2020 & 2033
- Table 87: Global US Pet Care and Services Industry Revenue Million Forecast, by Service Type 2020 & 2033
- Table 88: Global US Pet Care and Services Industry Volume K Unit Forecast, by Service Type 2020 & 2033
- Table 89: Global US Pet Care and Services Industry Revenue Million Forecast, by Country 2020 & 2033
- Table 90: Global US Pet Care and Services Industry Volume K Unit Forecast, by Country 2020 & 2033
- Table 91: China US Pet Care and Services Industry Revenue (Million) Forecast, by Application 2020 & 2033
- Table 92: China US Pet Care and Services Industry Volume (K Unit) Forecast, by Application 2020 & 2033
- Table 93: India US Pet Care and Services Industry Revenue (Million) Forecast, by Application 2020 & 2033
- Table 94: India US Pet Care and Services Industry Volume (K Unit) Forecast, by Application 2020 & 2033
- Table 95: Japan US Pet Care and Services Industry Revenue (Million) Forecast, by Application 2020 & 2033
- Table 96: Japan US Pet Care and Services Industry Volume (K Unit) Forecast, by Application 2020 & 2033
- Table 97: South Korea US Pet Care and Services Industry Revenue (Million) Forecast, by Application 2020 & 2033
- Table 98: South Korea US Pet Care and Services Industry Volume (K Unit) Forecast, by Application 2020 & 2033
- Table 99: ASEAN US Pet Care and Services Industry Revenue (Million) Forecast, by Application 2020 & 2033
- Table 100: ASEAN US Pet Care and Services Industry Volume (K Unit) Forecast, by Application 2020 & 2033
- Table 101: Oceania US Pet Care and Services Industry Revenue (Million) Forecast, by Application 2020 & 2033
- Table 102: Oceania US Pet Care and Services Industry Volume (K Unit) Forecast, by Application 2020 & 2033
- Table 103: Rest of Asia Pacific US Pet Care and Services Industry Revenue (Million) Forecast, by Application 2020 & 2033
- Table 104: Rest of Asia Pacific US Pet Care and Services Industry Volume (K Unit) Forecast, by Application 2020 & 2033
Frequently Asked Questions
1. What is the projected Compound Annual Growth Rate (CAGR) of the US Pet Care and Services Industry?
The projected CAGR is approximately 3.51%.
2. Which companies are prominent players in the US Pet Care and Services Industry?
Key companies in the market include Nestle S A, PetBacker, Mars Incorporated, We Lov Pets, ViaGen LC, Petmate, Tail Blazers, PetSmart LLC, Hill's Pet Nutrition Inc, Rover Inc.
3. What are the main segments of the US Pet Care and Services Industry?
The market segments include Pet Type , Product Type, Service Type.
4. Can you provide details about the market size?
The market size is estimated to be USD 12.21 Million as of 2022.
5. What are some drivers contributing to market growth?
Rising Pet Ownership and Pet Insurance; Increased Adoption of Technology for Pet Care.
6. What are the notable trends driving market growth?
Dog Segment is Expected to Account for the Large Market Share Over the Forecast Period.
7. Are there any restraints impacting market growth?
High Cost of Products and Services.
8. Can you provide examples of recent developments in the market?
February 2023: Bark&Spark released a new Probiotic Chew for Dogs. Bark&Spark's chews are touted as perfectly dosed and compatible with any dog's diet, with just a few chews a day giving the desired effects.
9. What pricing options are available for accessing the report?
Pricing options include single-user, multi-user, and enterprise licenses priced at USD 3800, USD 4500, and USD 5800 respectively.
10. Is the market size provided in terms of value or volume?
The market size is provided in terms of value, measured in Million and volume, measured in K Unit.
11. Are there any specific market keywords associated with the report?
Yes, the market keyword associated with the report is "US Pet Care and Services Industry," which aids in identifying and referencing the specific market segment covered.
12. How do I determine which pricing option suits my needs best?
The pricing options vary based on user requirements and access needs. Individual users may opt for single-user licenses, while businesses requiring broader access may choose multi-user or enterprise licenses for cost-effective access to the report.
13. Are there any additional resources or data provided in the US Pet Care and Services Industry report?
While the report offers comprehensive insights, it's advisable to review the specific contents or supplementary materials provided to ascertain if additional resources or data are available.
14. How can I stay updated on further developments or reports in the US Pet Care and Services Industry?
To stay informed about further developments, trends, and reports in the US Pet Care and Services Industry, consider subscribing to industry newsletters, following relevant companies and organizations, or regularly checking reputable industry news sources and publications.
Methodology
Step 1 - Identification of Relevant Samples Size from Population Database


Step 2 - Approaches for Defining Global Market Size (Value, Volume* & Price*)

Note*: In applicable scenarios
Step 3 - Data Sources
Primary Research
- Web Analytics
- Survey Reports
- Research Institute
- Latest Research Reports
- Opinion Leaders
Secondary Research
- Annual Reports
- White Paper
- Latest Press Release
- Industry Association
- Paid Database
- Investor Presentations

Step 4 - Data Triangulation
Involves using different sources of information in order to increase the validity of a study
These sources are likely to be stakeholders in a program - participants, other researchers, program staff, other community members, and so on.
Then we put all data in single framework & apply various statistical tools to find out the dynamic on the market.
During the analysis stage, feedback from the stakeholder groups would be compared to determine areas of agreement as well as areas of divergence