

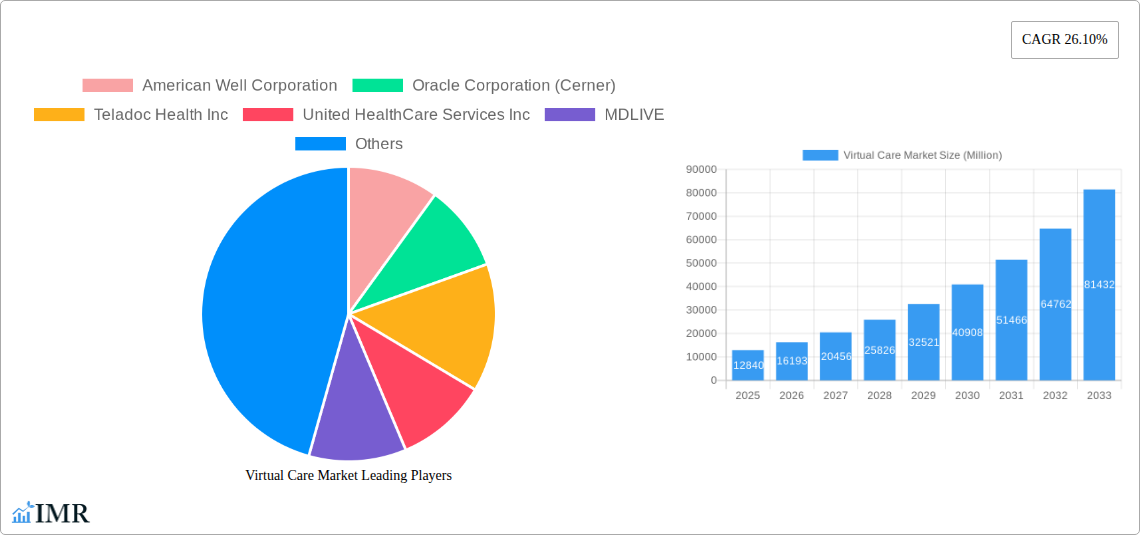
Key Insights
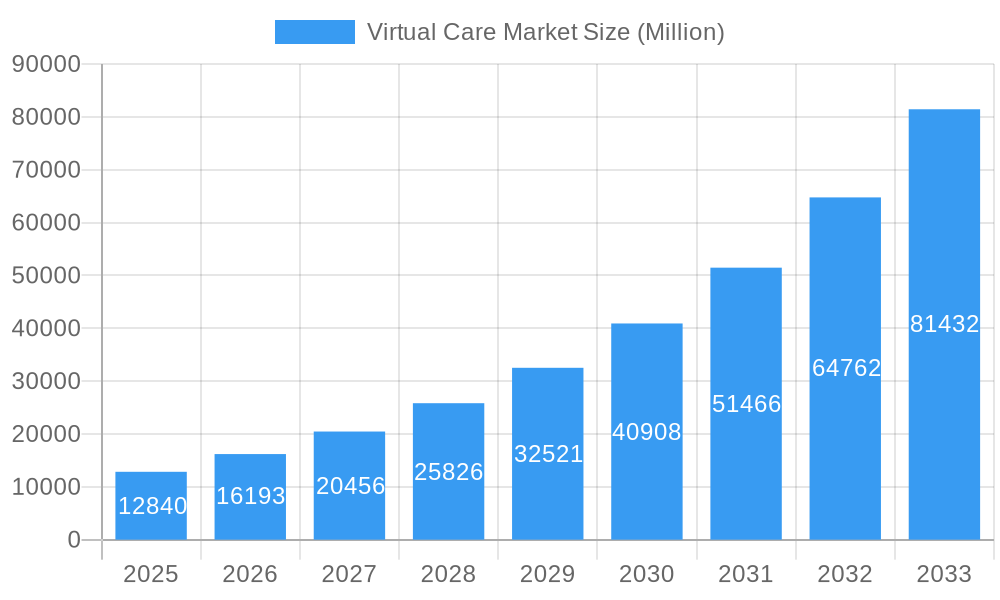
The global virtual care market is experiencing rapid growth, projected to reach a substantial size driven by several key factors. The market's Compound Annual Growth Rate (CAGR) of 26.10% from 2019 to 2024 indicates a significant upward trajectory. This expansion is fueled by the increasing adoption of telehealth technologies, rising demand for convenient and accessible healthcare services, particularly among aging populations and those in remote areas. Furthermore, the cost-effectiveness of virtual care compared to traditional in-person visits is a significant driver, appealing to both patients and healthcare providers. The market is segmented by end-users (home healthcare, hospitals, others), mode of delivery (video, audio, messaging), and component (solutions, services). The significant presence of established players like Teladoc Health, American Well, and UnitedHealth, alongside emerging tech giants like Amazon, suggests a dynamic and competitive landscape. Technological advancements, including improved video conferencing capabilities and AI-powered diagnostic tools, further contribute to market expansion.
Virtual Care Market Market Size (In Billion)
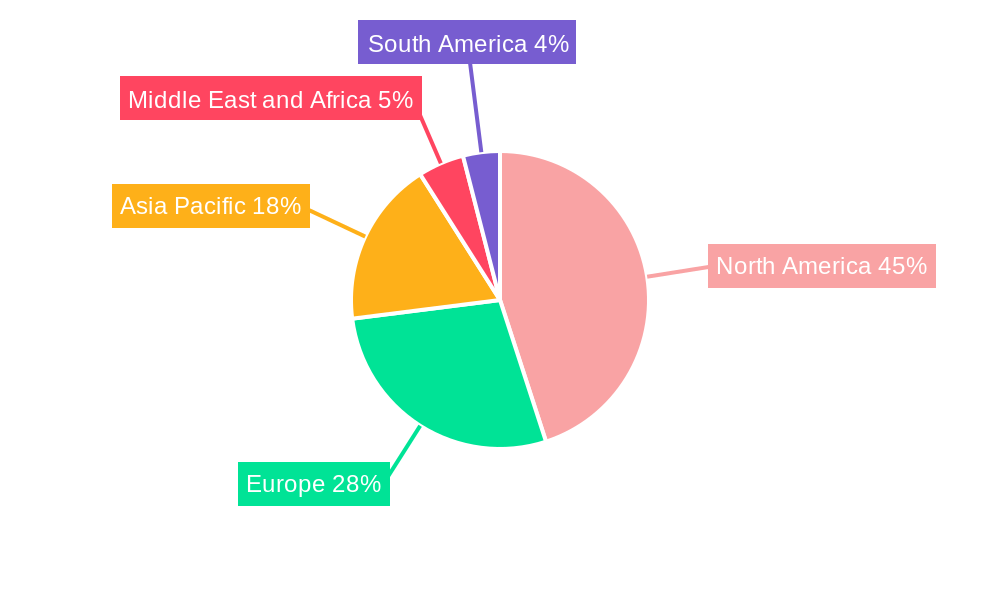
Looking ahead, the forecast period (2025-2033) promises continued robust growth, influenced by factors such as increasing smartphone penetration, expanding high-speed internet access, and supportive government initiatives promoting telehealth adoption. The integration of virtual care into existing healthcare systems and the development of innovative solutions focused on chronic disease management and preventative care will further shape market dynamics. While challenges remain, such as ensuring data security and addressing digital literacy disparities, the overall outlook for the virtual care market remains overwhelmingly positive, indicating considerable investment opportunities and transformative potential for the healthcare industry. North America currently holds a significant market share, owing to advanced technological infrastructure and early adoption of telehealth, but other regions, particularly Asia-Pacific, are rapidly catching up, fueled by increasing healthcare expenditure and a growing middle class.
Virtual Care Market Company Market Share
Virtual Care Market: A Comprehensive Report (2019-2033)
This in-depth report provides a comprehensive analysis of the Virtual Care Market, encompassing market dynamics, growth trends, regional segmentation, product landscape, key players, and future outlook. The study period covers 2019-2033, with a base year of 2025 and a forecast period of 2025-2033. The report is crucial for stakeholders seeking to understand the evolving landscape of this rapidly expanding sector, including telehealth providers, investors, and healthcare professionals. The market size is projected to reach xx Million by 2033.
Virtual Care Market Dynamics & Structure
The virtual care market exhibits a dynamic interplay of factors driving its expansion. Market concentration is moderate, with key players like Teladoc Health and American Well holding significant shares, but numerous smaller players are also actively participating. Technological innovation, particularly in AI and remote patient monitoring, is a crucial growth driver. Regulatory frameworks are evolving globally, impacting market access and reimbursement policies. The emergence of various telehealth platforms and applications is creating significant competitive pressure. End-user demographics indicate a strong preference for virtual care among younger populations and those in rural areas. Furthermore, the market has witnessed considerable M&A activity, as larger companies strategically acquire smaller players to expand their capabilities.
- Market Concentration: Moderately concentrated, with leading players accounting for approximately xx% of the market in 2024.
- Technological Innovation: Significant advancements in AI-powered diagnostics, remote monitoring devices, and secure communication platforms are driving growth.
- Regulatory Landscape: Varying regulatory frameworks across regions influence market access and adoption rates.
- Competitive Substitutes: Traditional in-person healthcare remains a primary competitor, although virtual care increasingly presents a viable alternative.
- M&A Activity: A notable increase in mergers and acquisitions in recent years, driven by market consolidation and expansion strategies. An estimated xx M&A deals occurred between 2019 and 2024.
Virtual Care Market Growth Trends & Insights
The virtual care market has experienced substantial growth, driven by factors such as increasing smartphone penetration, rising healthcare costs, and a growing preference for convenient healthcare solutions. The market size expanded from xx Million in 2019 to xx Million in 2024, exhibiting a CAGR of xx%. This robust growth is anticipated to continue, with projections indicating a market value of xx Million by 2033, driven by factors such as expanding healthcare access in underserved areas, technological innovations, and favorable government policies. Adoption rates are increasing rapidly, particularly among younger demographics and patients with chronic conditions. The integration of AI and IoT devices is further accelerating market expansion by enhancing the efficiency and effectiveness of virtual care services. Consumer behavior shifts toward greater comfort with technology and increased demand for personalized healthcare are significant contributing factors.
Dominant Regions, Countries, or Segments in Virtual Care Market
The North American virtual care market is currently the largest and fastest-growing segment, driven by factors such as high technological advancements, favorable regulatory environment, and high healthcare expenditure. Within this region, the United States holds a significant market share. The home healthcare segment demonstrates substantial growth potential, driven by the aging population and the increasing preference for remote monitoring and care.
By End Users:
- Home Healthcare: Fastest-growing segment, with xx% market share projected by 2033, driven by increasing preference for convenient in-home care.
- Hospitals: Significant market presence, leveraging virtual care for remote consultations, monitoring, and post-discharge care.
- Others: Includes long-term care facilities and other healthcare settings.
By Mode of Delivery:
- Video: Dominant mode of delivery, contributing to xx% of the market in 2024, due to its high level of engagement and visual interaction.
- Audio: Supports less bandwidth-intensive communication, particularly useful in low-connectivity areas.
- Messaging: Facilitates asynchronous communication for non-urgent issues, streamlining patient interaction.
By Component:
- Solutions: Leading segment, driven by adoption of integrated platforms and specialized applications.
- Services: Demonstrating strong growth potential due to the increasing demand for remote monitoring and support.
Key Drivers:
- Strong government support and favorable regulatory policies.
- Increasing adoption of telehealth solutions across regions.
- Technological advancements in remote patient monitoring and AI-powered diagnostics.
Virtual Care Market Product Landscape
The virtual care market features a diverse range of products, including telehealth platforms, remote patient monitoring devices, and virtual assistants. These products offer varying functionalities and capabilities, including video conferencing, messaging, remote diagnostics, and data analytics. Unique selling propositions frequently center on ease of use, user-friendly interfaces, and seamless integration with existing healthcare systems. Technological advancements are continuously improving the accuracy and reliability of remote diagnostic tools and enhancing the overall patient experience.
Key Drivers, Barriers & Challenges in Virtual Care Market
Key Drivers:
- Technological advancements: AI-powered diagnostics, remote monitoring devices, and secure communication platforms.
- Economic factors: Rising healthcare costs and the demand for cost-effective solutions.
- Policy support: Government initiatives promoting telehealth adoption.
Key Challenges:
- Data security and privacy: Ensuring the confidentiality of sensitive patient data.
- Regulatory hurdles: Varying regulations across different regions can create barriers to market entry and operation.
- Reimbursement policies: Inconsistency in insurance coverage can hinder widespread adoption.
- Technological limitations: Connectivity challenges in certain areas and the digital divide.
Emerging Opportunities in Virtual Care Market
- Expansion into underserved areas: Providing virtual care to populations with limited access to traditional healthcare.
- Integration with wearable technology: Real-time health data monitoring and personalized interventions.
- AI-powered diagnostics: Improving accuracy and efficiency of remote diagnosis and treatment.
Growth Accelerators in the Virtual Care Market Industry
Technological breakthroughs in AI and machine learning, strategic partnerships between tech companies and healthcare providers, and the expansion into new geographic markets are major growth accelerators. Increased government support for telehealth initiatives and improving consumer acceptance will further propel market growth.
Key Players Shaping the Virtual Care Market Market
- American Well Corporation
- Oracle Corporation (Cerner)
- Teladoc Health Inc
- United HealthCare Services Inc
- MDLIVE
- Medocity Inc
- Amazon com Inc
- General Electric Company
- VirtualHealth
- CVS Health
Notable Milestones in Virtual Care Market Sector
- May 2022: CVS Health launched CVS Health Virtual Primary Care, expanding access to telehealth services for its members.
- November 2021: TalktoMira, Inc. launched four new virtual care services through its Mira Health App, enhancing access to 24/7 virtual urgent care.
In-Depth Virtual Care Market Market Outlook
The virtual care market is poised for significant expansion, fueled by ongoing technological advancements, favorable regulatory changes, and increasing consumer demand for convenient healthcare options. Strategic partnerships and innovations in AI and remote monitoring will shape the future of the market, creating new opportunities for growth and expansion into untapped markets globally. The projected growth rate indicates a substantial market opportunity for both established players and new entrants in the coming years.
Virtual Care Market Segmentation
-
1. Mode of Delivery
- 1.1. Video
- 1.2. Audio
- 1.3. Messaging
-
2. Component
- 2.1. Solutions
- 2.2. Services
-
3. End Users
- 3.1. Home Healthcare
- 3.2. Hospitals
- 3.3. Others
Virtual Care Market Segmentation By Geography
-
1. North America
- 1.1. United States
- 1.2. Canada
- 1.3. Mexico
-
2. Europe
- 2.1. Germany
- 2.2. United Kingdom
- 2.3. France
- 2.4. Italy
- 2.5. Spain
- 2.6. Rest of Europe
-
3. Asia Pacific
- 3.1. China
- 3.2. Japan
- 3.3. India
- 3.4. Australia
- 3.5. South Korea
- 3.6. Rest of Asia Pacific
-
4. Middle East and Africa
- 4.1. GCC
- 4.2. South Africa
- 4.3. Rest of Middle East and Africa
-
5. South America
- 5.1. Brazil
- 5.2. Argentina
- 5.3. Rest of South America
Virtual Care Market Regional Market Share
Geographic Coverage of Virtual Care Market
Virtual Care Market REPORT HIGHLIGHTS
| Aspects | Details |
|---|---|
| Study Period | 2020-2034 |
| Base Year | 2025 |
| Estimated Year | 2026 |
| Forecast Period | 2026-2034 |
| Historical Period | 2020-2025 |
| Growth Rate | CAGR of 26.10% from 2020-2034 |
| Segmentation |
|
Table of Contents
- 1. Introduction
- 1.1. Research Scope
- 1.2. Market Segmentation
- 1.3. Research Objective
- 1.4. Definitions and Assumptions
- 2. Executive Summary
- 2.1. Market Snapshot
- 3. Market Dynamics
- 3.1. Market Drivers
- 3.2. Market Restrains
- 3.3. Market Trends
- 3.4. Market Opportunities
- 4. Market Factor Analysis
- 4.1. Porters Five Forces
- 4.1.1. Bargaining Power of Suppliers
- 4.1.2. Bargaining Power of Buyers
- 4.1.3. Threat of New Entrants
- 4.1.4. Threat of Substitutes
- 4.1.5. Competitive Rivalry
- 4.2. PESTEL analysis
- 4.3. BCG Analysis
- 4.3.1. Stars (High Growth, High Market Share)
- 4.3.2. Cash Cows (Low Growth, High Market Share)
- 4.3.3. Question Mark (High Growth, Low Market Share)
- 4.3.4. Dogs (Low Growth, Low Market Share)
- 4.4. Ansoff Matrix Analysis
- 4.5. Supply Chain Analysis
- 4.6. Regulatory Landscape
- 4.7. Current Market Potential and Opportunity Assessment (TAM–SAM–SOM Framework)
- 4.8. IMR Analyst Note
- 4.1. Porters Five Forces
- 5. Market Analysis, Insights and Forecast 2021-2033
- 5.1. Market Analysis, Insights and Forecast - by Mode of Delivery
- 5.1.1. Video
- 5.1.2. Audio
- 5.1.3. Messaging
- 5.2. Market Analysis, Insights and Forecast - by Component
- 5.2.1. Solutions
- 5.2.2. Services
- 5.3. Market Analysis, Insights and Forecast - by End Users
- 5.3.1. Home Healthcare
- 5.3.2. Hospitals
- 5.3.3. Others
- 5.4. Market Analysis, Insights and Forecast - by Region
- 5.4.1. North America
- 5.4.2. Europe
- 5.4.3. Asia Pacific
- 5.4.4. Middle East and Africa
- 5.4.5. South America
- 5.1. Market Analysis, Insights and Forecast - by Mode of Delivery
- 6. Global Virtual Care Market Analysis, Insights and Forecast, 2021-2033
- 6.1. Market Analysis, Insights and Forecast - by Mode of Delivery
- 6.1.1. Video
- 6.1.2. Audio
- 6.1.3. Messaging
- 6.2. Market Analysis, Insights and Forecast - by Component
- 6.2.1. Solutions
- 6.2.2. Services
- 6.3. Market Analysis, Insights and Forecast - by End Users
- 6.3.1. Home Healthcare
- 6.3.2. Hospitals
- 6.3.3. Others
- 6.1. Market Analysis, Insights and Forecast - by Mode of Delivery
- 7. North America Virtual Care Market Analysis, Insights and Forecast, 2020-2032
- 7.1. Market Analysis, Insights and Forecast - by Mode of Delivery
- 7.1.1. Video
- 7.1.2. Audio
- 7.1.3. Messaging
- 7.2. Market Analysis, Insights and Forecast - by Component
- 7.2.1. Solutions
- 7.2.2. Services
- 7.3. Market Analysis, Insights and Forecast - by End Users
- 7.3.1. Home Healthcare
- 7.3.2. Hospitals
- 7.3.3. Others
- 7.1. Market Analysis, Insights and Forecast - by Mode of Delivery
- 8. Europe Virtual Care Market Analysis, Insights and Forecast, 2020-2032
- 8.1. Market Analysis, Insights and Forecast - by Mode of Delivery
- 8.1.1. Video
- 8.1.2. Audio
- 8.1.3. Messaging
- 8.2. Market Analysis, Insights and Forecast - by Component
- 8.2.1. Solutions
- 8.2.2. Services
- 8.3. Market Analysis, Insights and Forecast - by End Users
- 8.3.1. Home Healthcare
- 8.3.2. Hospitals
- 8.3.3. Others
- 8.1. Market Analysis, Insights and Forecast - by Mode of Delivery
- 9. Asia Pacific Virtual Care Market Analysis, Insights and Forecast, 2020-2032
- 9.1. Market Analysis, Insights and Forecast - by Mode of Delivery
- 9.1.1. Video
- 9.1.2. Audio
- 9.1.3. Messaging
- 9.2. Market Analysis, Insights and Forecast - by Component
- 9.2.1. Solutions
- 9.2.2. Services
- 9.3. Market Analysis, Insights and Forecast - by End Users
- 9.3.1. Home Healthcare
- 9.3.2. Hospitals
- 9.3.3. Others
- 9.1. Market Analysis, Insights and Forecast - by Mode of Delivery
- 10. Middle East and Africa Virtual Care Market Analysis, Insights and Forecast, 2020-2032
- 10.1. Market Analysis, Insights and Forecast - by Mode of Delivery
- 10.1.1. Video
- 10.1.2. Audio
- 10.1.3. Messaging
- 10.2. Market Analysis, Insights and Forecast - by Component
- 10.2.1. Solutions
- 10.2.2. Services
- 10.3. Market Analysis, Insights and Forecast - by End Users
- 10.3.1. Home Healthcare
- 10.3.2. Hospitals
- 10.3.3. Others
- 10.1. Market Analysis, Insights and Forecast - by Mode of Delivery
- 11. South America Virtual Care Market Analysis, Insights and Forecast, 2020-2032
- 11.1. Market Analysis, Insights and Forecast - by Mode of Delivery
- 11.1.1. Video
- 11.1.2. Audio
- 11.1.3. Messaging
- 11.2. Market Analysis, Insights and Forecast - by Component
- 11.2.1. Solutions
- 11.2.2. Services
- 11.3. Market Analysis, Insights and Forecast - by End Users
- 11.3.1. Home Healthcare
- 11.3.2. Hospitals
- 11.3.3. Others
- 11.1. Market Analysis, Insights and Forecast - by Mode of Delivery
- 12. Competitive Analysis
- 12.1. Company Profiles
- 12.1.1 American Well Corporation
- 12.1.1.1. Company Overview
- 12.1.1.2. Products
- 12.1.1.3. Company Financials
- 12.1.1.4. SWOT Analysis
- 12.1.2 Oracle Corporation (Cerner)
- 12.1.2.1. Company Overview
- 12.1.2.2. Products
- 12.1.2.3. Company Financials
- 12.1.2.4. SWOT Analysis
- 12.1.3 Teladoc Health Inc
- 12.1.3.1. Company Overview
- 12.1.3.2. Products
- 12.1.3.3. Company Financials
- 12.1.3.4. SWOT Analysis
- 12.1.4 United HealthCare Services Inc
- 12.1.4.1. Company Overview
- 12.1.4.2. Products
- 12.1.4.3. Company Financials
- 12.1.4.4. SWOT Analysis
- 12.1.5 MDLIVE
- 12.1.5.1. Company Overview
- 12.1.5.2. Products
- 12.1.5.3. Company Financials
- 12.1.5.4. SWOT Analysis
- 12.1.6 Medocity Inc
- 12.1.6.1. Company Overview
- 12.1.6.2. Products
- 12.1.6.3. Company Financials
- 12.1.6.4. SWOT Analysis
- 12.1.7 Amazon com Inc
- 12.1.7.1. Company Overview
- 12.1.7.2. Products
- 12.1.7.3. Company Financials
- 12.1.7.4. SWOT Analysis
- 12.1.8 General Electric Company
- 12.1.8.1. Company Overview
- 12.1.8.2. Products
- 12.1.8.3. Company Financials
- 12.1.8.4. SWOT Analysis
- 12.1.9 VirtualHealth
- 12.1.9.1. Company Overview
- 12.1.9.2. Products
- 12.1.9.3. Company Financials
- 12.1.9.4. SWOT Analysis
- 12.1.10 CVS Health
- 12.1.10.1. Company Overview
- 12.1.10.2. Products
- 12.1.10.3. Company Financials
- 12.1.10.4. SWOT Analysis
- 12.1.1 American Well Corporation
- 12.2. Market Entropy
- 12.2.1 Company's Key Areas Served
- 12.2.2 Recent Developments
- 12.3. Company Market Share Analysis 2025
- 12.3.1 Top 5 Companies Market Share Analysis
- 12.3.2 Top 3 Companies Market Share Analysis
- 12.4. List of Potential Customers
- 13. Research Methodology
List of Figures
- Figure 1: Global Virtual Care Market Revenue Breakdown (Million, %) by Region 2025 & 2033
- Figure 2: Global Virtual Care Market Volume Breakdown (K Unit, %) by Region 2025 & 2033
- Figure 3: North America Virtual Care Market Revenue (Million), by Mode of Delivery 2025 & 2033
- Figure 4: North America Virtual Care Market Volume (K Unit), by Mode of Delivery 2025 & 2033
- Figure 5: North America Virtual Care Market Revenue Share (%), by Mode of Delivery 2025 & 2033
- Figure 6: North America Virtual Care Market Volume Share (%), by Mode of Delivery 2025 & 2033
- Figure 7: North America Virtual Care Market Revenue (Million), by Component 2025 & 2033
- Figure 8: North America Virtual Care Market Volume (K Unit), by Component 2025 & 2033
- Figure 9: North America Virtual Care Market Revenue Share (%), by Component 2025 & 2033
- Figure 10: North America Virtual Care Market Volume Share (%), by Component 2025 & 2033
- Figure 11: North America Virtual Care Market Revenue (Million), by End Users 2025 & 2033
- Figure 12: North America Virtual Care Market Volume (K Unit), by End Users 2025 & 2033
- Figure 13: North America Virtual Care Market Revenue Share (%), by End Users 2025 & 2033
- Figure 14: North America Virtual Care Market Volume Share (%), by End Users 2025 & 2033
- Figure 15: North America Virtual Care Market Revenue (Million), by Country 2025 & 2033
- Figure 16: North America Virtual Care Market Volume (K Unit), by Country 2025 & 2033
- Figure 17: North America Virtual Care Market Revenue Share (%), by Country 2025 & 2033
- Figure 18: North America Virtual Care Market Volume Share (%), by Country 2025 & 2033
- Figure 19: Europe Virtual Care Market Revenue (Million), by Mode of Delivery 2025 & 2033
- Figure 20: Europe Virtual Care Market Volume (K Unit), by Mode of Delivery 2025 & 2033
- Figure 21: Europe Virtual Care Market Revenue Share (%), by Mode of Delivery 2025 & 2033
- Figure 22: Europe Virtual Care Market Volume Share (%), by Mode of Delivery 2025 & 2033
- Figure 23: Europe Virtual Care Market Revenue (Million), by Component 2025 & 2033
- Figure 24: Europe Virtual Care Market Volume (K Unit), by Component 2025 & 2033
- Figure 25: Europe Virtual Care Market Revenue Share (%), by Component 2025 & 2033
- Figure 26: Europe Virtual Care Market Volume Share (%), by Component 2025 & 2033
- Figure 27: Europe Virtual Care Market Revenue (Million), by End Users 2025 & 2033
- Figure 28: Europe Virtual Care Market Volume (K Unit), by End Users 2025 & 2033
- Figure 29: Europe Virtual Care Market Revenue Share (%), by End Users 2025 & 2033
- Figure 30: Europe Virtual Care Market Volume Share (%), by End Users 2025 & 2033
- Figure 31: Europe Virtual Care Market Revenue (Million), by Country 2025 & 2033
- Figure 32: Europe Virtual Care Market Volume (K Unit), by Country 2025 & 2033
- Figure 33: Europe Virtual Care Market Revenue Share (%), by Country 2025 & 2033
- Figure 34: Europe Virtual Care Market Volume Share (%), by Country 2025 & 2033
- Figure 35: Asia Pacific Virtual Care Market Revenue (Million), by Mode of Delivery 2025 & 2033
- Figure 36: Asia Pacific Virtual Care Market Volume (K Unit), by Mode of Delivery 2025 & 2033
- Figure 37: Asia Pacific Virtual Care Market Revenue Share (%), by Mode of Delivery 2025 & 2033
- Figure 38: Asia Pacific Virtual Care Market Volume Share (%), by Mode of Delivery 2025 & 2033
- Figure 39: Asia Pacific Virtual Care Market Revenue (Million), by Component 2025 & 2033
- Figure 40: Asia Pacific Virtual Care Market Volume (K Unit), by Component 2025 & 2033
- Figure 41: Asia Pacific Virtual Care Market Revenue Share (%), by Component 2025 & 2033
- Figure 42: Asia Pacific Virtual Care Market Volume Share (%), by Component 2025 & 2033
- Figure 43: Asia Pacific Virtual Care Market Revenue (Million), by End Users 2025 & 2033
- Figure 44: Asia Pacific Virtual Care Market Volume (K Unit), by End Users 2025 & 2033
- Figure 45: Asia Pacific Virtual Care Market Revenue Share (%), by End Users 2025 & 2033
- Figure 46: Asia Pacific Virtual Care Market Volume Share (%), by End Users 2025 & 2033
- Figure 47: Asia Pacific Virtual Care Market Revenue (Million), by Country 2025 & 2033
- Figure 48: Asia Pacific Virtual Care Market Volume (K Unit), by Country 2025 & 2033
- Figure 49: Asia Pacific Virtual Care Market Revenue Share (%), by Country 2025 & 2033
- Figure 50: Asia Pacific Virtual Care Market Volume Share (%), by Country 2025 & 2033
- Figure 51: Middle East and Africa Virtual Care Market Revenue (Million), by Mode of Delivery 2025 & 2033
- Figure 52: Middle East and Africa Virtual Care Market Volume (K Unit), by Mode of Delivery 2025 & 2033
- Figure 53: Middle East and Africa Virtual Care Market Revenue Share (%), by Mode of Delivery 2025 & 2033
- Figure 54: Middle East and Africa Virtual Care Market Volume Share (%), by Mode of Delivery 2025 & 2033
- Figure 55: Middle East and Africa Virtual Care Market Revenue (Million), by Component 2025 & 2033
- Figure 56: Middle East and Africa Virtual Care Market Volume (K Unit), by Component 2025 & 2033
- Figure 57: Middle East and Africa Virtual Care Market Revenue Share (%), by Component 2025 & 2033
- Figure 58: Middle East and Africa Virtual Care Market Volume Share (%), by Component 2025 & 2033
- Figure 59: Middle East and Africa Virtual Care Market Revenue (Million), by End Users 2025 & 2033
- Figure 60: Middle East and Africa Virtual Care Market Volume (K Unit), by End Users 2025 & 2033
- Figure 61: Middle East and Africa Virtual Care Market Revenue Share (%), by End Users 2025 & 2033
- Figure 62: Middle East and Africa Virtual Care Market Volume Share (%), by End Users 2025 & 2033
- Figure 63: Middle East and Africa Virtual Care Market Revenue (Million), by Country 2025 & 2033
- Figure 64: Middle East and Africa Virtual Care Market Volume (K Unit), by Country 2025 & 2033
- Figure 65: Middle East and Africa Virtual Care Market Revenue Share (%), by Country 2025 & 2033
- Figure 66: Middle East and Africa Virtual Care Market Volume Share (%), by Country 2025 & 2033
- Figure 67: South America Virtual Care Market Revenue (Million), by Mode of Delivery 2025 & 2033
- Figure 68: South America Virtual Care Market Volume (K Unit), by Mode of Delivery 2025 & 2033
- Figure 69: South America Virtual Care Market Revenue Share (%), by Mode of Delivery 2025 & 2033
- Figure 70: South America Virtual Care Market Volume Share (%), by Mode of Delivery 2025 & 2033
- Figure 71: South America Virtual Care Market Revenue (Million), by Component 2025 & 2033
- Figure 72: South America Virtual Care Market Volume (K Unit), by Component 2025 & 2033
- Figure 73: South America Virtual Care Market Revenue Share (%), by Component 2025 & 2033
- Figure 74: South America Virtual Care Market Volume Share (%), by Component 2025 & 2033
- Figure 75: South America Virtual Care Market Revenue (Million), by End Users 2025 & 2033
- Figure 76: South America Virtual Care Market Volume (K Unit), by End Users 2025 & 2033
- Figure 77: South America Virtual Care Market Revenue Share (%), by End Users 2025 & 2033
- Figure 78: South America Virtual Care Market Volume Share (%), by End Users 2025 & 2033
- Figure 79: South America Virtual Care Market Revenue (Million), by Country 2025 & 2033
- Figure 80: South America Virtual Care Market Volume (K Unit), by Country 2025 & 2033
- Figure 81: South America Virtual Care Market Revenue Share (%), by Country 2025 & 2033
- Figure 82: South America Virtual Care Market Volume Share (%), by Country 2025 & 2033
List of Tables
- Table 1: Global Virtual Care Market Revenue Million Forecast, by Mode of Delivery 2020 & 2033
- Table 2: Global Virtual Care Market Volume K Unit Forecast, by Mode of Delivery 2020 & 2033
- Table 3: Global Virtual Care Market Revenue Million Forecast, by Component 2020 & 2033
- Table 4: Global Virtual Care Market Volume K Unit Forecast, by Component 2020 & 2033
- Table 5: Global Virtual Care Market Revenue Million Forecast, by End Users 2020 & 2033
- Table 6: Global Virtual Care Market Volume K Unit Forecast, by End Users 2020 & 2033
- Table 7: Global Virtual Care Market Revenue Million Forecast, by Region 2020 & 2033
- Table 8: Global Virtual Care Market Volume K Unit Forecast, by Region 2020 & 2033
- Table 9: Global Virtual Care Market Revenue Million Forecast, by Mode of Delivery 2020 & 2033
- Table 10: Global Virtual Care Market Volume K Unit Forecast, by Mode of Delivery 2020 & 2033
- Table 11: Global Virtual Care Market Revenue Million Forecast, by Component 2020 & 2033
- Table 12: Global Virtual Care Market Volume K Unit Forecast, by Component 2020 & 2033
- Table 13: Global Virtual Care Market Revenue Million Forecast, by End Users 2020 & 2033
- Table 14: Global Virtual Care Market Volume K Unit Forecast, by End Users 2020 & 2033
- Table 15: Global Virtual Care Market Revenue Million Forecast, by Country 2020 & 2033
- Table 16: Global Virtual Care Market Volume K Unit Forecast, by Country 2020 & 2033
- Table 17: United States Virtual Care Market Revenue (Million) Forecast, by Application 2020 & 2033
- Table 18: United States Virtual Care Market Volume (K Unit) Forecast, by Application 2020 & 2033
- Table 19: Canada Virtual Care Market Revenue (Million) Forecast, by Application 2020 & 2033
- Table 20: Canada Virtual Care Market Volume (K Unit) Forecast, by Application 2020 & 2033
- Table 21: Mexico Virtual Care Market Revenue (Million) Forecast, by Application 2020 & 2033
- Table 22: Mexico Virtual Care Market Volume (K Unit) Forecast, by Application 2020 & 2033
- Table 23: Global Virtual Care Market Revenue Million Forecast, by Mode of Delivery 2020 & 2033
- Table 24: Global Virtual Care Market Volume K Unit Forecast, by Mode of Delivery 2020 & 2033
- Table 25: Global Virtual Care Market Revenue Million Forecast, by Component 2020 & 2033
- Table 26: Global Virtual Care Market Volume K Unit Forecast, by Component 2020 & 2033
- Table 27: Global Virtual Care Market Revenue Million Forecast, by End Users 2020 & 2033
- Table 28: Global Virtual Care Market Volume K Unit Forecast, by End Users 2020 & 2033
- Table 29: Global Virtual Care Market Revenue Million Forecast, by Country 2020 & 2033
- Table 30: Global Virtual Care Market Volume K Unit Forecast, by Country 2020 & 2033
- Table 31: Germany Virtual Care Market Revenue (Million) Forecast, by Application 2020 & 2033
- Table 32: Germany Virtual Care Market Volume (K Unit) Forecast, by Application 2020 & 2033
- Table 33: United Kingdom Virtual Care Market Revenue (Million) Forecast, by Application 2020 & 2033
- Table 34: United Kingdom Virtual Care Market Volume (K Unit) Forecast, by Application 2020 & 2033
- Table 35: France Virtual Care Market Revenue (Million) Forecast, by Application 2020 & 2033
- Table 36: France Virtual Care Market Volume (K Unit) Forecast, by Application 2020 & 2033
- Table 37: Italy Virtual Care Market Revenue (Million) Forecast, by Application 2020 & 2033
- Table 38: Italy Virtual Care Market Volume (K Unit) Forecast, by Application 2020 & 2033
- Table 39: Spain Virtual Care Market Revenue (Million) Forecast, by Application 2020 & 2033
- Table 40: Spain Virtual Care Market Volume (K Unit) Forecast, by Application 2020 & 2033
- Table 41: Rest of Europe Virtual Care Market Revenue (Million) Forecast, by Application 2020 & 2033
- Table 42: Rest of Europe Virtual Care Market Volume (K Unit) Forecast, by Application 2020 & 2033
- Table 43: Global Virtual Care Market Revenue Million Forecast, by Mode of Delivery 2020 & 2033
- Table 44: Global Virtual Care Market Volume K Unit Forecast, by Mode of Delivery 2020 & 2033
- Table 45: Global Virtual Care Market Revenue Million Forecast, by Component 2020 & 2033
- Table 46: Global Virtual Care Market Volume K Unit Forecast, by Component 2020 & 2033
- Table 47: Global Virtual Care Market Revenue Million Forecast, by End Users 2020 & 2033
- Table 48: Global Virtual Care Market Volume K Unit Forecast, by End Users 2020 & 2033
- Table 49: Global Virtual Care Market Revenue Million Forecast, by Country 2020 & 2033
- Table 50: Global Virtual Care Market Volume K Unit Forecast, by Country 2020 & 2033
- Table 51: China Virtual Care Market Revenue (Million) Forecast, by Application 2020 & 2033
- Table 52: China Virtual Care Market Volume (K Unit) Forecast, by Application 2020 & 2033
- Table 53: Japan Virtual Care Market Revenue (Million) Forecast, by Application 2020 & 2033
- Table 54: Japan Virtual Care Market Volume (K Unit) Forecast, by Application 2020 & 2033
- Table 55: India Virtual Care Market Revenue (Million) Forecast, by Application 2020 & 2033
- Table 56: India Virtual Care Market Volume (K Unit) Forecast, by Application 2020 & 2033
- Table 57: Australia Virtual Care Market Revenue (Million) Forecast, by Application 2020 & 2033
- Table 58: Australia Virtual Care Market Volume (K Unit) Forecast, by Application 2020 & 2033
- Table 59: South Korea Virtual Care Market Revenue (Million) Forecast, by Application 2020 & 2033
- Table 60: South Korea Virtual Care Market Volume (K Unit) Forecast, by Application 2020 & 2033
- Table 61: Rest of Asia Pacific Virtual Care Market Revenue (Million) Forecast, by Application 2020 & 2033
- Table 62: Rest of Asia Pacific Virtual Care Market Volume (K Unit) Forecast, by Application 2020 & 2033
- Table 63: Global Virtual Care Market Revenue Million Forecast, by Mode of Delivery 2020 & 2033
- Table 64: Global Virtual Care Market Volume K Unit Forecast, by Mode of Delivery 2020 & 2033
- Table 65: Global Virtual Care Market Revenue Million Forecast, by Component 2020 & 2033
- Table 66: Global Virtual Care Market Volume K Unit Forecast, by Component 2020 & 2033
- Table 67: Global Virtual Care Market Revenue Million Forecast, by End Users 2020 & 2033
- Table 68: Global Virtual Care Market Volume K Unit Forecast, by End Users 2020 & 2033
- Table 69: Global Virtual Care Market Revenue Million Forecast, by Country 2020 & 2033
- Table 70: Global Virtual Care Market Volume K Unit Forecast, by Country 2020 & 2033
- Table 71: GCC Virtual Care Market Revenue (Million) Forecast, by Application 2020 & 2033
- Table 72: GCC Virtual Care Market Volume (K Unit) Forecast, by Application 2020 & 2033
- Table 73: South Africa Virtual Care Market Revenue (Million) Forecast, by Application 2020 & 2033
- Table 74: South Africa Virtual Care Market Volume (K Unit) Forecast, by Application 2020 & 2033
- Table 75: Rest of Middle East and Africa Virtual Care Market Revenue (Million) Forecast, by Application 2020 & 2033
- Table 76: Rest of Middle East and Africa Virtual Care Market Volume (K Unit) Forecast, by Application 2020 & 2033
- Table 77: Global Virtual Care Market Revenue Million Forecast, by Mode of Delivery 2020 & 2033
- Table 78: Global Virtual Care Market Volume K Unit Forecast, by Mode of Delivery 2020 & 2033
- Table 79: Global Virtual Care Market Revenue Million Forecast, by Component 2020 & 2033
- Table 80: Global Virtual Care Market Volume K Unit Forecast, by Component 2020 & 2033
- Table 81: Global Virtual Care Market Revenue Million Forecast, by End Users 2020 & 2033
- Table 82: Global Virtual Care Market Volume K Unit Forecast, by End Users 2020 & 2033
- Table 83: Global Virtual Care Market Revenue Million Forecast, by Country 2020 & 2033
- Table 84: Global Virtual Care Market Volume K Unit Forecast, by Country 2020 & 2033
- Table 85: Brazil Virtual Care Market Revenue (Million) Forecast, by Application 2020 & 2033
- Table 86: Brazil Virtual Care Market Volume (K Unit) Forecast, by Application 2020 & 2033
- Table 87: Argentina Virtual Care Market Revenue (Million) Forecast, by Application 2020 & 2033
- Table 88: Argentina Virtual Care Market Volume (K Unit) Forecast, by Application 2020 & 2033
- Table 89: Rest of South America Virtual Care Market Revenue (Million) Forecast, by Application 2020 & 2033
- Table 90: Rest of South America Virtual Care Market Volume (K Unit) Forecast, by Application 2020 & 2033
Frequently Asked Questions
1. What is the projected Compound Annual Growth Rate (CAGR) of the Virtual Care Market?
The projected CAGR is approximately 26.10%.
2. Which companies are prominent players in the Virtual Care Market?
Key companies in the market include American Well Corporation, Oracle Corporation (Cerner), Teladoc Health Inc, United HealthCare Services Inc, MDLIVE, Medocity Inc, Amazon com Inc, General Electric Company, VirtualHealth, CVS Health.
3. What are the main segments of the Virtual Care Market?
The market segments include Mode of Delivery, Component, End Users.
4. Can you provide details about the market size?
The market size is estimated to be USD 12.84 Million as of 2022.
5. What are some drivers contributing to market growth?
Increasing Number of Patients Adopting Virtual Care and Government Initiatives Towards Virtual Care Access; Advantages Of Virtual Care and New Service Launches by Market Players.
6. What are the notable trends driving market growth?
Home Healthcare Segment is Expected to Witness Significant Growth Over the Forecast Period.
7. Are there any restraints impacting market growth?
Lack of Physician Support and Hospital Integration Issues Due to Privacy Concerns.
8. Can you provide examples of recent developments in the market?
In May 2022 CVS Health launched CVS Health Virtual Primary Care for its CVS Caremark members. The CVS Health Virtual Primary Care is a telehealth service that gives members an on-demand virtual care link to primary care providers, as well as urgent care, chronic care management, and behavioral care services, along with other services.
9. What pricing options are available for accessing the report?
Pricing options include single-user, multi-user, and enterprise licenses priced at USD 4750, USD 5250, and USD 8750 respectively.
10. Is the market size provided in terms of value or volume?
The market size is provided in terms of value, measured in Million and volume, measured in K Unit.
11. Are there any specific market keywords associated with the report?
Yes, the market keyword associated with the report is "Virtual Care Market," which aids in identifying and referencing the specific market segment covered.
12. How do I determine which pricing option suits my needs best?
The pricing options vary based on user requirements and access needs. Individual users may opt for single-user licenses, while businesses requiring broader access may choose multi-user or enterprise licenses for cost-effective access to the report.
13. Are there any additional resources or data provided in the Virtual Care Market report?
While the report offers comprehensive insights, it's advisable to review the specific contents or supplementary materials provided to ascertain if additional resources or data are available.
14. How can I stay updated on further developments or reports in the Virtual Care Market?
To stay informed about further developments, trends, and reports in the Virtual Care Market, consider subscribing to industry newsletters, following relevant companies and organizations, or regularly checking reputable industry news sources and publications.
Methodology
Step 1 - Identification of Relevant Samples Size from Population Database


Step 2 - Approaches for Defining Global Market Size (Value, Volume* & Price*)

Note*: In applicable scenarios
Step 3 - Data Sources
Primary Research
- Web Analytics
- Survey Reports
- Research Institute
- Latest Research Reports
- Opinion Leaders
Secondary Research
- Annual Reports
- White Paper
- Latest Press Release
- Industry Association
- Paid Database
- Investor Presentations

Step 4 - Data Triangulation
Involves using different sources of information in order to increase the validity of a study
These sources are likely to be stakeholders in a program - participants, other researchers, program staff, other community members, and so on.
Then we put all data in single framework & apply various statistical tools to find out the dynamic on the market.
During the analysis stage, feedback from the stakeholder groups would be compared to determine areas of agreement as well as areas of divergence