

Key Insights
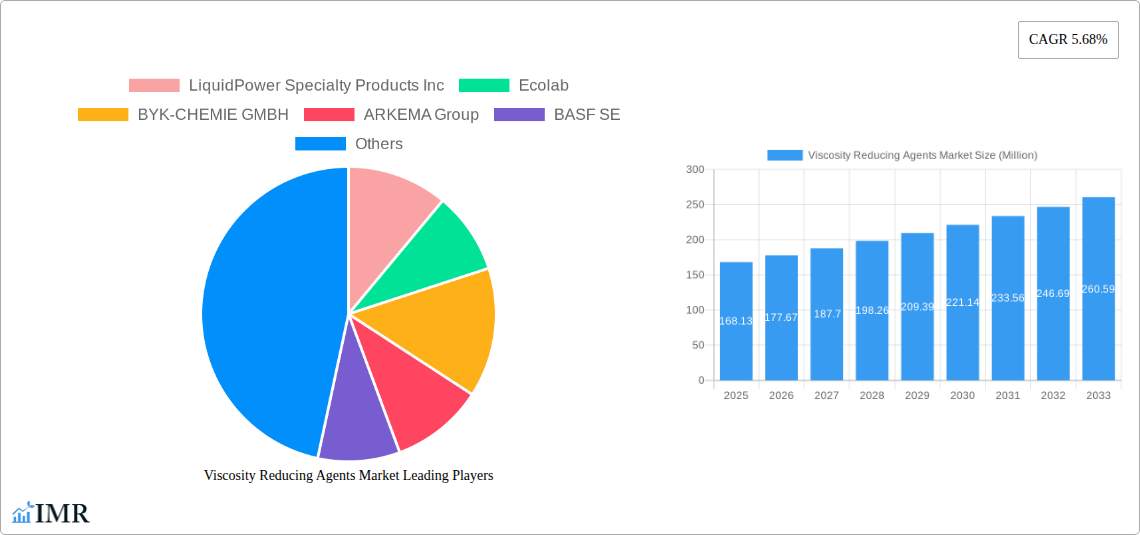
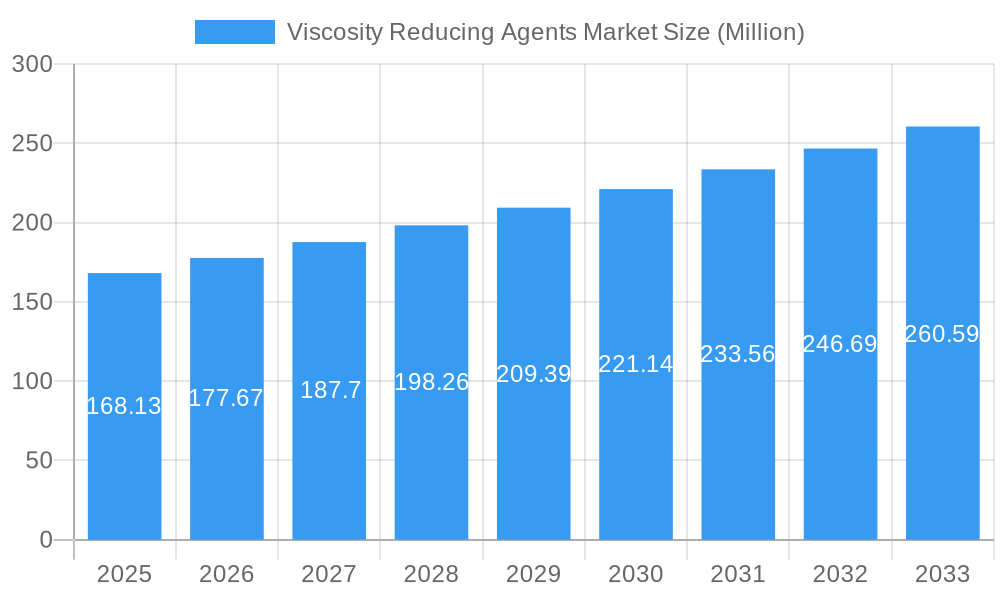
The global Viscosity Reducing Agents market is poised for significant expansion, projected to reach a substantial $168.13 million by 2025, with a robust Compound Annual Growth Rate (CAGR) of 5.68% expected to propel it through 2033. This growth is primarily fueled by the escalating demand from the oil and gas industry, where these agents are crucial for optimizing the flow of crude oil and natural gas through pipelines, particularly in challenging extraction environments. The increasing exploration and production activities, coupled with the need for enhanced operational efficiency and reduced energy consumption in fluid transportation, are key drivers. Furthermore, the paints and coatings sector is witnessing a growing adoption of viscosity reducing agents to improve application properties, such as sprayability and leveling, leading to higher quality finishes and reduced waste.
Viscosity Reducing Agents Market Market Size (In Million)
The market's trajectory is also influenced by emerging trends, including the development of more environmentally friendly and high-performance viscosity reducing agents, driven by stricter environmental regulations and a growing industry focus on sustainability. Advancements in additive technology are enabling the creation of specialized formulations catering to specific industrial needs across plastics manufacturing and other diverse industrial applications. While the market benefits from strong demand, potential restraints such as fluctuating raw material prices and the complexity of product formulation and application can present challenges. Nonetheless, the continuous innovation in product development and the expanding application spectrum across various end-user industries are expected to outweigh these limitations, ensuring a positive growth outlook for the viscosity reducing agents market.
Viscosity Reducing Agents Market Company Market Share
Viscosity Reducing Agents Market: Driving Efficiency Across Industries
This comprehensive report offers an in-depth analysis of the global Viscosity Reducing Agents market, a critical component for optimizing fluid flow and enhancing process efficiency across numerous industrial applications. The market is segmented by type into Drag Reducing Agents, Surfactants & Additives, Dispersing Agents, and Others, serving key end-user industries such as Oil & Gas, Paints & Coatings, Plastics, and Other Manufacturing Industries. The study spans the historical period from 2019 to 2024, with a base year of 2025, and provides detailed projections for the forecast period of 2025 to 2033.
Viscosity Reducing Agents Market Market Dynamics & Structure
The global Viscosity Reducing Agents market exhibits a moderately concentrated structure, characterized by the presence of established global players and specialized regional manufacturers. Technological innovation is a key driver, with continuous research and development focused on creating more effective, eco-friendly, and application-specific formulations. Regulatory frameworks, particularly concerning environmental impact and safety standards, are increasingly influencing product development and market entry. Competitive product substitutes exist, especially in niche applications, but highly specialized viscosity reducers maintain strong market positions. End-user demographics are shifting towards greater demand for sustainable and high-performance solutions, particularly within the burgeoning Oil & Gas sector's need for enhanced oil recovery and efficient pipeline transport, and the Paints & Coatings industry's drive for improved application properties and reduced VOC emissions. Mergers and acquisitions (M&A) trends are notable, as larger entities seek to expand their product portfolios and market reach, further consolidating the competitive landscape. For instance, recent M&A activities have aimed at integrating advanced chemical synthesis capabilities with existing distribution networks. Barriers to innovation include high R&D costs and the stringent validation processes required for performance-critical applications.
- Market Concentration: Moderately concentrated with a mix of global leaders and specialized players.
- Technological Innovation Drivers: Focus on enhanced efficacy, sustainability, and tailored solutions.
- Regulatory Frameworks: Growing emphasis on environmental compliance and safety standards.
- Competitive Product Substitutes: Present but often superseded by specialized viscosity reducers.
- End-User Demographics: Demand for sustainable, high-performance, and cost-effective solutions.
- M&A Trends: Strategic acquisitions to bolster product offerings and market presence.
- Innovation Barriers: High R&D expenditure and rigorous product validation requirements.
Viscosity Reducing Agents Market Growth Trends & Insights
The Viscosity Reducing Agents market is poised for robust growth, driven by an escalating demand for improved operational efficiency and product performance across diverse industrial sectors. The market size is projected to expand significantly from an estimated value of \$xx Million in 2025, exhibiting a Compound Annual Growth Rate (CAGR) of xx% over the forecast period. This growth trajectory is underpinned by increasing investments in infrastructure, particularly in the Oil & Gas sector, where drag-reducing agents are crucial for optimizing crude oil transportation through pipelines, reducing pumping energy requirements, and enhancing flow rates. The adoption rates of advanced viscosity modifiers are accelerating as industries recognize their value in improving product quality, reducing processing costs, and meeting stringent environmental regulations. Technological disruptions, such as the development of novel polymer chemistries and nano-based additives, are further enhancing the performance characteristics of viscosity reducing agents, offering superior flow control and stability. Consumer behavior shifts are also playing a pivotal role, with a growing preference for eco-friendly and biodegradable formulations, pushing manufacturers to invest in sustainable product development. The Paints & Coatings industry is witnessing increased application of these agents to improve rheology, enhance application ease, and achieve desired surface finishes. Similarly, the Plastics industry is leveraging these additives to optimize melt processing and improve the mechanical properties of polymers. The "Other Manufacturing Industries" segment, encompassing textiles, adhesives, and construction chemicals, is also a growing contributor to market expansion, as these industries seek to fine-tune their processes and product formulations. The integration of digital technologies in chemical manufacturing is further enabling precision in formulation and application, leading to more targeted and effective viscosity reduction. The market penetration of these agents is expected to deepen as their cost-effectiveness and performance benefits become more widely understood and accepted across traditional and emerging industrial applications.
Dominant Regions, Countries, or Segments in Viscosity Reducing Agents Market
The Oil & Gas end-user industry stands as the dominant segment within the global Viscosity Reducing Agents market, significantly driving its growth and shaping its dynamics. This dominance is primarily attributed to the critical role viscosity reducing agents, particularly drag-reducing agents (DRAs), play in optimizing the exploration, production, and transportation of crude oil and natural gas. The sheer scale of operations within the Oil & Gas sector necessitates efficient fluid management, making these agents indispensable for reducing frictional drag in pipelines, thereby increasing flow rates and decreasing energy consumption for pumping.
- Oil & Gas Sector Dominance: This segment accounts for the largest market share due to its critical need for flow assurance and operational efficiency.
- Enhanced Oil Recovery (EOR): Viscosity reducers are vital in EOR techniques to improve the mobility of viscous crude oil, increasing extraction efficiency.
- Pipeline Transportation: DRAs significantly reduce turbulence and friction within pipelines, enabling higher throughput and reduced energy costs.
- Offshore Operations: Their application is crucial in challenging offshore environments for efficient product transfer.
- North America as a Leading Region: This region, particularly the United States and Canada, is a major hub for the Viscosity Reducing Agents market, propelled by its extensive oil and gas reserves and advanced petrochemical industry.
- Abundant Shale Gas and Oil Production: The shale revolution has led to increased demand for flow improvers and processing chemicals.
- Developed Infrastructure: A robust network of pipelines and processing facilities supports the widespread use of viscosity reducing agents.
- Technological Advancements: Significant investments in R&D by key players based in this region contribute to innovative product development.
- Drag Reducing Agents (DRAs) as a Leading Type: Among the different types, DRAs hold a substantial market share due to their direct application in enhancing fluid flow in high-viscosity fluids.
- High Efficacy: DRAs are highly effective even at low concentrations, offering a cost-effective solution for flow enhancement.
- Versatile Application: Used in crude oil, refined fuels, and even water transportation, showcasing their broad applicability.
- Performance Metrics: Focus on shear stability and solubility in various fluid matrices.
The economic policies supporting energy production, coupled with substantial investments in infrastructure development within the Oil & Gas sector, act as key drivers for this segment's dominance. Furthermore, the inherent complexity of extracting and transporting viscous hydrocarbons necessitates advanced chemical solutions, ensuring a sustained demand for viscosity reducing agents. The growth potential within this segment remains high as industries continue to seek ways to maximize resource extraction and optimize logistical operations.
Viscosity Reducing Agents Market Product Landscape
The product landscape of Viscosity Reducing Agents is characterized by continuous innovation focused on enhancing performance, sustainability, and cost-effectiveness. Key product developments include novel polymer-based drag-reducing agents offering improved shear stability and broader operating temperature ranges. Surfactants and additives are being engineered for enhanced emulsification and dispersion properties, crucial for paints, coatings, and plastics manufacturing. Dispersing agents are witnessing advancements in their ability to stabilize fine particles, leading to improved product homogeneity and shelf-life in various formulations. Unique selling propositions revolve around tailored solutions for specific fluid types and operating conditions, with a growing emphasis on bio-based and low-VOC formulations. Technological advancements are driving the development of agents that require lower dosages while delivering superior viscosity reduction and improved flow characteristics.
Key Drivers, Barriers & Challenges in Viscosity Reducing Agents Market
The Viscosity Reducing Agents market is propelled by several key drivers, including the escalating global demand for efficient fluid transportation in the Oil & Gas industry, leading to increased adoption of drag-reducing agents for enhanced flow rates and reduced energy consumption. The growing need for improved product quality and processing efficiency in sectors like Paints & Coatings and Plastics further fuels demand for specialized viscosity modifiers. Environmental regulations promoting reduced emissions and sustainable manufacturing practices encourage the development and use of eco-friendly viscosity reducing agents.
- Key Drivers:
- Oil & Gas Efficiency Needs: Demand for optimized crude oil and gas transportation.
- Product Quality Enhancement: Improving rheology and application properties in coatings and plastics.
- Sustainability Mandates: Drive for eco-friendly and low-VOC formulations.
- Cost Reduction: Lower energy consumption and improved process yields.
However, the market faces significant barriers and challenges. High research and development costs associated with creating novel and high-performance formulations can be a restraint. Stringent regulatory approvals for new chemical entities and complex supply chain logistics, especially for specialized raw materials, pose further hurdles. Intense competition from established players and the availability of some generic substitutes can impact pricing strategies.
- Key Barriers & Challenges:
- High R&D Costs: Investment in developing advanced formulations.
- Regulatory Hurdles: Complex approval processes for new chemicals.
- Supply Chain Volatility: Sourcing specialized raw materials and managing logistics.
- Competitive Pressure: Price sensitivity and market saturation in certain segments.
Emerging Opportunities in Viscosity Reducing Agents Market
Emerging opportunities in the Viscosity Reducing Agents market lie in the development of biodegradable and bio-based viscosity reducers, catering to the growing environmental consciousness across industries. Untapped markets in developing economies, particularly those with expanding Oil & Gas infrastructure and burgeoning manufacturing sectors, present significant growth potential. Innovative applications in specialized sectors like advanced materials, pharmaceuticals, and even food processing, where precise viscosity control is paramount, offer avenues for novel product development. Evolving consumer preferences for sustainable and high-performance products will continue to drive demand for advanced and environmentally friendly viscosity reducing solutions.
Growth Accelerators in the Viscosity Reducing Agents Market Industry
Growth accelerators for the Viscosity Reducing Agents industry are predominantly driven by ongoing technological breakthroughs in polymer science and nanotechnology, leading to the development of more efficient and versatile agents. Strategic partnerships and collaborations between chemical manufacturers and end-users are crucial for co-developing tailored solutions and accelerating market adoption. Market expansion strategies, including geographical diversification into emerging economies and deeper penetration into existing segments through product differentiation, will also significantly contribute to long-term growth. The increasing focus on operational efficiency and cost optimization across all industrial sectors will continue to make viscosity reducing agents a vital component for business success.
Key Players Shaping the Viscosity Reducing Agents Market Market
- LiquidPower Specialty Products Inc
- Ecolab
- BYK-CHEMIE GMBH
- ARKEMA Group
- BASF SE
- Alberta Treating Chemicals LTD
- Qflo
- The Lubrizol Corporation
- Oil Flux
- Baker Hughes Company
- NuGenTecx
- CHINAFLOC
- Innospec
Notable Milestones in Viscosity Reducing Agents Market Sector
- 2020/05: Launch of new eco-friendly drag-reducing agents with enhanced biodegradability by [Company Name].
- 2021/11: Acquisition of a specialized additives manufacturer by a major chemical conglomerate to expand its portfolio.
- 2022/03: Development of a novel surfactant technology offering improved stability in high-temperature applications by [Company Name].
- 2023/07: Introduction of a new line of dispersing agents designed for water-based coating systems, catering to stringent VOC regulations.
- 2024/01: Strategic partnership formed between a leading oilfield chemical supplier and a polymer research institute to accelerate DRA innovation.
In-Depth Viscosity Reducing Agents Market Market Outlook
The future outlook for the Viscosity Reducing Agents market is exceptionally promising, driven by an unwavering demand for enhanced operational efficiency and product performance. Accelerating innovation in advanced polymer chemistries and sustainable formulations will continue to expand the application scope of these agents. Strategic alliances and a focus on emerging markets will be pivotal in capturing new growth opportunities. The intrinsic value of viscosity reducing agents in optimizing resource utilization and reducing environmental impact positions them as indispensable solutions for industries striving for sustainability and cost-effectiveness. The market is set for sustained expansion, fueled by technological advancements and evolving industrial demands.
Viscosity Reducing Agents Market Segmentation
-
1. Type
- 1.1. Drag Reducing Agents
- 1.2. Surfactants & Additives
- 1.3. Dispersing Agents
- 1.4. Others
-
2. End-user Industry
- 2.1. Oil & Gas
- 2.2. Paints & Coatings
- 2.3. Plastics
- 2.4. Other Manufacturing Industries
Viscosity Reducing Agents Market Segmentation By Geography
-
1. Asia Pacific
- 1.1. China
- 1.2. India
- 1.3. Japan
- 1.4. South Korea
- 1.5. Rest of Asia Pacific
-
2. North America
- 2.1. United States
- 2.2. Canada
- 2.3. Mexico
-
3. Europe
- 3.1. Germany
- 3.2. United Kingdom
- 3.3. Italy
- 3.4. France
- 3.5. Rest of Europe
-
4. South America
- 4.1. Brazil
- 4.2. Argentina
- 4.3. Rest of South America
-
5. Middle East and Africa
- 5.1. Saudi Arabia
- 5.2. South Africa
- 5.3. Rest of Middle East and Africa
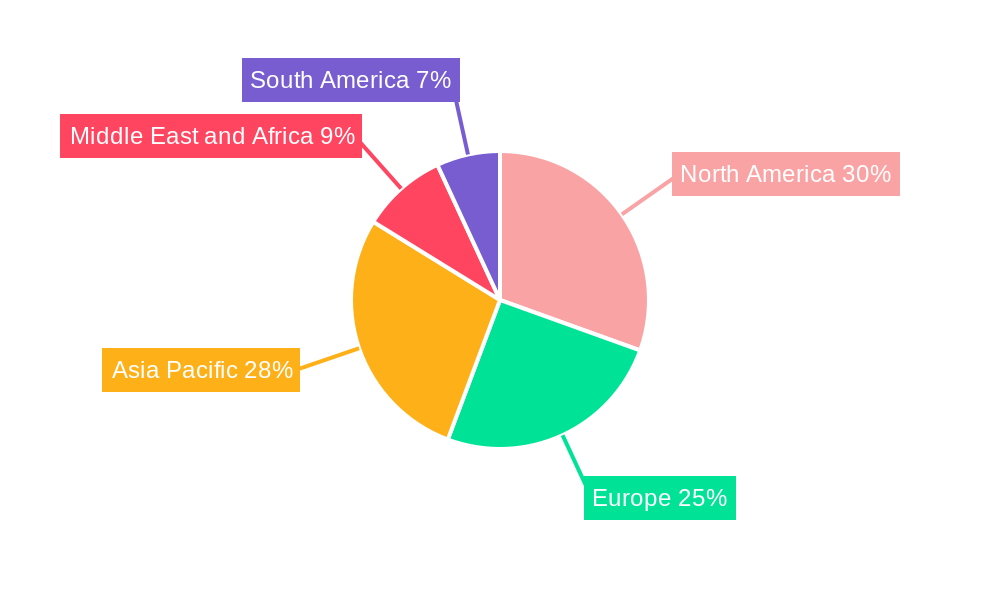
Viscosity Reducing Agents Market Regional Market Share
Geographic Coverage of Viscosity Reducing Agents Market
Viscosity Reducing Agents Market REPORT HIGHLIGHTS
| Aspects | Details |
|---|---|
| Study Period | 2020-2034 |
| Base Year | 2025 |
| Estimated Year | 2026 |
| Forecast Period | 2026-2034 |
| Historical Period | 2020-2025 |
| Growth Rate | CAGR of 5.68% from 2020-2034 |
| Segmentation |
|
Table of Contents
- 1. Introduction
- 1.1. Research Scope
- 1.2. Market Segmentation
- 1.3. Research Objective
- 1.4. Definitions and Assumptions
- 2. Executive Summary
- 2.1. Market Snapshot
- 3. Market Dynamics
- 3.1. Market Drivers
- 3.2. Market Restrains
- 3.3. Market Trends
- 3.4. Market Opportunities
- 4. Market Factor Analysis
- 4.1. Porters Five Forces
- 4.1.1. Bargaining Power of Suppliers
- 4.1.2. Bargaining Power of Buyers
- 4.1.3. Threat of New Entrants
- 4.1.4. Threat of Substitutes
- 4.1.5. Competitive Rivalry
- 4.2. PESTEL analysis
- 4.3. BCG Analysis
- 4.3.1. Stars (High Growth, High Market Share)
- 4.3.2. Cash Cows (Low Growth, High Market Share)
- 4.3.3. Question Mark (High Growth, Low Market Share)
- 4.3.4. Dogs (Low Growth, Low Market Share)
- 4.4. Ansoff Matrix Analysis
- 4.5. Supply Chain Analysis
- 4.6. Regulatory Landscape
- 4.7. Current Market Potential and Opportunity Assessment (TAM–SAM–SOM Framework)
- 4.8. IMR Analyst Note
- 4.1. Porters Five Forces
- 5. Market Analysis, Insights and Forecast 2021-2033
- 5.1. Market Analysis, Insights and Forecast - by Type
- 5.1.1. Drag Reducing Agents
- 5.1.2. Surfactants & Additives
- 5.1.3. Dispersing Agents
- 5.1.4. Others
- 5.2. Market Analysis, Insights and Forecast - by End-user Industry
- 5.2.1. Oil & Gas
- 5.2.2. Paints & Coatings
- 5.2.3. Plastics
- 5.2.4. Other Manufacturing Industries
- 5.3. Market Analysis, Insights and Forecast - by Region
- 5.3.1. Asia Pacific
- 5.3.2. North America
- 5.3.3. Europe
- 5.3.4. South America
- 5.3.5. Middle East and Africa
- 5.1. Market Analysis, Insights and Forecast - by Type
- 6. Global Viscosity Reducing Agents Market Analysis, Insights and Forecast, 2021-2033
- 6.1. Market Analysis, Insights and Forecast - by Type
- 6.1.1. Drag Reducing Agents
- 6.1.2. Surfactants & Additives
- 6.1.3. Dispersing Agents
- 6.1.4. Others
- 6.2. Market Analysis, Insights and Forecast - by End-user Industry
- 6.2.1. Oil & Gas
- 6.2.2. Paints & Coatings
- 6.2.3. Plastics
- 6.2.4. Other Manufacturing Industries
- 6.1. Market Analysis, Insights and Forecast - by Type
- 7. Asia Pacific Viscosity Reducing Agents Market Analysis, Insights and Forecast, 2020-2032
- 7.1. Market Analysis, Insights and Forecast - by Type
- 7.1.1. Drag Reducing Agents
- 7.1.2. Surfactants & Additives
- 7.1.3. Dispersing Agents
- 7.1.4. Others
- 7.2. Market Analysis, Insights and Forecast - by End-user Industry
- 7.2.1. Oil & Gas
- 7.2.2. Paints & Coatings
- 7.2.3. Plastics
- 7.2.4. Other Manufacturing Industries
- 7.1. Market Analysis, Insights and Forecast - by Type
- 8. North America Viscosity Reducing Agents Market Analysis, Insights and Forecast, 2020-2032
- 8.1. Market Analysis, Insights and Forecast - by Type
- 8.1.1. Drag Reducing Agents
- 8.1.2. Surfactants & Additives
- 8.1.3. Dispersing Agents
- 8.1.4. Others
- 8.2. Market Analysis, Insights and Forecast - by End-user Industry
- 8.2.1. Oil & Gas
- 8.2.2. Paints & Coatings
- 8.2.3. Plastics
- 8.2.4. Other Manufacturing Industries
- 8.1. Market Analysis, Insights and Forecast - by Type
- 9. Europe Viscosity Reducing Agents Market Analysis, Insights and Forecast, 2020-2032
- 9.1. Market Analysis, Insights and Forecast - by Type
- 9.1.1. Drag Reducing Agents
- 9.1.2. Surfactants & Additives
- 9.1.3. Dispersing Agents
- 9.1.4. Others
- 9.2. Market Analysis, Insights and Forecast - by End-user Industry
- 9.2.1. Oil & Gas
- 9.2.2. Paints & Coatings
- 9.2.3. Plastics
- 9.2.4. Other Manufacturing Industries
- 9.1. Market Analysis, Insights and Forecast - by Type
- 10. South America Viscosity Reducing Agents Market Analysis, Insights and Forecast, 2020-2032
- 10.1. Market Analysis, Insights and Forecast - by Type
- 10.1.1. Drag Reducing Agents
- 10.1.2. Surfactants & Additives
- 10.1.3. Dispersing Agents
- 10.1.4. Others
- 10.2. Market Analysis, Insights and Forecast - by End-user Industry
- 10.2.1. Oil & Gas
- 10.2.2. Paints & Coatings
- 10.2.3. Plastics
- 10.2.4. Other Manufacturing Industries
- 10.1. Market Analysis, Insights and Forecast - by Type
- 11. Middle East and Africa Viscosity Reducing Agents Market Analysis, Insights and Forecast, 2020-2032
- 11.1. Market Analysis, Insights and Forecast - by Type
- 11.1.1. Drag Reducing Agents
- 11.1.2. Surfactants & Additives
- 11.1.3. Dispersing Agents
- 11.1.4. Others
- 11.2. Market Analysis, Insights and Forecast - by End-user Industry
- 11.2.1. Oil & Gas
- 11.2.2. Paints & Coatings
- 11.2.3. Plastics
- 11.2.4. Other Manufacturing Industries
- 11.1. Market Analysis, Insights and Forecast - by Type
- 12. Competitive Analysis
- 12.1. Company Profiles
- 12.1.1 LiquidPower Specialty Products Inc
- 12.1.1.1. Company Overview
- 12.1.1.2. Products
- 12.1.1.3. Company Financials
- 12.1.1.4. SWOT Analysis
- 12.1.2 Ecolab
- 12.1.2.1. Company Overview
- 12.1.2.2. Products
- 12.1.2.3. Company Financials
- 12.1.2.4. SWOT Analysis
- 12.1.3 BYK-CHEMIE GMBH
- 12.1.3.1. Company Overview
- 12.1.3.2. Products
- 12.1.3.3. Company Financials
- 12.1.3.4. SWOT Analysis
- 12.1.4 ARKEMA Group
- 12.1.4.1. Company Overview
- 12.1.4.2. Products
- 12.1.4.3. Company Financials
- 12.1.4.4. SWOT Analysis
- 12.1.5 BASF SE
- 12.1.5.1. Company Overview
- 12.1.5.2. Products
- 12.1.5.3. Company Financials
- 12.1.5.4. SWOT Analysis
- 12.1.6 Alberta Treating Chemicals LTD
- 12.1.6.1. Company Overview
- 12.1.6.2. Products
- 12.1.6.3. Company Financials
- 12.1.6.4. SWOT Analysis
- 12.1.7 Qflo
- 12.1.7.1. Company Overview
- 12.1.7.2. Products
- 12.1.7.3. Company Financials
- 12.1.7.4. SWOT Analysis
- 12.1.8 The Lubrizol Corporation
- 12.1.8.1. Company Overview
- 12.1.8.2. Products
- 12.1.8.3. Company Financials
- 12.1.8.4. SWOT Analysis
- 12.1.9 Oil Flux
- 12.1.9.1. Company Overview
- 12.1.9.2. Products
- 12.1.9.3. Company Financials
- 12.1.9.4. SWOT Analysis
- 12.1.10 Baker Hughes Company
- 12.1.10.1. Company Overview
- 12.1.10.2. Products
- 12.1.10.3. Company Financials
- 12.1.10.4. SWOT Analysis
- 12.1.11 NuGenTecx
- 12.1.11.1. Company Overview
- 12.1.11.2. Products
- 12.1.11.3. Company Financials
- 12.1.11.4. SWOT Analysis
- 12.1.12 CHINAFLOC
- 12.1.12.1. Company Overview
- 12.1.12.2. Products
- 12.1.12.3. Company Financials
- 12.1.12.4. SWOT Analysis
- 12.1.13 Innospec
- 12.1.13.1. Company Overview
- 12.1.13.2. Products
- 12.1.13.3. Company Financials
- 12.1.13.4. SWOT Analysis
- 12.1.1 LiquidPower Specialty Products Inc
- 12.2. Market Entropy
- 12.2.1 Company's Key Areas Served
- 12.2.2 Recent Developments
- 12.3. Company Market Share Analysis 2025
- 12.3.1 Top 5 Companies Market Share Analysis
- 12.3.2 Top 3 Companies Market Share Analysis
- 12.4. List of Potential Customers
- 13. Research Methodology
List of Figures
- Figure 1: Global Viscosity Reducing Agents Market Revenue Breakdown (Million, %) by Region 2025 & 2033
- Figure 2: Global Viscosity Reducing Agents Market Volume Breakdown (K Tons, %) by Region 2025 & 2033
- Figure 3: Asia Pacific Viscosity Reducing Agents Market Revenue (Million), by Type 2025 & 2033
- Figure 4: Asia Pacific Viscosity Reducing Agents Market Volume (K Tons), by Type 2025 & 2033
- Figure 5: Asia Pacific Viscosity Reducing Agents Market Revenue Share (%), by Type 2025 & 2033
- Figure 6: Asia Pacific Viscosity Reducing Agents Market Volume Share (%), by Type 2025 & 2033
- Figure 7: Asia Pacific Viscosity Reducing Agents Market Revenue (Million), by End-user Industry 2025 & 2033
- Figure 8: Asia Pacific Viscosity Reducing Agents Market Volume (K Tons), by End-user Industry 2025 & 2033
- Figure 9: Asia Pacific Viscosity Reducing Agents Market Revenue Share (%), by End-user Industry 2025 & 2033
- Figure 10: Asia Pacific Viscosity Reducing Agents Market Volume Share (%), by End-user Industry 2025 & 2033
- Figure 11: Asia Pacific Viscosity Reducing Agents Market Revenue (Million), by Country 2025 & 2033
- Figure 12: Asia Pacific Viscosity Reducing Agents Market Volume (K Tons), by Country 2025 & 2033
- Figure 13: Asia Pacific Viscosity Reducing Agents Market Revenue Share (%), by Country 2025 & 2033
- Figure 14: Asia Pacific Viscosity Reducing Agents Market Volume Share (%), by Country 2025 & 2033
- Figure 15: North America Viscosity Reducing Agents Market Revenue (Million), by Type 2025 & 2033
- Figure 16: North America Viscosity Reducing Agents Market Volume (K Tons), by Type 2025 & 2033
- Figure 17: North America Viscosity Reducing Agents Market Revenue Share (%), by Type 2025 & 2033
- Figure 18: North America Viscosity Reducing Agents Market Volume Share (%), by Type 2025 & 2033
- Figure 19: North America Viscosity Reducing Agents Market Revenue (Million), by End-user Industry 2025 & 2033
- Figure 20: North America Viscosity Reducing Agents Market Volume (K Tons), by End-user Industry 2025 & 2033
- Figure 21: North America Viscosity Reducing Agents Market Revenue Share (%), by End-user Industry 2025 & 2033
- Figure 22: North America Viscosity Reducing Agents Market Volume Share (%), by End-user Industry 2025 & 2033
- Figure 23: North America Viscosity Reducing Agents Market Revenue (Million), by Country 2025 & 2033
- Figure 24: North America Viscosity Reducing Agents Market Volume (K Tons), by Country 2025 & 2033
- Figure 25: North America Viscosity Reducing Agents Market Revenue Share (%), by Country 2025 & 2033
- Figure 26: North America Viscosity Reducing Agents Market Volume Share (%), by Country 2025 & 2033
- Figure 27: Europe Viscosity Reducing Agents Market Revenue (Million), by Type 2025 & 2033
- Figure 28: Europe Viscosity Reducing Agents Market Volume (K Tons), by Type 2025 & 2033
- Figure 29: Europe Viscosity Reducing Agents Market Revenue Share (%), by Type 2025 & 2033
- Figure 30: Europe Viscosity Reducing Agents Market Volume Share (%), by Type 2025 & 2033
- Figure 31: Europe Viscosity Reducing Agents Market Revenue (Million), by End-user Industry 2025 & 2033
- Figure 32: Europe Viscosity Reducing Agents Market Volume (K Tons), by End-user Industry 2025 & 2033
- Figure 33: Europe Viscosity Reducing Agents Market Revenue Share (%), by End-user Industry 2025 & 2033
- Figure 34: Europe Viscosity Reducing Agents Market Volume Share (%), by End-user Industry 2025 & 2033
- Figure 35: Europe Viscosity Reducing Agents Market Revenue (Million), by Country 2025 & 2033
- Figure 36: Europe Viscosity Reducing Agents Market Volume (K Tons), by Country 2025 & 2033
- Figure 37: Europe Viscosity Reducing Agents Market Revenue Share (%), by Country 2025 & 2033
- Figure 38: Europe Viscosity Reducing Agents Market Volume Share (%), by Country 2025 & 2033
- Figure 39: South America Viscosity Reducing Agents Market Revenue (Million), by Type 2025 & 2033
- Figure 40: South America Viscosity Reducing Agents Market Volume (K Tons), by Type 2025 & 2033
- Figure 41: South America Viscosity Reducing Agents Market Revenue Share (%), by Type 2025 & 2033
- Figure 42: South America Viscosity Reducing Agents Market Volume Share (%), by Type 2025 & 2033
- Figure 43: South America Viscosity Reducing Agents Market Revenue (Million), by End-user Industry 2025 & 2033
- Figure 44: South America Viscosity Reducing Agents Market Volume (K Tons), by End-user Industry 2025 & 2033
- Figure 45: South America Viscosity Reducing Agents Market Revenue Share (%), by End-user Industry 2025 & 2033
- Figure 46: South America Viscosity Reducing Agents Market Volume Share (%), by End-user Industry 2025 & 2033
- Figure 47: South America Viscosity Reducing Agents Market Revenue (Million), by Country 2025 & 2033
- Figure 48: South America Viscosity Reducing Agents Market Volume (K Tons), by Country 2025 & 2033
- Figure 49: South America Viscosity Reducing Agents Market Revenue Share (%), by Country 2025 & 2033
- Figure 50: South America Viscosity Reducing Agents Market Volume Share (%), by Country 2025 & 2033
- Figure 51: Middle East and Africa Viscosity Reducing Agents Market Revenue (Million), by Type 2025 & 2033
- Figure 52: Middle East and Africa Viscosity Reducing Agents Market Volume (K Tons), by Type 2025 & 2033
- Figure 53: Middle East and Africa Viscosity Reducing Agents Market Revenue Share (%), by Type 2025 & 2033
- Figure 54: Middle East and Africa Viscosity Reducing Agents Market Volume Share (%), by Type 2025 & 2033
- Figure 55: Middle East and Africa Viscosity Reducing Agents Market Revenue (Million), by End-user Industry 2025 & 2033
- Figure 56: Middle East and Africa Viscosity Reducing Agents Market Volume (K Tons), by End-user Industry 2025 & 2033
- Figure 57: Middle East and Africa Viscosity Reducing Agents Market Revenue Share (%), by End-user Industry 2025 & 2033
- Figure 58: Middle East and Africa Viscosity Reducing Agents Market Volume Share (%), by End-user Industry 2025 & 2033
- Figure 59: Middle East and Africa Viscosity Reducing Agents Market Revenue (Million), by Country 2025 & 2033
- Figure 60: Middle East and Africa Viscosity Reducing Agents Market Volume (K Tons), by Country 2025 & 2033
- Figure 61: Middle East and Africa Viscosity Reducing Agents Market Revenue Share (%), by Country 2025 & 2033
- Figure 62: Middle East and Africa Viscosity Reducing Agents Market Volume Share (%), by Country 2025 & 2033
List of Tables
- Table 1: Global Viscosity Reducing Agents Market Revenue Million Forecast, by Type 2020 & 2033
- Table 2: Global Viscosity Reducing Agents Market Volume K Tons Forecast, by Type 2020 & 2033
- Table 3: Global Viscosity Reducing Agents Market Revenue Million Forecast, by End-user Industry 2020 & 2033
- Table 4: Global Viscosity Reducing Agents Market Volume K Tons Forecast, by End-user Industry 2020 & 2033
- Table 5: Global Viscosity Reducing Agents Market Revenue Million Forecast, by Region 2020 & 2033
- Table 6: Global Viscosity Reducing Agents Market Volume K Tons Forecast, by Region 2020 & 2033
- Table 7: Global Viscosity Reducing Agents Market Revenue Million Forecast, by Type 2020 & 2033
- Table 8: Global Viscosity Reducing Agents Market Volume K Tons Forecast, by Type 2020 & 2033
- Table 9: Global Viscosity Reducing Agents Market Revenue Million Forecast, by End-user Industry 2020 & 2033
- Table 10: Global Viscosity Reducing Agents Market Volume K Tons Forecast, by End-user Industry 2020 & 2033
- Table 11: Global Viscosity Reducing Agents Market Revenue Million Forecast, by Country 2020 & 2033
- Table 12: Global Viscosity Reducing Agents Market Volume K Tons Forecast, by Country 2020 & 2033
- Table 13: China Viscosity Reducing Agents Market Revenue (Million) Forecast, by Application 2020 & 2033
- Table 14: China Viscosity Reducing Agents Market Volume (K Tons) Forecast, by Application 2020 & 2033
- Table 15: India Viscosity Reducing Agents Market Revenue (Million) Forecast, by Application 2020 & 2033
- Table 16: India Viscosity Reducing Agents Market Volume (K Tons) Forecast, by Application 2020 & 2033
- Table 17: Japan Viscosity Reducing Agents Market Revenue (Million) Forecast, by Application 2020 & 2033
- Table 18: Japan Viscosity Reducing Agents Market Volume (K Tons) Forecast, by Application 2020 & 2033
- Table 19: South Korea Viscosity Reducing Agents Market Revenue (Million) Forecast, by Application 2020 & 2033
- Table 20: South Korea Viscosity Reducing Agents Market Volume (K Tons) Forecast, by Application 2020 & 2033
- Table 21: Rest of Asia Pacific Viscosity Reducing Agents Market Revenue (Million) Forecast, by Application 2020 & 2033
- Table 22: Rest of Asia Pacific Viscosity Reducing Agents Market Volume (K Tons) Forecast, by Application 2020 & 2033
- Table 23: Global Viscosity Reducing Agents Market Revenue Million Forecast, by Type 2020 & 2033
- Table 24: Global Viscosity Reducing Agents Market Volume K Tons Forecast, by Type 2020 & 2033
- Table 25: Global Viscosity Reducing Agents Market Revenue Million Forecast, by End-user Industry 2020 & 2033
- Table 26: Global Viscosity Reducing Agents Market Volume K Tons Forecast, by End-user Industry 2020 & 2033
- Table 27: Global Viscosity Reducing Agents Market Revenue Million Forecast, by Country 2020 & 2033
- Table 28: Global Viscosity Reducing Agents Market Volume K Tons Forecast, by Country 2020 & 2033
- Table 29: United States Viscosity Reducing Agents Market Revenue (Million) Forecast, by Application 2020 & 2033
- Table 30: United States Viscosity Reducing Agents Market Volume (K Tons) Forecast, by Application 2020 & 2033
- Table 31: Canada Viscosity Reducing Agents Market Revenue (Million) Forecast, by Application 2020 & 2033
- Table 32: Canada Viscosity Reducing Agents Market Volume (K Tons) Forecast, by Application 2020 & 2033
- Table 33: Mexico Viscosity Reducing Agents Market Revenue (Million) Forecast, by Application 2020 & 2033
- Table 34: Mexico Viscosity Reducing Agents Market Volume (K Tons) Forecast, by Application 2020 & 2033
- Table 35: Global Viscosity Reducing Agents Market Revenue Million Forecast, by Type 2020 & 2033
- Table 36: Global Viscosity Reducing Agents Market Volume K Tons Forecast, by Type 2020 & 2033
- Table 37: Global Viscosity Reducing Agents Market Revenue Million Forecast, by End-user Industry 2020 & 2033
- Table 38: Global Viscosity Reducing Agents Market Volume K Tons Forecast, by End-user Industry 2020 & 2033
- Table 39: Global Viscosity Reducing Agents Market Revenue Million Forecast, by Country 2020 & 2033
- Table 40: Global Viscosity Reducing Agents Market Volume K Tons Forecast, by Country 2020 & 2033
- Table 41: Germany Viscosity Reducing Agents Market Revenue (Million) Forecast, by Application 2020 & 2033
- Table 42: Germany Viscosity Reducing Agents Market Volume (K Tons) Forecast, by Application 2020 & 2033
- Table 43: United Kingdom Viscosity Reducing Agents Market Revenue (Million) Forecast, by Application 2020 & 2033
- Table 44: United Kingdom Viscosity Reducing Agents Market Volume (K Tons) Forecast, by Application 2020 & 2033
- Table 45: Italy Viscosity Reducing Agents Market Revenue (Million) Forecast, by Application 2020 & 2033
- Table 46: Italy Viscosity Reducing Agents Market Volume (K Tons) Forecast, by Application 2020 & 2033
- Table 47: France Viscosity Reducing Agents Market Revenue (Million) Forecast, by Application 2020 & 2033
- Table 48: France Viscosity Reducing Agents Market Volume (K Tons) Forecast, by Application 2020 & 2033
- Table 49: Rest of Europe Viscosity Reducing Agents Market Revenue (Million) Forecast, by Application 2020 & 2033
- Table 50: Rest of Europe Viscosity Reducing Agents Market Volume (K Tons) Forecast, by Application 2020 & 2033
- Table 51: Global Viscosity Reducing Agents Market Revenue Million Forecast, by Type 2020 & 2033
- Table 52: Global Viscosity Reducing Agents Market Volume K Tons Forecast, by Type 2020 & 2033
- Table 53: Global Viscosity Reducing Agents Market Revenue Million Forecast, by End-user Industry 2020 & 2033
- Table 54: Global Viscosity Reducing Agents Market Volume K Tons Forecast, by End-user Industry 2020 & 2033
- Table 55: Global Viscosity Reducing Agents Market Revenue Million Forecast, by Country 2020 & 2033
- Table 56: Global Viscosity Reducing Agents Market Volume K Tons Forecast, by Country 2020 & 2033
- Table 57: Brazil Viscosity Reducing Agents Market Revenue (Million) Forecast, by Application 2020 & 2033
- Table 58: Brazil Viscosity Reducing Agents Market Volume (K Tons) Forecast, by Application 2020 & 2033
- Table 59: Argentina Viscosity Reducing Agents Market Revenue (Million) Forecast, by Application 2020 & 2033
- Table 60: Argentina Viscosity Reducing Agents Market Volume (K Tons) Forecast, by Application 2020 & 2033
- Table 61: Rest of South America Viscosity Reducing Agents Market Revenue (Million) Forecast, by Application 2020 & 2033
- Table 62: Rest of South America Viscosity Reducing Agents Market Volume (K Tons) Forecast, by Application 2020 & 2033
- Table 63: Global Viscosity Reducing Agents Market Revenue Million Forecast, by Type 2020 & 2033
- Table 64: Global Viscosity Reducing Agents Market Volume K Tons Forecast, by Type 2020 & 2033
- Table 65: Global Viscosity Reducing Agents Market Revenue Million Forecast, by End-user Industry 2020 & 2033
- Table 66: Global Viscosity Reducing Agents Market Volume K Tons Forecast, by End-user Industry 2020 & 2033
- Table 67: Global Viscosity Reducing Agents Market Revenue Million Forecast, by Country 2020 & 2033
- Table 68: Global Viscosity Reducing Agents Market Volume K Tons Forecast, by Country 2020 & 2033
- Table 69: Saudi Arabia Viscosity Reducing Agents Market Revenue (Million) Forecast, by Application 2020 & 2033
- Table 70: Saudi Arabia Viscosity Reducing Agents Market Volume (K Tons) Forecast, by Application 2020 & 2033
- Table 71: South Africa Viscosity Reducing Agents Market Revenue (Million) Forecast, by Application 2020 & 2033
- Table 72: South Africa Viscosity Reducing Agents Market Volume (K Tons) Forecast, by Application 2020 & 2033
- Table 73: Rest of Middle East and Africa Viscosity Reducing Agents Market Revenue (Million) Forecast, by Application 2020 & 2033
- Table 74: Rest of Middle East and Africa Viscosity Reducing Agents Market Volume (K Tons) Forecast, by Application 2020 & 2033
Frequently Asked Questions
1. What is the projected Compound Annual Growth Rate (CAGR) of the Viscosity Reducing Agents Market?
The projected CAGR is approximately 5.68%.
2. Which companies are prominent players in the Viscosity Reducing Agents Market?
Key companies in the market include LiquidPower Specialty Products Inc, Ecolab, BYK-CHEMIE GMBH, ARKEMA Group, BASF SE, Alberta Treating Chemicals LTD, Qflo, The Lubrizol Corporation, Oil Flux, Baker Hughes Company, NuGenTecx, CHINAFLOC, Innospec.
3. What are the main segments of the Viscosity Reducing Agents Market?
The market segments include Type, End-user Industry.
4. Can you provide details about the market size?
The market size is estimated to be USD 168.13 Million as of 2022.
5. What are some drivers contributing to market growth?
; Growing Demand From the Oil & Gas Industry; Other Drivers.
6. What are the notable trends driving market growth?
Growing Demand from the Oil & Gas Industry.
7. Are there any restraints impacting market growth?
; Stringent Environmental Regulations; Unfavourable Conditions Arising Due to the COVID-19 Outbreak.
8. Can you provide examples of recent developments in the market?
N/A
9. What pricing options are available for accessing the report?
Pricing options include single-user, multi-user, and enterprise licenses priced at USD 3,950, USD 4,950, and USD 6,950 respectively.
10. Is the market size provided in terms of value or volume?
The market size is provided in terms of value, measured in Million and volume, measured in K Tons.
11. Are there any specific market keywords associated with the report?
Yes, the market keyword associated with the report is "Viscosity Reducing Agents Market," which aids in identifying and referencing the specific market segment covered.
12. How do I determine which pricing option suits my needs best?
The pricing options vary based on user requirements and access needs. Individual users may opt for single-user licenses, while businesses requiring broader access may choose multi-user or enterprise licenses for cost-effective access to the report.
13. Are there any additional resources or data provided in the Viscosity Reducing Agents Market report?
While the report offers comprehensive insights, it's advisable to review the specific contents or supplementary materials provided to ascertain if additional resources or data are available.
14. How can I stay updated on further developments or reports in the Viscosity Reducing Agents Market?
To stay informed about further developments, trends, and reports in the Viscosity Reducing Agents Market, consider subscribing to industry newsletters, following relevant companies and organizations, or regularly checking reputable industry news sources and publications.
Methodology
Step 1 - Identification of Relevant Samples Size from Population Database


Step 2 - Approaches for Defining Global Market Size (Value, Volume* & Price*)

Note*: In applicable scenarios
Step 3 - Data Sources
Primary Research
- Web Analytics
- Survey Reports
- Research Institute
- Latest Research Reports
- Opinion Leaders
Secondary Research
- Annual Reports
- White Paper
- Latest Press Release
- Industry Association
- Paid Database
- Investor Presentations

Step 4 - Data Triangulation
Involves using different sources of information in order to increase the validity of a study
These sources are likely to be stakeholders in a program - participants, other researchers, program staff, other community members, and so on.
Then we put all data in single framework & apply various statistical tools to find out the dynamic on the market.
During the analysis stage, feedback from the stakeholder groups would be compared to determine areas of agreement as well as areas of divergence