

Key Insights
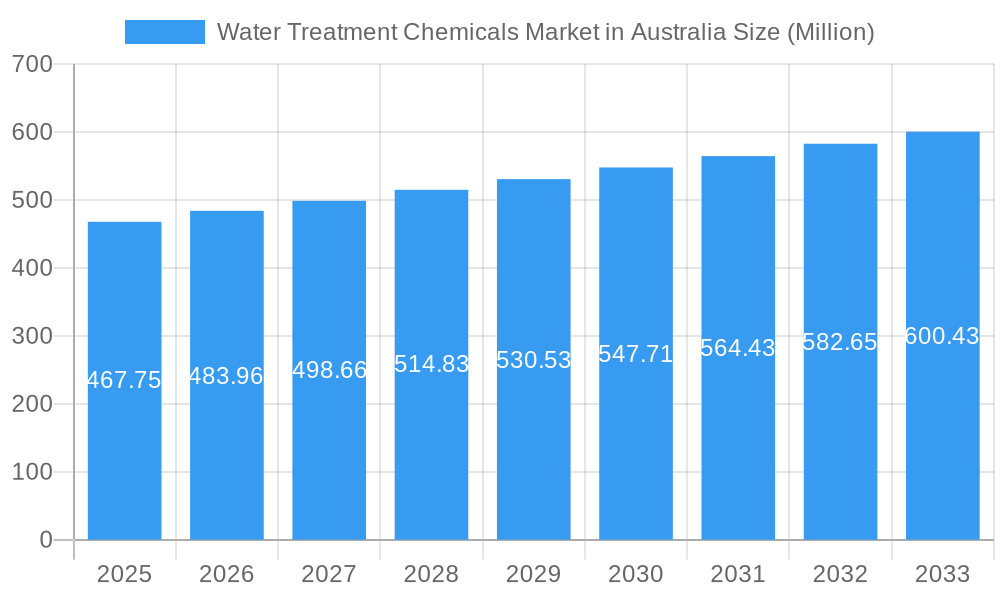
The Australian water treatment chemicals market, valued at $467.75 million in 2025, is projected to experience steady growth, driven by increasing urbanization, stricter environmental regulations, and the expanding industrial sector. A Compound Annual Growth Rate (CAGR) of 3.17% from 2025 to 2033 indicates a consistent market expansion, fueled primarily by the robust demand from power generation, mining, and municipal water treatment facilities. The market is segmented by various chemical types, including biocides, coagulants, corrosion inhibitors, and pH adjusters, each catering to specific water treatment needs. Key players like Kemira Oyj, Ecolab, and SNF dominate the market, leveraging their established presence and technological advancements. Growth within the segments will likely be influenced by factors such as the adoption of advanced water treatment technologies, the increasing focus on water reuse and recycling initiatives, and the ongoing investments in infrastructure development across various sectors. Furthermore, the ongoing exploration and production in the Oil and Gas sector is predicted to further fuel the demand for corrosion and scale inhibitors, specifically in the Western Australia region. The increasing stringent regulations around water discharge and wastewater treatment are expected to further incentivize the adoption of advanced water treatment solutions and associated chemicals.
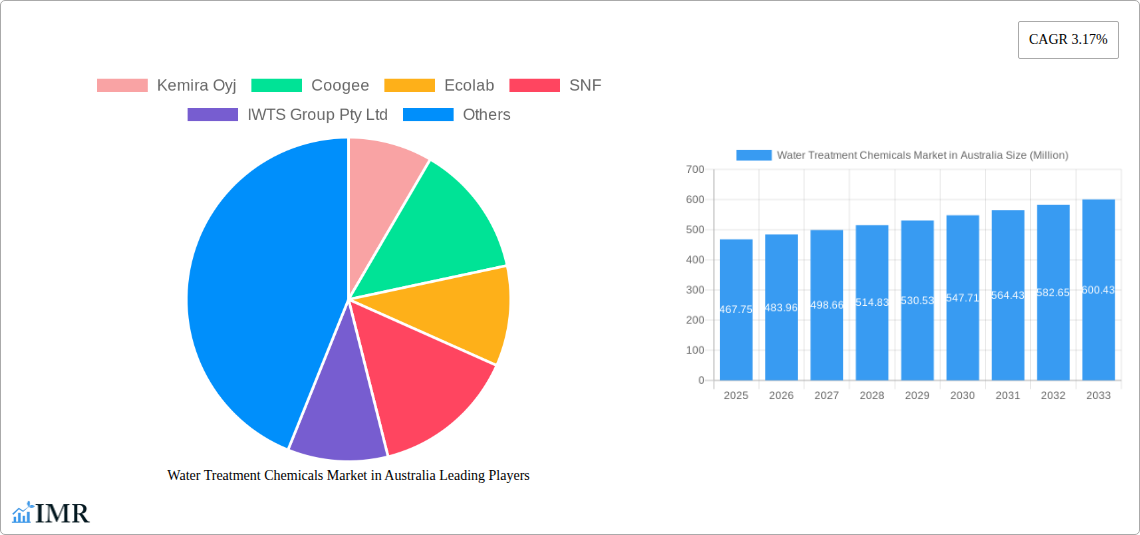
Water Treatment Chemicals Market in Australia Market Size (In Million)
The consistent growth forecast is tempered by potential restraints, such as fluctuations in raw material prices and the economic climate. However, the long-term outlook remains positive, driven by the essential nature of water treatment and the increasing emphasis on sustainable water management practices. The ongoing development and implementation of more efficient and environmentally friendly water treatment chemicals are also likely to shape the market dynamics over the forecast period. Future growth will likely be influenced by factors such as technological innovation, government policies promoting water conservation and responsible water management, and the increasing awareness regarding water scarcity issues.
Water Treatment Chemicals Market in Australia Company Market Share
Water Treatment Chemicals Market in Australia: A Comprehensive Report (2019-2033)
This comprehensive report provides an in-depth analysis of the Australian water treatment chemicals market, encompassing market dynamics, growth trends, key players, and future prospects. The report covers the period 2019-2033, with a focus on the base year 2025 and a forecast period of 2025-2033. This analysis delves into the parent market of Chemical Manufacturing and the child market of Water Treatment Chemicals, offering valuable insights for industry professionals, investors, and strategic decision-makers. The market size is valued in Million Australian Dollars (AUD).
Water Treatment Chemicals Market in Australia Market Dynamics & Structure
This section analyzes the Australian water treatment chemicals market structure, examining market concentration, technological innovations, regulatory influences, and competitive dynamics. The market is characterized by a mix of multinational corporations and local players, resulting in a moderately consolidated landscape. The xx% market share held by the top five players indicates significant competition.
- Market Concentration: Moderately consolidated, with the top five players holding approximately xx% of the market share in 2024.
- Technological Innovation: Driven by stricter environmental regulations and the need for efficient and sustainable water treatment solutions. Innovation focuses on developing environmentally friendly and cost-effective chemicals. Barriers to innovation include high R&D costs and stringent regulatory approvals.
- Regulatory Framework: Stringent environmental regulations and water quality standards imposed by federal and state governments significantly influence market dynamics. Compliance with these regulations is a key factor for market participants.
- Competitive Product Substitutes: Limited direct substitutes exist; however, advancements in alternative water treatment technologies (e.g., membrane filtration) pose indirect competition.
- End-User Demographics: The market is driven by diverse end-user industries, including municipal water treatment plants, power generation, mining, and food and beverage processing. Growth is influenced by industrial expansion, urbanization, and increasing awareness of water conservation.
- M&A Trends: Moderate M&A activity observed in the recent past, driven by the consolidation of market share and access to advanced technologies. xx M&A deals were recorded between 2019 and 2024.
Water Treatment Chemicals Market in Australia Growth Trends & Insights
The Australian water treatment chemicals market has witnessed steady growth during the historical period (2019-2024), driven by factors such as increasing industrialization, urbanization, and stringent environmental regulations. The market is projected to maintain a healthy Compound Annual Growth Rate (CAGR) of xx% during the forecast period (2025-2033), reaching a market value of xx Million AUD by 2033. Market penetration is currently at xx% and is expected to increase to xx% by 2033. Technological advancements, such as the introduction of more efficient and sustainable chemicals, are further driving market growth. Changes in consumer behavior, reflecting increased awareness of water conservation and environmental sustainability, are also positively impacting market demand. Adoption rates for advanced water treatment technologies are on the rise, leading to higher demand for specialized chemicals.
Dominant Regions, Countries, or Segments in Water Treatment Chemicals Market in Australia
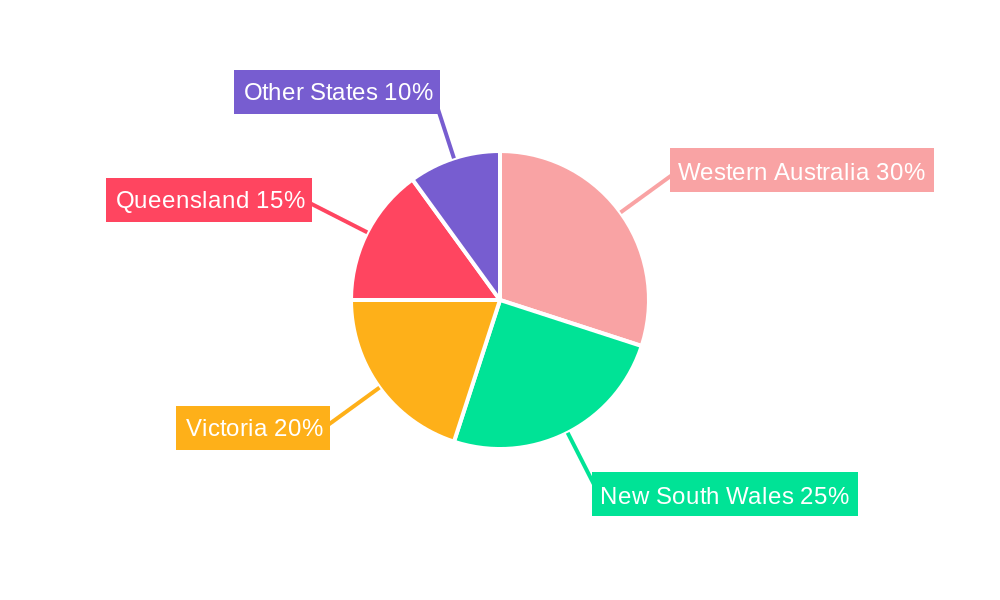
The Australian water treatment chemicals market is geographically dispersed, with significant activity across various states and territories. However, states with higher industrial activity and population density, such as New South Wales and Victoria, exhibit larger market sizes. The Municipal segment holds the largest market share due to the substantial investment in upgrading water infrastructure and improving water quality.
- Leading Segment (Product Type): Coagulants and Flocculants, driven by their wide application in various water treatment processes.
- Leading Segment (End-user Industry): Municipal, due to the large-scale water treatment operations required to serve urban populations.
- Key Drivers:
- Increasing urbanization and industrialization leading to higher water demand.
- Stringent environmental regulations and water quality standards.
- Government investments in water infrastructure development.
- Growing awareness of water conservation and sustainability.
Water Treatment Chemicals Market in Australia Product Landscape
The Australian water treatment chemicals market is characterized by a comprehensive and evolving product landscape, catering to a wide spectrum of purification and management needs. Key product categories include coagulants and flocculants, pH adjusters, disinfectants and biocides, scale and corrosion inhibitors, and specialty chemicals. Recent market advancements highlight a significant shift towards the development and adoption of environmentally sustainable formulations. This includes an increased emphasis on biodegradable chemicals, low-toxicity alternatives, and products that minimize the generation of hazardous byproducts. Furthermore, there's a growing demand for high-efficiency chemicals that deliver superior performance with reduced dosage, thereby lowering operational expenditures for end-users. Technological innovations are at the forefront, with advancements in advanced polymer chemistries significantly enhancing the efficacy of coagulation and flocculation processes. Simultaneously, the development of innovative biocides with highly targeted antimicrobial activity is gaining traction, offering more effective and controlled pathogen management while minimizing environmental impact.
Key Drivers, Barriers & Challenges in Water Treatment Chemicals Market in Australia
Key Drivers:
- Stringent Environmental Regulations: The Australian government's unwavering commitment to environmental protection, particularly concerning water quality and discharge standards, acts as a primary catalyst for the demand for advanced and compliant water treatment chemicals.
- Industrial Expansion and Urbanization: Continued growth in key industrial sectors such as mining, manufacturing, and agriculture, coupled with rapid urbanization, significantly elevates the demand for effective water and wastewater treatment solutions.
- Growing Water Scarcity and Conservation Efforts: Australia's inherent vulnerability to drought and its proactive approach to water resource management are driving increased investment in water recycling, reuse, and efficient treatment technologies, thereby boosting the market for specialized chemicals.
- Technological Advancements and Innovation: The continuous development of new, more efficient, and environmentally benign chemical solutions, along with the integration of smart technologies for optimized chemical application, fuels market growth.
Challenges and Restraints:
- Raw Material Price Volatility: Fluctuations in the global prices of key raw materials used in the production of water treatment chemicals can significantly impact manufacturing costs and, consequently, the profitability of market players.
- Stringent Regulatory Approvals and Compliance: Obtaining regulatory approval for new chemical formulations can be a lengthy and complex process, posing a barrier to entry and market penetration for innovative products.
- Intense Market Competition: The Australian market faces robust competition from established domestic and international suppliers. This competitive pressure often leads to price sensitivity and can impact profit margins, necessitating a focus on value-added solutions.
- Geographic Dispersion and Logistics: The vastness of Australia presents logistical challenges for chemical supply chains, potentially increasing transportation costs and delivery times for certain regions.
Emerging Opportunities in Water Treatment Chemicals Market in Australia
- Growing demand for sustainable and eco-friendly water treatment solutions.
- Increasing adoption of advanced water treatment technologies.
- Opportunities in emerging industrial sectors, such as renewable energy.
Growth Accelerators in the Water Treatment Chemicals Market in Australia Industry
Long-term growth will be fueled by technological advancements in chemical formulations, strategic partnerships between chemical manufacturers and water treatment companies, and expansion into new market segments such as desalination and wastewater reuse. Government initiatives promoting water conservation and infrastructure development will further accelerate market growth.
Key Players Shaping the Water Treatment Chemicals Market in Australia Market
- Kemira Oyj
- Coogee Chemicals
- Ecolab Inc.
- SNF
- IWTS Group Pty Ltd
- Solvay S.A.
- Buckman Laboratories
- Aquasol Pty Ltd
- Dow Chemical Company
- Solenis LLC
- Ixom Pty Ltd
- Albemarle Corporation
- Veolia (Veolia Water Technologies)
Notable Milestones in Water Treatment Chemicals Market in Australia Sector
- June 2022: Kemira Oyj and Veolia collaborated to introduce the innovative ViviMag technology, designed for efficient phosphorus recovery from sewage sludge, aligning with circular economy principles.
- April 2022: Veolia Group forged a strategic partnership with Sydney Water to explore and implement circular economy initiatives aimed at enhancing the sustainability and efficiency of water services.
- Ongoing: Increased investment by key players in research and development focused on bio-based and advanced chemical solutions to meet evolving environmental standards and customer demands.
In-Depth Water Treatment Chemicals Market in Australia Market Outlook
The Australian water treatment chemicals market is projected for robust and sustained expansion, propelled by a strategic interplay of escalating water scarcity concerns, progressively stringent environmental regulations, and the accelerating adoption of sophisticated water treatment technologies across various sectors. The market's trajectory will be significantly shaped by an intensified focus on sustainability and eco-friendly solutions, with a burgeoning demand for chemicals that offer reduced environmental footprints and enhanced biodegradability. Strategic alliances, mergers, and acquisitions are anticipated to play a pivotal role in market consolidation and expansion, enabling companies to leverage synergistic capabilities and broaden their product portfolios. Furthermore, substantial investments in research and development will be paramount for market participants to maintain a competitive advantage, innovate novel chemical formulations, and address the specific water quality challenges prevalent in Australia. The ongoing digital transformation within the water industry will also influence the market, leading to greater demand for intelligent chemical management systems and data-driven treatment solutions.
Water Treatment Chemicals Market in Australia Segmentation
-
1. Product Type
- 1.1. Biocides and Disinfectants
- 1.2. Coagulants and Flocculants
- 1.3. Corrosion and Scale Inhibitors
- 1.4. Defoamers and Defoaming Agents
- 1.5. pH Conditioners/Adjusters
- 1.6. Other Product Types
-
2. End-user Industry
- 2.1. Power Generation
- 2.2. Oil and Gas
- 2.3. Chemical Manufacturing
- 2.4. Mining and Mineral Processing
- 2.5. Municipal
- 2.6. Food and Beverage
- 2.7. Pulp and Paper
- 2.8. Other End-user Industries
Water Treatment Chemicals Market in Australia Segmentation By Geography
-
1. North America
- 1.1. United States
- 1.2. Canada
- 1.3. Mexico
-
2. South America
- 2.1. Brazil
- 2.2. Argentina
- 2.3. Rest of South America
-
3. Europe
- 3.1. United Kingdom
- 3.2. Germany
- 3.3. France
- 3.4. Italy
- 3.5. Spain
- 3.6. Russia
- 3.7. Benelux
- 3.8. Nordics
- 3.9. Rest of Europe
-
4. Middle East & Africa
- 4.1. Turkey
- 4.2. Israel
- 4.3. GCC
- 4.4. North Africa
- 4.5. South Africa
- 4.6. Rest of Middle East & Africa
-
5. Asia Pacific
- 5.1. China
- 5.2. India
- 5.3. Japan
- 5.4. South Korea
- 5.5. ASEAN
- 5.6. Oceania
- 5.7. Rest of Asia Pacific
Water Treatment Chemicals Market in Australia Regional Market Share
Geographic Coverage of Water Treatment Chemicals Market in Australia
Water Treatment Chemicals Market in Australia REPORT HIGHLIGHTS
| Aspects | Details |
|---|---|
| Study Period | 2020-2034 |
| Base Year | 2025 |
| Estimated Year | 2026 |
| Forecast Period | 2026-2034 |
| Historical Period | 2020-2025 |
| Growth Rate | CAGR of 3.17% from 2020-2034 |
| Segmentation |
|
Table of Contents
- 1. Introduction
- 1.1. Research Scope
- 1.2. Market Segmentation
- 1.3. Research Objective
- 1.4. Definitions and Assumptions
- 2. Executive Summary
- 2.1. Market Snapshot
- 3. Market Dynamics
- 3.1. Market Drivers
- 3.2. Market Restrains
- 3.3. Market Trends
- 3.4. Market Opportunities
- 4. Market Factor Analysis
- 4.1. Porters Five Forces
- 4.1.1. Bargaining Power of Suppliers
- 4.1.2. Bargaining Power of Buyers
- 4.1.3. Threat of New Entrants
- 4.1.4. Threat of Substitutes
- 4.1.5. Competitive Rivalry
- 4.2. PESTEL analysis
- 4.3. BCG Analysis
- 4.3.1. Stars (High Growth, High Market Share)
- 4.3.2. Cash Cows (Low Growth, High Market Share)
- 4.3.3. Question Mark (High Growth, Low Market Share)
- 4.3.4. Dogs (Low Growth, Low Market Share)
- 4.4. Ansoff Matrix Analysis
- 4.5. Supply Chain Analysis
- 4.6. Regulatory Landscape
- 4.7. Current Market Potential and Opportunity Assessment (TAM–SAM–SOM Framework)
- 4.8. IMR Analyst Note
- 4.1. Porters Five Forces
- 5. Market Analysis, Insights and Forecast 2021-2033
- 5.1. Market Analysis, Insights and Forecast - by Product Type
- 5.1.1. Biocides and Disinfectants
- 5.1.2. Coagulants and Flocculants
- 5.1.3. Corrosion and Scale Inhibitors
- 5.1.4. Defoamers and Defoaming Agents
- 5.1.5. pH Conditioners/Adjusters
- 5.1.6. Other Product Types
- 5.2. Market Analysis, Insights and Forecast - by End-user Industry
- 5.2.1. Power Generation
- 5.2.2. Oil and Gas
- 5.2.3. Chemical Manufacturing
- 5.2.4. Mining and Mineral Processing
- 5.2.5. Municipal
- 5.2.6. Food and Beverage
- 5.2.7. Pulp and Paper
- 5.2.8. Other End-user Industries
- 5.3. Market Analysis, Insights and Forecast - by Region
- 5.3.1. North America
- 5.3.2. South America
- 5.3.3. Europe
- 5.3.4. Middle East & Africa
- 5.3.5. Asia Pacific
- 5.1. Market Analysis, Insights and Forecast - by Product Type
- 6. Global Water Treatment Chemicals Market in Australia Analysis, Insights and Forecast, 2021-2033
- 6.1. Market Analysis, Insights and Forecast - by Product Type
- 6.1.1. Biocides and Disinfectants
- 6.1.2. Coagulants and Flocculants
- 6.1.3. Corrosion and Scale Inhibitors
- 6.1.4. Defoamers and Defoaming Agents
- 6.1.5. pH Conditioners/Adjusters
- 6.1.6. Other Product Types
- 6.2. Market Analysis, Insights and Forecast - by End-user Industry
- 6.2.1. Power Generation
- 6.2.2. Oil and Gas
- 6.2.3. Chemical Manufacturing
- 6.2.4. Mining and Mineral Processing
- 6.2.5. Municipal
- 6.2.6. Food and Beverage
- 6.2.7. Pulp and Paper
- 6.2.8. Other End-user Industries
- 6.1. Market Analysis, Insights and Forecast - by Product Type
- 7. North America Water Treatment Chemicals Market in Australia Analysis, Insights and Forecast, 2020-2032
- 7.1. Market Analysis, Insights and Forecast - by Product Type
- 7.1.1. Biocides and Disinfectants
- 7.1.2. Coagulants and Flocculants
- 7.1.3. Corrosion and Scale Inhibitors
- 7.1.4. Defoamers and Defoaming Agents
- 7.1.5. pH Conditioners/Adjusters
- 7.1.6. Other Product Types
- 7.2. Market Analysis, Insights and Forecast - by End-user Industry
- 7.2.1. Power Generation
- 7.2.2. Oil and Gas
- 7.2.3. Chemical Manufacturing
- 7.2.4. Mining and Mineral Processing
- 7.2.5. Municipal
- 7.2.6. Food and Beverage
- 7.2.7. Pulp and Paper
- 7.2.8. Other End-user Industries
- 7.1. Market Analysis, Insights and Forecast - by Product Type
- 8. South America Water Treatment Chemicals Market in Australia Analysis, Insights and Forecast, 2020-2032
- 8.1. Market Analysis, Insights and Forecast - by Product Type
- 8.1.1. Biocides and Disinfectants
- 8.1.2. Coagulants and Flocculants
- 8.1.3. Corrosion and Scale Inhibitors
- 8.1.4. Defoamers and Defoaming Agents
- 8.1.5. pH Conditioners/Adjusters
- 8.1.6. Other Product Types
- 8.2. Market Analysis, Insights and Forecast - by End-user Industry
- 8.2.1. Power Generation
- 8.2.2. Oil and Gas
- 8.2.3. Chemical Manufacturing
- 8.2.4. Mining and Mineral Processing
- 8.2.5. Municipal
- 8.2.6. Food and Beverage
- 8.2.7. Pulp and Paper
- 8.2.8. Other End-user Industries
- 8.1. Market Analysis, Insights and Forecast - by Product Type
- 9. Europe Water Treatment Chemicals Market in Australia Analysis, Insights and Forecast, 2020-2032
- 9.1. Market Analysis, Insights and Forecast - by Product Type
- 9.1.1. Biocides and Disinfectants
- 9.1.2. Coagulants and Flocculants
- 9.1.3. Corrosion and Scale Inhibitors
- 9.1.4. Defoamers and Defoaming Agents
- 9.1.5. pH Conditioners/Adjusters
- 9.1.6. Other Product Types
- 9.2. Market Analysis, Insights and Forecast - by End-user Industry
- 9.2.1. Power Generation
- 9.2.2. Oil and Gas
- 9.2.3. Chemical Manufacturing
- 9.2.4. Mining and Mineral Processing
- 9.2.5. Municipal
- 9.2.6. Food and Beverage
- 9.2.7. Pulp and Paper
- 9.2.8. Other End-user Industries
- 9.1. Market Analysis, Insights and Forecast - by Product Type
- 10. Middle East & Africa Water Treatment Chemicals Market in Australia Analysis, Insights and Forecast, 2020-2032
- 10.1. Market Analysis, Insights and Forecast - by Product Type
- 10.1.1. Biocides and Disinfectants
- 10.1.2. Coagulants and Flocculants
- 10.1.3. Corrosion and Scale Inhibitors
- 10.1.4. Defoamers and Defoaming Agents
- 10.1.5. pH Conditioners/Adjusters
- 10.1.6. Other Product Types
- 10.2. Market Analysis, Insights and Forecast - by End-user Industry
- 10.2.1. Power Generation
- 10.2.2. Oil and Gas
- 10.2.3. Chemical Manufacturing
- 10.2.4. Mining and Mineral Processing
- 10.2.5. Municipal
- 10.2.6. Food and Beverage
- 10.2.7. Pulp and Paper
- 10.2.8. Other End-user Industries
- 10.1. Market Analysis, Insights and Forecast - by Product Type
- 11. Asia Pacific Water Treatment Chemicals Market in Australia Analysis, Insights and Forecast, 2020-2032
- 11.1. Market Analysis, Insights and Forecast - by Product Type
- 11.1.1. Biocides and Disinfectants
- 11.1.2. Coagulants and Flocculants
- 11.1.3. Corrosion and Scale Inhibitors
- 11.1.4. Defoamers and Defoaming Agents
- 11.1.5. pH Conditioners/Adjusters
- 11.1.6. Other Product Types
- 11.2. Market Analysis, Insights and Forecast - by End-user Industry
- 11.2.1. Power Generation
- 11.2.2. Oil and Gas
- 11.2.3. Chemical Manufacturing
- 11.2.4. Mining and Mineral Processing
- 11.2.5. Municipal
- 11.2.6. Food and Beverage
- 11.2.7. Pulp and Paper
- 11.2.8. Other End-user Industries
- 11.1. Market Analysis, Insights and Forecast - by Product Type
- 12. Competitive Analysis
- 12.1. Company Profiles
- 12.1.1 Kemira Oyj
- 12.1.1.1. Company Overview
- 12.1.1.2. Products
- 12.1.1.3. Company Financials
- 12.1.1.4. SWOT Analysis
- 12.1.2 Coogee
- 12.1.2.1. Company Overview
- 12.1.2.2. Products
- 12.1.2.3. Company Financials
- 12.1.2.4. SWOT Analysis
- 12.1.3 Ecolab
- 12.1.3.1. Company Overview
- 12.1.3.2. Products
- 12.1.3.3. Company Financials
- 12.1.3.4. SWOT Analysis
- 12.1.4 SNF
- 12.1.4.1. Company Overview
- 12.1.4.2. Products
- 12.1.4.3. Company Financials
- 12.1.4.4. SWOT Analysis
- 12.1.5 IWTS Group Pty Ltd
- 12.1.5.1. Company Overview
- 12.1.5.2. Products
- 12.1.5.3. Company Financials
- 12.1.5.4. SWOT Analysis
- 12.1.6 Solvay
- 12.1.6.1. Company Overview
- 12.1.6.2. Products
- 12.1.6.3. Company Financials
- 12.1.6.4. SWOT Analysis
- 12.1.7 Buckman
- 12.1.7.1. Company Overview
- 12.1.7.2. Products
- 12.1.7.3. Company Financials
- 12.1.7.4. SWOT Analysis
- 12.1.8 Aquasol
- 12.1.8.1. Company Overview
- 12.1.8.2. Products
- 12.1.8.3. Company Financials
- 12.1.8.4. SWOT Analysis
- 12.1.9 Dow
- 12.1.9.1. Company Overview
- 12.1.9.2. Products
- 12.1.9.3. Company Financials
- 12.1.9.4. SWOT Analysis
- 12.1.10 Solenis
- 12.1.10.1. Company Overview
- 12.1.10.2. Products
- 12.1.10.3. Company Financials
- 12.1.10.4. SWOT Analysis
- 12.1.11 Ixom
- 12.1.11.1. Company Overview
- 12.1.11.2. Products
- 12.1.11.3. Company Financials
- 12.1.11.4. SWOT Analysis
- 12.1.12 Albemarle Corporation
- 12.1.12.1. Company Overview
- 12.1.12.2. Products
- 12.1.12.3. Company Financials
- 12.1.12.4. SWOT Analysis
- 12.1.13 Veolia (Veolia Water Technologies)
- 12.1.13.1. Company Overview
- 12.1.13.2. Products
- 12.1.13.3. Company Financials
- 12.1.13.4. SWOT Analysis
- 12.1.1 Kemira Oyj
- 12.2. Market Entropy
- 12.2.1 Company's Key Areas Served
- 12.2.2 Recent Developments
- 12.3. Company Market Share Analysis 2025
- 12.3.1 Top 5 Companies Market Share Analysis
- 12.3.2 Top 3 Companies Market Share Analysis
- 12.4. List of Potential Customers
- 13. Research Methodology
List of Figures
- Figure 1: Global Water Treatment Chemicals Market in Australia Revenue Breakdown (Million, %) by Region 2025 & 2033
- Figure 2: Global Water Treatment Chemicals Market in Australia Volume Breakdown (K Tons, %) by Region 2025 & 2033
- Figure 3: North America Water Treatment Chemicals Market in Australia Revenue (Million), by Product Type 2025 & 2033
- Figure 4: North America Water Treatment Chemicals Market in Australia Volume (K Tons), by Product Type 2025 & 2033
- Figure 5: North America Water Treatment Chemicals Market in Australia Revenue Share (%), by Product Type 2025 & 2033
- Figure 6: North America Water Treatment Chemicals Market in Australia Volume Share (%), by Product Type 2025 & 2033
- Figure 7: North America Water Treatment Chemicals Market in Australia Revenue (Million), by End-user Industry 2025 & 2033
- Figure 8: North America Water Treatment Chemicals Market in Australia Volume (K Tons), by End-user Industry 2025 & 2033
- Figure 9: North America Water Treatment Chemicals Market in Australia Revenue Share (%), by End-user Industry 2025 & 2033
- Figure 10: North America Water Treatment Chemicals Market in Australia Volume Share (%), by End-user Industry 2025 & 2033
- Figure 11: North America Water Treatment Chemicals Market in Australia Revenue (Million), by Country 2025 & 2033
- Figure 12: North America Water Treatment Chemicals Market in Australia Volume (K Tons), by Country 2025 & 2033
- Figure 13: North America Water Treatment Chemicals Market in Australia Revenue Share (%), by Country 2025 & 2033
- Figure 14: North America Water Treatment Chemicals Market in Australia Volume Share (%), by Country 2025 & 2033
- Figure 15: South America Water Treatment Chemicals Market in Australia Revenue (Million), by Product Type 2025 & 2033
- Figure 16: South America Water Treatment Chemicals Market in Australia Volume (K Tons), by Product Type 2025 & 2033
- Figure 17: South America Water Treatment Chemicals Market in Australia Revenue Share (%), by Product Type 2025 & 2033
- Figure 18: South America Water Treatment Chemicals Market in Australia Volume Share (%), by Product Type 2025 & 2033
- Figure 19: South America Water Treatment Chemicals Market in Australia Revenue (Million), by End-user Industry 2025 & 2033
- Figure 20: South America Water Treatment Chemicals Market in Australia Volume (K Tons), by End-user Industry 2025 & 2033
- Figure 21: South America Water Treatment Chemicals Market in Australia Revenue Share (%), by End-user Industry 2025 & 2033
- Figure 22: South America Water Treatment Chemicals Market in Australia Volume Share (%), by End-user Industry 2025 & 2033
- Figure 23: South America Water Treatment Chemicals Market in Australia Revenue (Million), by Country 2025 & 2033
- Figure 24: South America Water Treatment Chemicals Market in Australia Volume (K Tons), by Country 2025 & 2033
- Figure 25: South America Water Treatment Chemicals Market in Australia Revenue Share (%), by Country 2025 & 2033
- Figure 26: South America Water Treatment Chemicals Market in Australia Volume Share (%), by Country 2025 & 2033
- Figure 27: Europe Water Treatment Chemicals Market in Australia Revenue (Million), by Product Type 2025 & 2033
- Figure 28: Europe Water Treatment Chemicals Market in Australia Volume (K Tons), by Product Type 2025 & 2033
- Figure 29: Europe Water Treatment Chemicals Market in Australia Revenue Share (%), by Product Type 2025 & 2033
- Figure 30: Europe Water Treatment Chemicals Market in Australia Volume Share (%), by Product Type 2025 & 2033
- Figure 31: Europe Water Treatment Chemicals Market in Australia Revenue (Million), by End-user Industry 2025 & 2033
- Figure 32: Europe Water Treatment Chemicals Market in Australia Volume (K Tons), by End-user Industry 2025 & 2033
- Figure 33: Europe Water Treatment Chemicals Market in Australia Revenue Share (%), by End-user Industry 2025 & 2033
- Figure 34: Europe Water Treatment Chemicals Market in Australia Volume Share (%), by End-user Industry 2025 & 2033
- Figure 35: Europe Water Treatment Chemicals Market in Australia Revenue (Million), by Country 2025 & 2033
- Figure 36: Europe Water Treatment Chemicals Market in Australia Volume (K Tons), by Country 2025 & 2033
- Figure 37: Europe Water Treatment Chemicals Market in Australia Revenue Share (%), by Country 2025 & 2033
- Figure 38: Europe Water Treatment Chemicals Market in Australia Volume Share (%), by Country 2025 & 2033
- Figure 39: Middle East & Africa Water Treatment Chemicals Market in Australia Revenue (Million), by Product Type 2025 & 2033
- Figure 40: Middle East & Africa Water Treatment Chemicals Market in Australia Volume (K Tons), by Product Type 2025 & 2033
- Figure 41: Middle East & Africa Water Treatment Chemicals Market in Australia Revenue Share (%), by Product Type 2025 & 2033
- Figure 42: Middle East & Africa Water Treatment Chemicals Market in Australia Volume Share (%), by Product Type 2025 & 2033
- Figure 43: Middle East & Africa Water Treatment Chemicals Market in Australia Revenue (Million), by End-user Industry 2025 & 2033
- Figure 44: Middle East & Africa Water Treatment Chemicals Market in Australia Volume (K Tons), by End-user Industry 2025 & 2033
- Figure 45: Middle East & Africa Water Treatment Chemicals Market in Australia Revenue Share (%), by End-user Industry 2025 & 2033
- Figure 46: Middle East & Africa Water Treatment Chemicals Market in Australia Volume Share (%), by End-user Industry 2025 & 2033
- Figure 47: Middle East & Africa Water Treatment Chemicals Market in Australia Revenue (Million), by Country 2025 & 2033
- Figure 48: Middle East & Africa Water Treatment Chemicals Market in Australia Volume (K Tons), by Country 2025 & 2033
- Figure 49: Middle East & Africa Water Treatment Chemicals Market in Australia Revenue Share (%), by Country 2025 & 2033
- Figure 50: Middle East & Africa Water Treatment Chemicals Market in Australia Volume Share (%), by Country 2025 & 2033
- Figure 51: Asia Pacific Water Treatment Chemicals Market in Australia Revenue (Million), by Product Type 2025 & 2033
- Figure 52: Asia Pacific Water Treatment Chemicals Market in Australia Volume (K Tons), by Product Type 2025 & 2033
- Figure 53: Asia Pacific Water Treatment Chemicals Market in Australia Revenue Share (%), by Product Type 2025 & 2033
- Figure 54: Asia Pacific Water Treatment Chemicals Market in Australia Volume Share (%), by Product Type 2025 & 2033
- Figure 55: Asia Pacific Water Treatment Chemicals Market in Australia Revenue (Million), by End-user Industry 2025 & 2033
- Figure 56: Asia Pacific Water Treatment Chemicals Market in Australia Volume (K Tons), by End-user Industry 2025 & 2033
- Figure 57: Asia Pacific Water Treatment Chemicals Market in Australia Revenue Share (%), by End-user Industry 2025 & 2033
- Figure 58: Asia Pacific Water Treatment Chemicals Market in Australia Volume Share (%), by End-user Industry 2025 & 2033
- Figure 59: Asia Pacific Water Treatment Chemicals Market in Australia Revenue (Million), by Country 2025 & 2033
- Figure 60: Asia Pacific Water Treatment Chemicals Market in Australia Volume (K Tons), by Country 2025 & 2033
- Figure 61: Asia Pacific Water Treatment Chemicals Market in Australia Revenue Share (%), by Country 2025 & 2033
- Figure 62: Asia Pacific Water Treatment Chemicals Market in Australia Volume Share (%), by Country 2025 & 2033
List of Tables
- Table 1: Global Water Treatment Chemicals Market in Australia Revenue Million Forecast, by Product Type 2020 & 2033
- Table 2: Global Water Treatment Chemicals Market in Australia Volume K Tons Forecast, by Product Type 2020 & 2033
- Table 3: Global Water Treatment Chemicals Market in Australia Revenue Million Forecast, by End-user Industry 2020 & 2033
- Table 4: Global Water Treatment Chemicals Market in Australia Volume K Tons Forecast, by End-user Industry 2020 & 2033
- Table 5: Global Water Treatment Chemicals Market in Australia Revenue Million Forecast, by Region 2020 & 2033
- Table 6: Global Water Treatment Chemicals Market in Australia Volume K Tons Forecast, by Region 2020 & 2033
- Table 7: Global Water Treatment Chemicals Market in Australia Revenue Million Forecast, by Product Type 2020 & 2033
- Table 8: Global Water Treatment Chemicals Market in Australia Volume K Tons Forecast, by Product Type 2020 & 2033
- Table 9: Global Water Treatment Chemicals Market in Australia Revenue Million Forecast, by End-user Industry 2020 & 2033
- Table 10: Global Water Treatment Chemicals Market in Australia Volume K Tons Forecast, by End-user Industry 2020 & 2033
- Table 11: Global Water Treatment Chemicals Market in Australia Revenue Million Forecast, by Country 2020 & 2033
- Table 12: Global Water Treatment Chemicals Market in Australia Volume K Tons Forecast, by Country 2020 & 2033
- Table 13: United States Water Treatment Chemicals Market in Australia Revenue (Million) Forecast, by Application 2020 & 2033
- Table 14: United States Water Treatment Chemicals Market in Australia Volume (K Tons) Forecast, by Application 2020 & 2033
- Table 15: Canada Water Treatment Chemicals Market in Australia Revenue (Million) Forecast, by Application 2020 & 2033
- Table 16: Canada Water Treatment Chemicals Market in Australia Volume (K Tons) Forecast, by Application 2020 & 2033
- Table 17: Mexico Water Treatment Chemicals Market in Australia Revenue (Million) Forecast, by Application 2020 & 2033
- Table 18: Mexico Water Treatment Chemicals Market in Australia Volume (K Tons) Forecast, by Application 2020 & 2033
- Table 19: Global Water Treatment Chemicals Market in Australia Revenue Million Forecast, by Product Type 2020 & 2033
- Table 20: Global Water Treatment Chemicals Market in Australia Volume K Tons Forecast, by Product Type 2020 & 2033
- Table 21: Global Water Treatment Chemicals Market in Australia Revenue Million Forecast, by End-user Industry 2020 & 2033
- Table 22: Global Water Treatment Chemicals Market in Australia Volume K Tons Forecast, by End-user Industry 2020 & 2033
- Table 23: Global Water Treatment Chemicals Market in Australia Revenue Million Forecast, by Country 2020 & 2033
- Table 24: Global Water Treatment Chemicals Market in Australia Volume K Tons Forecast, by Country 2020 & 2033
- Table 25: Brazil Water Treatment Chemicals Market in Australia Revenue (Million) Forecast, by Application 2020 & 2033
- Table 26: Brazil Water Treatment Chemicals Market in Australia Volume (K Tons) Forecast, by Application 2020 & 2033
- Table 27: Argentina Water Treatment Chemicals Market in Australia Revenue (Million) Forecast, by Application 2020 & 2033
- Table 28: Argentina Water Treatment Chemicals Market in Australia Volume (K Tons) Forecast, by Application 2020 & 2033
- Table 29: Rest of South America Water Treatment Chemicals Market in Australia Revenue (Million) Forecast, by Application 2020 & 2033
- Table 30: Rest of South America Water Treatment Chemicals Market in Australia Volume (K Tons) Forecast, by Application 2020 & 2033
- Table 31: Global Water Treatment Chemicals Market in Australia Revenue Million Forecast, by Product Type 2020 & 2033
- Table 32: Global Water Treatment Chemicals Market in Australia Volume K Tons Forecast, by Product Type 2020 & 2033
- Table 33: Global Water Treatment Chemicals Market in Australia Revenue Million Forecast, by End-user Industry 2020 & 2033
- Table 34: Global Water Treatment Chemicals Market in Australia Volume K Tons Forecast, by End-user Industry 2020 & 2033
- Table 35: Global Water Treatment Chemicals Market in Australia Revenue Million Forecast, by Country 2020 & 2033
- Table 36: Global Water Treatment Chemicals Market in Australia Volume K Tons Forecast, by Country 2020 & 2033
- Table 37: United Kingdom Water Treatment Chemicals Market in Australia Revenue (Million) Forecast, by Application 2020 & 2033
- Table 38: United Kingdom Water Treatment Chemicals Market in Australia Volume (K Tons) Forecast, by Application 2020 & 2033
- Table 39: Germany Water Treatment Chemicals Market in Australia Revenue (Million) Forecast, by Application 2020 & 2033
- Table 40: Germany Water Treatment Chemicals Market in Australia Volume (K Tons) Forecast, by Application 2020 & 2033
- Table 41: France Water Treatment Chemicals Market in Australia Revenue (Million) Forecast, by Application 2020 & 2033
- Table 42: France Water Treatment Chemicals Market in Australia Volume (K Tons) Forecast, by Application 2020 & 2033
- Table 43: Italy Water Treatment Chemicals Market in Australia Revenue (Million) Forecast, by Application 2020 & 2033
- Table 44: Italy Water Treatment Chemicals Market in Australia Volume (K Tons) Forecast, by Application 2020 & 2033
- Table 45: Spain Water Treatment Chemicals Market in Australia Revenue (Million) Forecast, by Application 2020 & 2033
- Table 46: Spain Water Treatment Chemicals Market in Australia Volume (K Tons) Forecast, by Application 2020 & 2033
- Table 47: Russia Water Treatment Chemicals Market in Australia Revenue (Million) Forecast, by Application 2020 & 2033
- Table 48: Russia Water Treatment Chemicals Market in Australia Volume (K Tons) Forecast, by Application 2020 & 2033
- Table 49: Benelux Water Treatment Chemicals Market in Australia Revenue (Million) Forecast, by Application 2020 & 2033
- Table 50: Benelux Water Treatment Chemicals Market in Australia Volume (K Tons) Forecast, by Application 2020 & 2033
- Table 51: Nordics Water Treatment Chemicals Market in Australia Revenue (Million) Forecast, by Application 2020 & 2033
- Table 52: Nordics Water Treatment Chemicals Market in Australia Volume (K Tons) Forecast, by Application 2020 & 2033
- Table 53: Rest of Europe Water Treatment Chemicals Market in Australia Revenue (Million) Forecast, by Application 2020 & 2033
- Table 54: Rest of Europe Water Treatment Chemicals Market in Australia Volume (K Tons) Forecast, by Application 2020 & 2033
- Table 55: Global Water Treatment Chemicals Market in Australia Revenue Million Forecast, by Product Type 2020 & 2033
- Table 56: Global Water Treatment Chemicals Market in Australia Volume K Tons Forecast, by Product Type 2020 & 2033
- Table 57: Global Water Treatment Chemicals Market in Australia Revenue Million Forecast, by End-user Industry 2020 & 2033
- Table 58: Global Water Treatment Chemicals Market in Australia Volume K Tons Forecast, by End-user Industry 2020 & 2033
- Table 59: Global Water Treatment Chemicals Market in Australia Revenue Million Forecast, by Country 2020 & 2033
- Table 60: Global Water Treatment Chemicals Market in Australia Volume K Tons Forecast, by Country 2020 & 2033
- Table 61: Turkey Water Treatment Chemicals Market in Australia Revenue (Million) Forecast, by Application 2020 & 2033
- Table 62: Turkey Water Treatment Chemicals Market in Australia Volume (K Tons) Forecast, by Application 2020 & 2033
- Table 63: Israel Water Treatment Chemicals Market in Australia Revenue (Million) Forecast, by Application 2020 & 2033
- Table 64: Israel Water Treatment Chemicals Market in Australia Volume (K Tons) Forecast, by Application 2020 & 2033
- Table 65: GCC Water Treatment Chemicals Market in Australia Revenue (Million) Forecast, by Application 2020 & 2033
- Table 66: GCC Water Treatment Chemicals Market in Australia Volume (K Tons) Forecast, by Application 2020 & 2033
- Table 67: North Africa Water Treatment Chemicals Market in Australia Revenue (Million) Forecast, by Application 2020 & 2033
- Table 68: North Africa Water Treatment Chemicals Market in Australia Volume (K Tons) Forecast, by Application 2020 & 2033
- Table 69: South Africa Water Treatment Chemicals Market in Australia Revenue (Million) Forecast, by Application 2020 & 2033
- Table 70: South Africa Water Treatment Chemicals Market in Australia Volume (K Tons) Forecast, by Application 2020 & 2033
- Table 71: Rest of Middle East & Africa Water Treatment Chemicals Market in Australia Revenue (Million) Forecast, by Application 2020 & 2033
- Table 72: Rest of Middle East & Africa Water Treatment Chemicals Market in Australia Volume (K Tons) Forecast, by Application 2020 & 2033
- Table 73: Global Water Treatment Chemicals Market in Australia Revenue Million Forecast, by Product Type 2020 & 2033
- Table 74: Global Water Treatment Chemicals Market in Australia Volume K Tons Forecast, by Product Type 2020 & 2033
- Table 75: Global Water Treatment Chemicals Market in Australia Revenue Million Forecast, by End-user Industry 2020 & 2033
- Table 76: Global Water Treatment Chemicals Market in Australia Volume K Tons Forecast, by End-user Industry 2020 & 2033
- Table 77: Global Water Treatment Chemicals Market in Australia Revenue Million Forecast, by Country 2020 & 2033
- Table 78: Global Water Treatment Chemicals Market in Australia Volume K Tons Forecast, by Country 2020 & 2033
- Table 79: China Water Treatment Chemicals Market in Australia Revenue (Million) Forecast, by Application 2020 & 2033
- Table 80: China Water Treatment Chemicals Market in Australia Volume (K Tons) Forecast, by Application 2020 & 2033
- Table 81: India Water Treatment Chemicals Market in Australia Revenue (Million) Forecast, by Application 2020 & 2033
- Table 82: India Water Treatment Chemicals Market in Australia Volume (K Tons) Forecast, by Application 2020 & 2033
- Table 83: Japan Water Treatment Chemicals Market in Australia Revenue (Million) Forecast, by Application 2020 & 2033
- Table 84: Japan Water Treatment Chemicals Market in Australia Volume (K Tons) Forecast, by Application 2020 & 2033
- Table 85: South Korea Water Treatment Chemicals Market in Australia Revenue (Million) Forecast, by Application 2020 & 2033
- Table 86: South Korea Water Treatment Chemicals Market in Australia Volume (K Tons) Forecast, by Application 2020 & 2033
- Table 87: ASEAN Water Treatment Chemicals Market in Australia Revenue (Million) Forecast, by Application 2020 & 2033
- Table 88: ASEAN Water Treatment Chemicals Market in Australia Volume (K Tons) Forecast, by Application 2020 & 2033
- Table 89: Oceania Water Treatment Chemicals Market in Australia Revenue (Million) Forecast, by Application 2020 & 2033
- Table 90: Oceania Water Treatment Chemicals Market in Australia Volume (K Tons) Forecast, by Application 2020 & 2033
- Table 91: Rest of Asia Pacific Water Treatment Chemicals Market in Australia Revenue (Million) Forecast, by Application 2020 & 2033
- Table 92: Rest of Asia Pacific Water Treatment Chemicals Market in Australia Volume (K Tons) Forecast, by Application 2020 & 2033
Frequently Asked Questions
1. What is the projected Compound Annual Growth Rate (CAGR) of the Water Treatment Chemicals Market in Australia?
The projected CAGR is approximately 3.17%.
2. Which companies are prominent players in the Water Treatment Chemicals Market in Australia?
Key companies in the market include Kemira Oyj, Coogee, Ecolab, SNF, IWTS Group Pty Ltd, Solvay, Buckman, Aquasol, Dow, Solenis, Ixom, Albemarle Corporation, Veolia (Veolia Water Technologies).
3. What are the main segments of the Water Treatment Chemicals Market in Australia?
The market segments include Product Type, End-user Industry.
4. Can you provide details about the market size?
The market size is estimated to be USD 467.75 Million as of 2022.
5. What are some drivers contributing to market growth?
Rising Groundwater and Surface Water Pollution; Growing Demand From Power and Industrial Applications; Increasing Government Intervention in Reliable Wastewater Management.
6. What are the notable trends driving market growth?
Municipal End-user Industry to Dominate the Market.
7. Are there any restraints impacting market growth?
Hazardous Nature of Hydrazine; Emerging Alternatives to Water Treatment Chemicals.
8. Can you provide examples of recent developments in the market?
In June 2022, Kemira Oyj announced a new collaboration with a France-based company, Veolia, to launch a new technology named ViviMag. This technology can recover phosphorus and other valuable resources, such as iron, from sewage sludge. Phosphorus causes the overfertilization of the surface waters if not removed properly, causing a major environmental problem. This new technology will help Kemira OYJ strengthen its position in the water treatment sector.
9. What pricing options are available for accessing the report?
Pricing options include single-user, multi-user, and enterprise licenses priced at USD 3,950, USD 4,950, and USD 6,950 respectively.
10. Is the market size provided in terms of value or volume?
The market size is provided in terms of value, measured in Million and volume, measured in K Tons.
11. Are there any specific market keywords associated with the report?
Yes, the market keyword associated with the report is "Water Treatment Chemicals Market in Australia," which aids in identifying and referencing the specific market segment covered.
12. How do I determine which pricing option suits my needs best?
The pricing options vary based on user requirements and access needs. Individual users may opt for single-user licenses, while businesses requiring broader access may choose multi-user or enterprise licenses for cost-effective access to the report.
13. Are there any additional resources or data provided in the Water Treatment Chemicals Market in Australia report?
While the report offers comprehensive insights, it's advisable to review the specific contents or supplementary materials provided to ascertain if additional resources or data are available.
14. How can I stay updated on further developments or reports in the Water Treatment Chemicals Market in Australia?
To stay informed about further developments, trends, and reports in the Water Treatment Chemicals Market in Australia, consider subscribing to industry newsletters, following relevant companies and organizations, or regularly checking reputable industry news sources and publications.
Methodology
Step 1 - Identification of Relevant Samples Size from Population Database


Step 2 - Approaches for Defining Global Market Size (Value, Volume* & Price*)

Note*: In applicable scenarios
Step 3 - Data Sources
Primary Research
- Web Analytics
- Survey Reports
- Research Institute
- Latest Research Reports
- Opinion Leaders
Secondary Research
- Annual Reports
- White Paper
- Latest Press Release
- Industry Association
- Paid Database
- Investor Presentations

Step 4 - Data Triangulation
Involves using different sources of information in order to increase the validity of a study
These sources are likely to be stakeholders in a program - participants, other researchers, program staff, other community members, and so on.
Then we put all data in single framework & apply various statistical tools to find out the dynamic on the market.
During the analysis stage, feedback from the stakeholder groups would be compared to determine areas of agreement as well as areas of divergence