

Key Insights
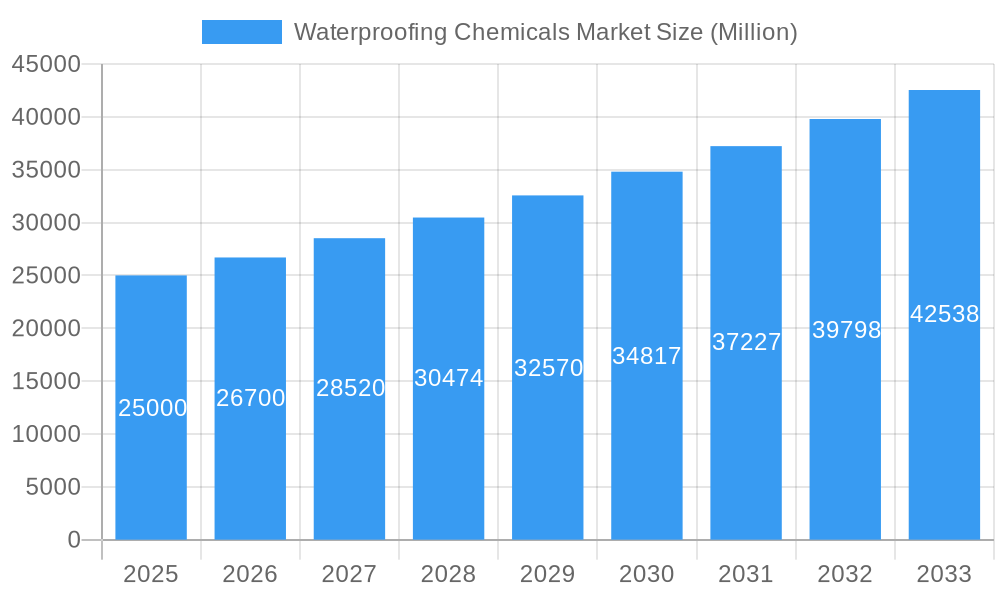
The global waterproofing chemicals market, valued at approximately $79.82 billion in 2025, is projected to experience robust growth with a Compound Annual Growth Rate (CAGR) of 9.2% from 2025 to 2033. This expansion is driven by the burgeoning construction industry, rapid urbanization in developing economies, and increasing awareness of building durability and the associated long-term costs of water damage. Stricter building codes and the adoption of advanced, eco-friendly waterproofing solutions, such as high-performance water-based and improved epoxy systems, further fuel market demand. The market is segmented by end-use (commercial, industrial & institutional, infrastructure, residential) and technology (epoxy-based, polyurethane-based, water-based, other). While the residential sector currently dominates, the infrastructure segment is poised for accelerated growth due to global large-scale projects.
Waterproofing Chemicals Market Market Size (In Billion)
Market growth is moderated by raw material price volatility, particularly for polymers and resins, and stringent environmental regulations driving the demand for sustainable solutions. Intense competition among established and emerging players necessitates continuous innovation and cost optimization. Despite these challenges, the long-term outlook is positive, supported by sustained infrastructure development, rising construction activity, and a growing emphasis on sustainable building practices. The Asia-Pacific region, especially China and India, is expected to lead growth due to rapid industrialization and urbanization.
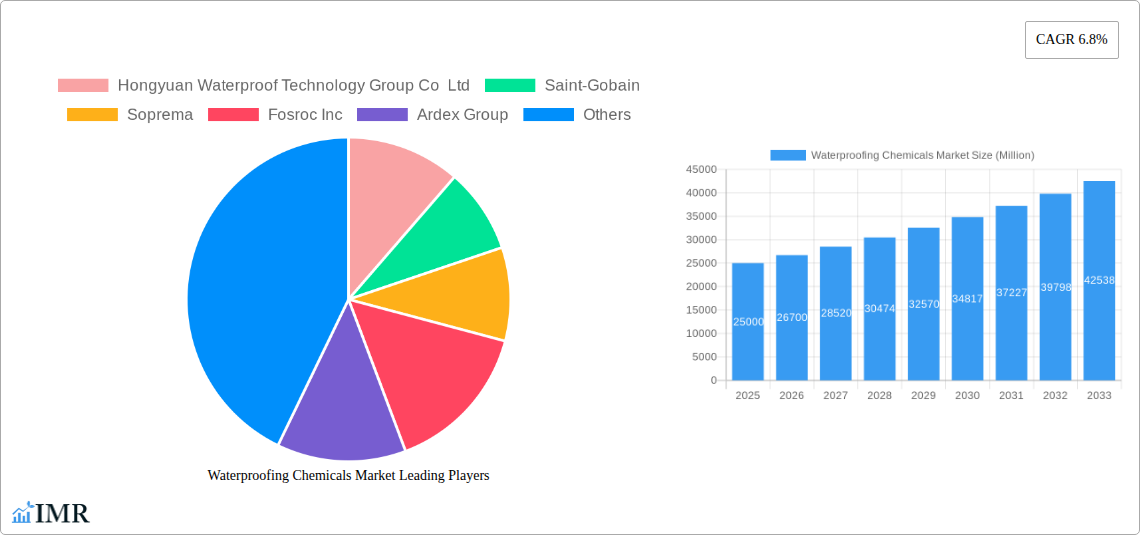
Waterproofing Chemicals Market Company Market Share
Waterproofing Chemicals Market: A Comprehensive Market Report (2019-2033)
This comprehensive report provides an in-depth analysis of the Waterproofing Chemicals Market, encompassing market dynamics, growth trends, regional analysis, product landscape, key players, and future outlook. The study period covers 2019-2033, with 2025 as the base year and a forecast period of 2025-2033. The report segments the market by end-use sector (Commercial, Industrial & Institutional, Infrastructure, Residential) and technology (Epoxy-based, Polyurethane-based, Water-based, Other Technologies), offering a granular view of this crucial industry. The market size is valued in million units.
Waterproofing Chemicals Market Dynamics & Structure
The global waterproofing chemicals market is characterized by moderate concentration, with key players like Saint-Gobain, Sika AG, MAPEI S p A, and Soprema holding significant market share (xx%). Technological innovation, driven by the need for high-performance, sustainable, and eco-friendly solutions, is a major growth driver. Stringent environmental regulations are shaping product development, favoring water-based and low-VOC options. The market also faces competition from traditional waterproofing methods, and the adoption rate varies across regions due to differences in building codes and construction practices. Furthermore, mergers and acquisitions (M&A) are reshaping the competitive landscape, with xx M&A deals recorded in the past five years.
- Market Concentration: Moderately concentrated, with top players holding xx% market share.
- Technological Innovation: Focus on sustainable, high-performance materials like epoxy and polyurethane-based solutions.
- Regulatory Framework: Stringent environmental regulations driving the shift towards eco-friendly products.
- Competitive Substitutes: Traditional waterproofing methods pose competition.
- End-User Demographics: Growth driven by increasing construction activities across various sectors.
- M&A Trends: Significant M&A activity consolidating market share and expanding product portfolios. Innovation barriers include high R&D costs and stringent regulatory approvals.
Waterproofing Chemicals Market Growth Trends & Insights
The waterproofing chemicals market exhibited a CAGR of xx% during the historical period (2019-2024), reaching a market size of xx million units in 2024. This growth is attributed to factors like rising infrastructure development, particularly in emerging economies, and the increasing adoption of advanced waterproofing technologies in residential and commercial construction. Technological disruptions, such as the introduction of self-healing and smart waterproofing materials, are expected to further accelerate market expansion. Consumer behavior shifts towards sustainable and eco-friendly construction practices also support market growth. The forecast period (2025-2033) projects a CAGR of xx%, driven by increasing urbanization, infrastructure investments, and government initiatives promoting sustainable building practices. Market penetration rates are expected to increase significantly, especially in developing regions with rapidly expanding construction sectors. The overall market size is projected to reach xx million units by 2033.
Dominant Regions, Countries, or Segments in Waterproofing Chemicals Market
The Asia-Pacific region currently dominates the waterproofing chemicals market, driven by rapid urbanization, robust infrastructure development, and a booming construction sector. China and India are key contributors to this regional dominance. Within the end-use sectors, Infrastructure and Commercial projects demonstrate the highest growth potential due to large-scale construction projects and the demand for durable and long-lasting waterproofing solutions. In terms of technology, epoxy-based and polyurethane-based chemicals are leading the market due to their superior performance characteristics and versatility.
- Key Drivers:
- Rapid urbanization and infrastructure development in Asia-Pacific.
- Increasing construction activities in emerging economies.
- Demand for durable and high-performance waterproofing solutions.
- Government initiatives promoting sustainable building practices.
- Dominance Factors: High construction spending, favorable government policies, and increasing awareness of building longevity and moisture control.
Waterproofing Chemicals Market Product Landscape
The market offers a wide array of waterproofing chemicals, tailored to specific applications and substrates. Recent innovations focus on enhancing durability, reducing environmental impact, and simplifying application processes. Products like SOPREMA's Alsan Flashing Neo exemplify this trend, offering primerless application for improved efficiency. Unique selling propositions include enhanced flexibility, improved adhesion, and long-term performance guarantees. Technological advancements are focused on developing self-healing, smart materials with embedded sensors to monitor and prevent leaks.
Key Drivers, Barriers & Challenges in Waterproofing Chemicals Market
Key Drivers: The increasing demand for durable and long-lasting waterproofing solutions across diverse construction projects is a major driver. Government regulations promoting sustainable building materials and initiatives to improve infrastructure are also propelling market growth. Technological advancements, such as the development of high-performance, eco-friendly chemicals, further contribute to market expansion.
Challenges: Fluctuations in raw material prices, stringent environmental regulations, and intense competition among established players present challenges to market growth. Supply chain disruptions, particularly post-pandemic, caused material shortages and price volatility, impacting profitability. Regulatory hurdles and compliance requirements also add to the operational complexity.
Emerging Opportunities in Waterproofing Chemicals Market
Untapped markets in developing regions present significant growth opportunities. Innovative applications in areas such as green building technologies, smart infrastructure, and specialized industrial settings offer considerable potential. Evolving consumer preferences for sustainable and environmentally responsible products drive demand for eco-friendly waterproofing solutions.
Growth Accelerators in the Waterproofing Chemicals Market Industry
Technological breakthroughs in material science and advanced manufacturing techniques will continue to drive innovation. Strategic partnerships between chemical manufacturers and construction companies can facilitate market expansion. Expanding into new geographic markets and focusing on specialized niche applications offer further growth opportunities.
Key Players Shaping the Waterproofing Chemicals Market Market
- Hongyuan Waterproof Technology Group Co Ltd
- Saint-Gobain
- Soprema
- Fosroc Inc
- Ardex Group
- MAPEI S p A
- Sika AG
- Keshun Waterproof Technology Co ltd
- Standard Industries Inc
- Oriental Yuhong
Notable Milestones in Waterproofing Chemicals Market Sector
- January 2022: SOPREMA launched Alsan Flashing Neo, a next-generation primerless waterproofing chemical.
- May 2022: Sika AG acquired United Gilsonite Laboratories, strengthening its US market presence.
- November 2022: MAPEI invested in Sopro Bauchemie, expanding production and R&D capabilities.
In-Depth Waterproofing Chemicals Market Market Outlook
The waterproofing chemicals market is poised for sustained growth, driven by ongoing infrastructure development, technological innovation, and increasing demand for sustainable building materials. Strategic investments in R&D, strategic partnerships, and expansion into high-growth markets will be crucial for success in this dynamic sector. The market's future is bright, with significant potential for both established players and new entrants.
Waterproofing Chemicals Market Segmentation
-
1. End Use Sector
- 1.1. Commercial
- 1.2. Industrial and Institutional
- 1.3. Infrastructure
- 1.4. Residential
-
2. Technology
- 2.1. Epoxy-based
- 2.2. Polyurethane-based
- 2.3. Water-based
- 2.4. Other Technologies
Waterproofing Chemicals Market Segmentation By Geography
-
1. North America
- 1.1. United States
- 1.2. Canada
- 1.3. Mexico
-
2. South America
- 2.1. Brazil
- 2.2. Argentina
- 2.3. Rest of South America
-
3. Europe
- 3.1. United Kingdom
- 3.2. Germany
- 3.3. France
- 3.4. Italy
- 3.5. Spain
- 3.6. Russia
- 3.7. Benelux
- 3.8. Nordics
- 3.9. Rest of Europe
-
4. Middle East & Africa
- 4.1. Turkey
- 4.2. Israel
- 4.3. GCC
- 4.4. North Africa
- 4.5. South Africa
- 4.6. Rest of Middle East & Africa
-
5. Asia Pacific
- 5.1. China
- 5.2. India
- 5.3. Japan
- 5.4. South Korea
- 5.5. ASEAN
- 5.6. Oceania
- 5.7. Rest of Asia Pacific
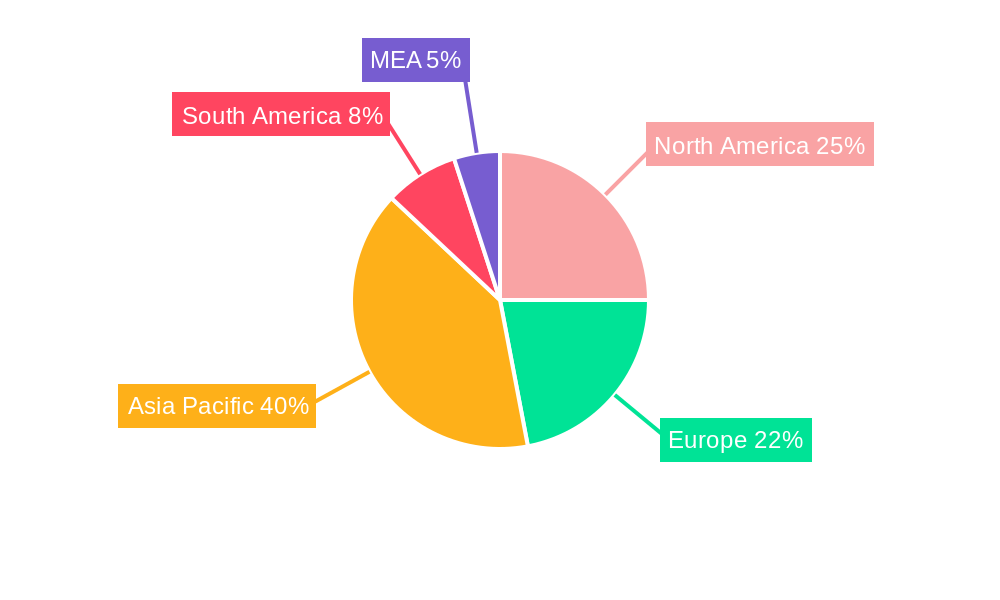
Waterproofing Chemicals Market Regional Market Share
Geographic Coverage of Waterproofing Chemicals Market
Waterproofing Chemicals Market REPORT HIGHLIGHTS
| Aspects | Details |
|---|---|
| Study Period | 2020-2034 |
| Base Year | 2025 |
| Estimated Year | 2026 |
| Forecast Period | 2026-2034 |
| Historical Period | 2020-2025 |
| Growth Rate | CAGR of 9.88% from 2020-2034 |
| Segmentation |
|
Table of Contents
- 1. Introduction
- 1.1. Research Scope
- 1.2. Market Segmentation
- 1.3. Research Objective
- 1.4. Definitions and Assumptions
- 2. Executive Summary
- 2.1. Market Snapshot
- 3. Market Dynamics
- 3.1. Market Drivers
- 3.2. Market Restrains
- 3.3. Market Trends
- 3.4. Market Opportunities
- 4. Market Factor Analysis
- 4.1. Porters Five Forces
- 4.1.1. Bargaining Power of Suppliers
- 4.1.2. Bargaining Power of Buyers
- 4.1.3. Threat of New Entrants
- 4.1.4. Threat of Substitutes
- 4.1.5. Competitive Rivalry
- 4.2. PESTEL analysis
- 4.3. BCG Analysis
- 4.3.1. Stars (High Growth, High Market Share)
- 4.3.2. Cash Cows (Low Growth, High Market Share)
- 4.3.3. Question Mark (High Growth, Low Market Share)
- 4.3.4. Dogs (Low Growth, Low Market Share)
- 4.4. Ansoff Matrix Analysis
- 4.5. Supply Chain Analysis
- 4.6. Regulatory Landscape
- 4.7. Current Market Potential and Opportunity Assessment (TAM–SAM–SOM Framework)
- 4.8. IMR Analyst Note
- 4.1. Porters Five Forces
- 5. Market Analysis, Insights and Forecast 2021-2033
- 5.1. Market Analysis, Insights and Forecast - by End Use Sector
- 5.1.1. Commercial
- 5.1.2. Industrial and Institutional
- 5.1.3. Infrastructure
- 5.1.4. Residential
- 5.2. Market Analysis, Insights and Forecast - by Technology
- 5.2.1. Epoxy-based
- 5.2.2. Polyurethane-based
- 5.2.3. Water-based
- 5.2.4. Other Technologies
- 5.3. Market Analysis, Insights and Forecast - by Region
- 5.3.1. North America
- 5.3.2. South America
- 5.3.3. Europe
- 5.3.4. Middle East & Africa
- 5.3.5. Asia Pacific
- 5.1. Market Analysis, Insights and Forecast - by End Use Sector
- 6. Global Waterproofing Chemicals Market Analysis, Insights and Forecast, 2021-2033
- 6.1. Market Analysis, Insights and Forecast - by End Use Sector
- 6.1.1. Commercial
- 6.1.2. Industrial and Institutional
- 6.1.3. Infrastructure
- 6.1.4. Residential
- 6.2. Market Analysis, Insights and Forecast - by Technology
- 6.2.1. Epoxy-based
- 6.2.2. Polyurethane-based
- 6.2.3. Water-based
- 6.2.4. Other Technologies
- 6.1. Market Analysis, Insights and Forecast - by End Use Sector
- 7. North America Waterproofing Chemicals Market Analysis, Insights and Forecast, 2020-2032
- 7.1. Market Analysis, Insights and Forecast - by End Use Sector
- 7.1.1. Commercial
- 7.1.2. Industrial and Institutional
- 7.1.3. Infrastructure
- 7.1.4. Residential
- 7.2. Market Analysis, Insights and Forecast - by Technology
- 7.2.1. Epoxy-based
- 7.2.2. Polyurethane-based
- 7.2.3. Water-based
- 7.2.4. Other Technologies
- 7.1. Market Analysis, Insights and Forecast - by End Use Sector
- 8. South America Waterproofing Chemicals Market Analysis, Insights and Forecast, 2020-2032
- 8.1. Market Analysis, Insights and Forecast - by End Use Sector
- 8.1.1. Commercial
- 8.1.2. Industrial and Institutional
- 8.1.3. Infrastructure
- 8.1.4. Residential
- 8.2. Market Analysis, Insights and Forecast - by Technology
- 8.2.1. Epoxy-based
- 8.2.2. Polyurethane-based
- 8.2.3. Water-based
- 8.2.4. Other Technologies
- 8.1. Market Analysis, Insights and Forecast - by End Use Sector
- 9. Europe Waterproofing Chemicals Market Analysis, Insights and Forecast, 2020-2032
- 9.1. Market Analysis, Insights and Forecast - by End Use Sector
- 9.1.1. Commercial
- 9.1.2. Industrial and Institutional
- 9.1.3. Infrastructure
- 9.1.4. Residential
- 9.2. Market Analysis, Insights and Forecast - by Technology
- 9.2.1. Epoxy-based
- 9.2.2. Polyurethane-based
- 9.2.3. Water-based
- 9.2.4. Other Technologies
- 9.1. Market Analysis, Insights and Forecast - by End Use Sector
- 10. Middle East & Africa Waterproofing Chemicals Market Analysis, Insights and Forecast, 2020-2032
- 10.1. Market Analysis, Insights and Forecast - by End Use Sector
- 10.1.1. Commercial
- 10.1.2. Industrial and Institutional
- 10.1.3. Infrastructure
- 10.1.4. Residential
- 10.2. Market Analysis, Insights and Forecast - by Technology
- 10.2.1. Epoxy-based
- 10.2.2. Polyurethane-based
- 10.2.3. Water-based
- 10.2.4. Other Technologies
- 10.1. Market Analysis, Insights and Forecast - by End Use Sector
- 11. Asia Pacific Waterproofing Chemicals Market Analysis, Insights and Forecast, 2020-2032
- 11.1. Market Analysis, Insights and Forecast - by End Use Sector
- 11.1.1. Commercial
- 11.1.2. Industrial and Institutional
- 11.1.3. Infrastructure
- 11.1.4. Residential
- 11.2. Market Analysis, Insights and Forecast - by Technology
- 11.2.1. Epoxy-based
- 11.2.2. Polyurethane-based
- 11.2.3. Water-based
- 11.2.4. Other Technologies
- 11.1. Market Analysis, Insights and Forecast - by End Use Sector
- 12. Competitive Analysis
- 12.1. Company Profiles
- 12.1.1 Hongyuan Waterproof Technology Group Co Ltd
- 12.1.1.1. Company Overview
- 12.1.1.2. Products
- 12.1.1.3. Company Financials
- 12.1.1.4. SWOT Analysis
- 12.1.2 Saint-Gobain
- 12.1.2.1. Company Overview
- 12.1.2.2. Products
- 12.1.2.3. Company Financials
- 12.1.2.4. SWOT Analysis
- 12.1.3 Soprema
- 12.1.3.1. Company Overview
- 12.1.3.2. Products
- 12.1.3.3. Company Financials
- 12.1.3.4. SWOT Analysis
- 12.1.4 Fosroc Inc
- 12.1.4.1. Company Overview
- 12.1.4.2. Products
- 12.1.4.3. Company Financials
- 12.1.4.4. SWOT Analysis
- 12.1.5 Ardex Group
- 12.1.5.1. Company Overview
- 12.1.5.2. Products
- 12.1.5.3. Company Financials
- 12.1.5.4. SWOT Analysis
- 12.1.6 MAPEI S p A
- 12.1.6.1. Company Overview
- 12.1.6.2. Products
- 12.1.6.3. Company Financials
- 12.1.6.4. SWOT Analysis
- 12.1.7 Sika AG
- 12.1.7.1. Company Overview
- 12.1.7.2. Products
- 12.1.7.3. Company Financials
- 12.1.7.4. SWOT Analysis
- 12.1.8 Keshun Waterproof Technology Co ltd
- 12.1.8.1. Company Overview
- 12.1.8.2. Products
- 12.1.8.3. Company Financials
- 12.1.8.4. SWOT Analysis
- 12.1.9 Standard Industries Inc
- 12.1.9.1. Company Overview
- 12.1.9.2. Products
- 12.1.9.3. Company Financials
- 12.1.9.4. SWOT Analysis
- 12.1.10 Oriental Yuhong
- 12.1.10.1. Company Overview
- 12.1.10.2. Products
- 12.1.10.3. Company Financials
- 12.1.10.4. SWOT Analysis
- 12.1.1 Hongyuan Waterproof Technology Group Co Ltd
- 12.2. Market Entropy
- 12.2.1 Company's Key Areas Served
- 12.2.2 Recent Developments
- 12.3. Company Market Share Analysis 2025
- 12.3.1 Top 5 Companies Market Share Analysis
- 12.3.2 Top 3 Companies Market Share Analysis
- 12.4. List of Potential Customers
- 13. Research Methodology
List of Figures
- Figure 1: Global Waterproofing Chemicals Market Revenue Breakdown (billion, %) by Region 2025 & 2033
- Figure 2: Global Waterproofing Chemicals Market Volume Breakdown (K Tons, %) by Region 2025 & 2033
- Figure 3: North America Waterproofing Chemicals Market Revenue (billion), by End Use Sector 2025 & 2033
- Figure 4: North America Waterproofing Chemicals Market Volume (K Tons), by End Use Sector 2025 & 2033
- Figure 5: North America Waterproofing Chemicals Market Revenue Share (%), by End Use Sector 2025 & 2033
- Figure 6: North America Waterproofing Chemicals Market Volume Share (%), by End Use Sector 2025 & 2033
- Figure 7: North America Waterproofing Chemicals Market Revenue (billion), by Technology 2025 & 2033
- Figure 8: North America Waterproofing Chemicals Market Volume (K Tons), by Technology 2025 & 2033
- Figure 9: North America Waterproofing Chemicals Market Revenue Share (%), by Technology 2025 & 2033
- Figure 10: North America Waterproofing Chemicals Market Volume Share (%), by Technology 2025 & 2033
- Figure 11: North America Waterproofing Chemicals Market Revenue (billion), by Country 2025 & 2033
- Figure 12: North America Waterproofing Chemicals Market Volume (K Tons), by Country 2025 & 2033
- Figure 13: North America Waterproofing Chemicals Market Revenue Share (%), by Country 2025 & 2033
- Figure 14: North America Waterproofing Chemicals Market Volume Share (%), by Country 2025 & 2033
- Figure 15: South America Waterproofing Chemicals Market Revenue (billion), by End Use Sector 2025 & 2033
- Figure 16: South America Waterproofing Chemicals Market Volume (K Tons), by End Use Sector 2025 & 2033
- Figure 17: South America Waterproofing Chemicals Market Revenue Share (%), by End Use Sector 2025 & 2033
- Figure 18: South America Waterproofing Chemicals Market Volume Share (%), by End Use Sector 2025 & 2033
- Figure 19: South America Waterproofing Chemicals Market Revenue (billion), by Technology 2025 & 2033
- Figure 20: South America Waterproofing Chemicals Market Volume (K Tons), by Technology 2025 & 2033
- Figure 21: South America Waterproofing Chemicals Market Revenue Share (%), by Technology 2025 & 2033
- Figure 22: South America Waterproofing Chemicals Market Volume Share (%), by Technology 2025 & 2033
- Figure 23: South America Waterproofing Chemicals Market Revenue (billion), by Country 2025 & 2033
- Figure 24: South America Waterproofing Chemicals Market Volume (K Tons), by Country 2025 & 2033
- Figure 25: South America Waterproofing Chemicals Market Revenue Share (%), by Country 2025 & 2033
- Figure 26: South America Waterproofing Chemicals Market Volume Share (%), by Country 2025 & 2033
- Figure 27: Europe Waterproofing Chemicals Market Revenue (billion), by End Use Sector 2025 & 2033
- Figure 28: Europe Waterproofing Chemicals Market Volume (K Tons), by End Use Sector 2025 & 2033
- Figure 29: Europe Waterproofing Chemicals Market Revenue Share (%), by End Use Sector 2025 & 2033
- Figure 30: Europe Waterproofing Chemicals Market Volume Share (%), by End Use Sector 2025 & 2033
- Figure 31: Europe Waterproofing Chemicals Market Revenue (billion), by Technology 2025 & 2033
- Figure 32: Europe Waterproofing Chemicals Market Volume (K Tons), by Technology 2025 & 2033
- Figure 33: Europe Waterproofing Chemicals Market Revenue Share (%), by Technology 2025 & 2033
- Figure 34: Europe Waterproofing Chemicals Market Volume Share (%), by Technology 2025 & 2033
- Figure 35: Europe Waterproofing Chemicals Market Revenue (billion), by Country 2025 & 2033
- Figure 36: Europe Waterproofing Chemicals Market Volume (K Tons), by Country 2025 & 2033
- Figure 37: Europe Waterproofing Chemicals Market Revenue Share (%), by Country 2025 & 2033
- Figure 38: Europe Waterproofing Chemicals Market Volume Share (%), by Country 2025 & 2033
- Figure 39: Middle East & Africa Waterproofing Chemicals Market Revenue (billion), by End Use Sector 2025 & 2033
- Figure 40: Middle East & Africa Waterproofing Chemicals Market Volume (K Tons), by End Use Sector 2025 & 2033
- Figure 41: Middle East & Africa Waterproofing Chemicals Market Revenue Share (%), by End Use Sector 2025 & 2033
- Figure 42: Middle East & Africa Waterproofing Chemicals Market Volume Share (%), by End Use Sector 2025 & 2033
- Figure 43: Middle East & Africa Waterproofing Chemicals Market Revenue (billion), by Technology 2025 & 2033
- Figure 44: Middle East & Africa Waterproofing Chemicals Market Volume (K Tons), by Technology 2025 & 2033
- Figure 45: Middle East & Africa Waterproofing Chemicals Market Revenue Share (%), by Technology 2025 & 2033
- Figure 46: Middle East & Africa Waterproofing Chemicals Market Volume Share (%), by Technology 2025 & 2033
- Figure 47: Middle East & Africa Waterproofing Chemicals Market Revenue (billion), by Country 2025 & 2033
- Figure 48: Middle East & Africa Waterproofing Chemicals Market Volume (K Tons), by Country 2025 & 2033
- Figure 49: Middle East & Africa Waterproofing Chemicals Market Revenue Share (%), by Country 2025 & 2033
- Figure 50: Middle East & Africa Waterproofing Chemicals Market Volume Share (%), by Country 2025 & 2033
- Figure 51: Asia Pacific Waterproofing Chemicals Market Revenue (billion), by End Use Sector 2025 & 2033
- Figure 52: Asia Pacific Waterproofing Chemicals Market Volume (K Tons), by End Use Sector 2025 & 2033
- Figure 53: Asia Pacific Waterproofing Chemicals Market Revenue Share (%), by End Use Sector 2025 & 2033
- Figure 54: Asia Pacific Waterproofing Chemicals Market Volume Share (%), by End Use Sector 2025 & 2033
- Figure 55: Asia Pacific Waterproofing Chemicals Market Revenue (billion), by Technology 2025 & 2033
- Figure 56: Asia Pacific Waterproofing Chemicals Market Volume (K Tons), by Technology 2025 & 2033
- Figure 57: Asia Pacific Waterproofing Chemicals Market Revenue Share (%), by Technology 2025 & 2033
- Figure 58: Asia Pacific Waterproofing Chemicals Market Volume Share (%), by Technology 2025 & 2033
- Figure 59: Asia Pacific Waterproofing Chemicals Market Revenue (billion), by Country 2025 & 2033
- Figure 60: Asia Pacific Waterproofing Chemicals Market Volume (K Tons), by Country 2025 & 2033
- Figure 61: Asia Pacific Waterproofing Chemicals Market Revenue Share (%), by Country 2025 & 2033
- Figure 62: Asia Pacific Waterproofing Chemicals Market Volume Share (%), by Country 2025 & 2033
List of Tables
- Table 1: Global Waterproofing Chemicals Market Revenue billion Forecast, by End Use Sector 2020 & 2033
- Table 2: Global Waterproofing Chemicals Market Volume K Tons Forecast, by End Use Sector 2020 & 2033
- Table 3: Global Waterproofing Chemicals Market Revenue billion Forecast, by Technology 2020 & 2033
- Table 4: Global Waterproofing Chemicals Market Volume K Tons Forecast, by Technology 2020 & 2033
- Table 5: Global Waterproofing Chemicals Market Revenue billion Forecast, by Region 2020 & 2033
- Table 6: Global Waterproofing Chemicals Market Volume K Tons Forecast, by Region 2020 & 2033
- Table 7: Global Waterproofing Chemicals Market Revenue billion Forecast, by End Use Sector 2020 & 2033
- Table 8: Global Waterproofing Chemicals Market Volume K Tons Forecast, by End Use Sector 2020 & 2033
- Table 9: Global Waterproofing Chemicals Market Revenue billion Forecast, by Technology 2020 & 2033
- Table 10: Global Waterproofing Chemicals Market Volume K Tons Forecast, by Technology 2020 & 2033
- Table 11: Global Waterproofing Chemicals Market Revenue billion Forecast, by Country 2020 & 2033
- Table 12: Global Waterproofing Chemicals Market Volume K Tons Forecast, by Country 2020 & 2033
- Table 13: United States Waterproofing Chemicals Market Revenue (billion) Forecast, by Application 2020 & 2033
- Table 14: United States Waterproofing Chemicals Market Volume (K Tons) Forecast, by Application 2020 & 2033
- Table 15: Canada Waterproofing Chemicals Market Revenue (billion) Forecast, by Application 2020 & 2033
- Table 16: Canada Waterproofing Chemicals Market Volume (K Tons) Forecast, by Application 2020 & 2033
- Table 17: Mexico Waterproofing Chemicals Market Revenue (billion) Forecast, by Application 2020 & 2033
- Table 18: Mexico Waterproofing Chemicals Market Volume (K Tons) Forecast, by Application 2020 & 2033
- Table 19: Global Waterproofing Chemicals Market Revenue billion Forecast, by End Use Sector 2020 & 2033
- Table 20: Global Waterproofing Chemicals Market Volume K Tons Forecast, by End Use Sector 2020 & 2033
- Table 21: Global Waterproofing Chemicals Market Revenue billion Forecast, by Technology 2020 & 2033
- Table 22: Global Waterproofing Chemicals Market Volume K Tons Forecast, by Technology 2020 & 2033
- Table 23: Global Waterproofing Chemicals Market Revenue billion Forecast, by Country 2020 & 2033
- Table 24: Global Waterproofing Chemicals Market Volume K Tons Forecast, by Country 2020 & 2033
- Table 25: Brazil Waterproofing Chemicals Market Revenue (billion) Forecast, by Application 2020 & 2033
- Table 26: Brazil Waterproofing Chemicals Market Volume (K Tons) Forecast, by Application 2020 & 2033
- Table 27: Argentina Waterproofing Chemicals Market Revenue (billion) Forecast, by Application 2020 & 2033
- Table 28: Argentina Waterproofing Chemicals Market Volume (K Tons) Forecast, by Application 2020 & 2033
- Table 29: Rest of South America Waterproofing Chemicals Market Revenue (billion) Forecast, by Application 2020 & 2033
- Table 30: Rest of South America Waterproofing Chemicals Market Volume (K Tons) Forecast, by Application 2020 & 2033
- Table 31: Global Waterproofing Chemicals Market Revenue billion Forecast, by End Use Sector 2020 & 2033
- Table 32: Global Waterproofing Chemicals Market Volume K Tons Forecast, by End Use Sector 2020 & 2033
- Table 33: Global Waterproofing Chemicals Market Revenue billion Forecast, by Technology 2020 & 2033
- Table 34: Global Waterproofing Chemicals Market Volume K Tons Forecast, by Technology 2020 & 2033
- Table 35: Global Waterproofing Chemicals Market Revenue billion Forecast, by Country 2020 & 2033
- Table 36: Global Waterproofing Chemicals Market Volume K Tons Forecast, by Country 2020 & 2033
- Table 37: United Kingdom Waterproofing Chemicals Market Revenue (billion) Forecast, by Application 2020 & 2033
- Table 38: United Kingdom Waterproofing Chemicals Market Volume (K Tons) Forecast, by Application 2020 & 2033
- Table 39: Germany Waterproofing Chemicals Market Revenue (billion) Forecast, by Application 2020 & 2033
- Table 40: Germany Waterproofing Chemicals Market Volume (K Tons) Forecast, by Application 2020 & 2033
- Table 41: France Waterproofing Chemicals Market Revenue (billion) Forecast, by Application 2020 & 2033
- Table 42: France Waterproofing Chemicals Market Volume (K Tons) Forecast, by Application 2020 & 2033
- Table 43: Italy Waterproofing Chemicals Market Revenue (billion) Forecast, by Application 2020 & 2033
- Table 44: Italy Waterproofing Chemicals Market Volume (K Tons) Forecast, by Application 2020 & 2033
- Table 45: Spain Waterproofing Chemicals Market Revenue (billion) Forecast, by Application 2020 & 2033
- Table 46: Spain Waterproofing Chemicals Market Volume (K Tons) Forecast, by Application 2020 & 2033
- Table 47: Russia Waterproofing Chemicals Market Revenue (billion) Forecast, by Application 2020 & 2033
- Table 48: Russia Waterproofing Chemicals Market Volume (K Tons) Forecast, by Application 2020 & 2033
- Table 49: Benelux Waterproofing Chemicals Market Revenue (billion) Forecast, by Application 2020 & 2033
- Table 50: Benelux Waterproofing Chemicals Market Volume (K Tons) Forecast, by Application 2020 & 2033
- Table 51: Nordics Waterproofing Chemicals Market Revenue (billion) Forecast, by Application 2020 & 2033
- Table 52: Nordics Waterproofing Chemicals Market Volume (K Tons) Forecast, by Application 2020 & 2033
- Table 53: Rest of Europe Waterproofing Chemicals Market Revenue (billion) Forecast, by Application 2020 & 2033
- Table 54: Rest of Europe Waterproofing Chemicals Market Volume (K Tons) Forecast, by Application 2020 & 2033
- Table 55: Global Waterproofing Chemicals Market Revenue billion Forecast, by End Use Sector 2020 & 2033
- Table 56: Global Waterproofing Chemicals Market Volume K Tons Forecast, by End Use Sector 2020 & 2033
- Table 57: Global Waterproofing Chemicals Market Revenue billion Forecast, by Technology 2020 & 2033
- Table 58: Global Waterproofing Chemicals Market Volume K Tons Forecast, by Technology 2020 & 2033
- Table 59: Global Waterproofing Chemicals Market Revenue billion Forecast, by Country 2020 & 2033
- Table 60: Global Waterproofing Chemicals Market Volume K Tons Forecast, by Country 2020 & 2033
- Table 61: Turkey Waterproofing Chemicals Market Revenue (billion) Forecast, by Application 2020 & 2033
- Table 62: Turkey Waterproofing Chemicals Market Volume (K Tons) Forecast, by Application 2020 & 2033
- Table 63: Israel Waterproofing Chemicals Market Revenue (billion) Forecast, by Application 2020 & 2033
- Table 64: Israel Waterproofing Chemicals Market Volume (K Tons) Forecast, by Application 2020 & 2033
- Table 65: GCC Waterproofing Chemicals Market Revenue (billion) Forecast, by Application 2020 & 2033
- Table 66: GCC Waterproofing Chemicals Market Volume (K Tons) Forecast, by Application 2020 & 2033
- Table 67: North Africa Waterproofing Chemicals Market Revenue (billion) Forecast, by Application 2020 & 2033
- Table 68: North Africa Waterproofing Chemicals Market Volume (K Tons) Forecast, by Application 2020 & 2033
- Table 69: South Africa Waterproofing Chemicals Market Revenue (billion) Forecast, by Application 2020 & 2033
- Table 70: South Africa Waterproofing Chemicals Market Volume (K Tons) Forecast, by Application 2020 & 2033
- Table 71: Rest of Middle East & Africa Waterproofing Chemicals Market Revenue (billion) Forecast, by Application 2020 & 2033
- Table 72: Rest of Middle East & Africa Waterproofing Chemicals Market Volume (K Tons) Forecast, by Application 2020 & 2033
- Table 73: Global Waterproofing Chemicals Market Revenue billion Forecast, by End Use Sector 2020 & 2033
- Table 74: Global Waterproofing Chemicals Market Volume K Tons Forecast, by End Use Sector 2020 & 2033
- Table 75: Global Waterproofing Chemicals Market Revenue billion Forecast, by Technology 2020 & 2033
- Table 76: Global Waterproofing Chemicals Market Volume K Tons Forecast, by Technology 2020 & 2033
- Table 77: Global Waterproofing Chemicals Market Revenue billion Forecast, by Country 2020 & 2033
- Table 78: Global Waterproofing Chemicals Market Volume K Tons Forecast, by Country 2020 & 2033
- Table 79: China Waterproofing Chemicals Market Revenue (billion) Forecast, by Application 2020 & 2033
- Table 80: China Waterproofing Chemicals Market Volume (K Tons) Forecast, by Application 2020 & 2033
- Table 81: India Waterproofing Chemicals Market Revenue (billion) Forecast, by Application 2020 & 2033
- Table 82: India Waterproofing Chemicals Market Volume (K Tons) Forecast, by Application 2020 & 2033
- Table 83: Japan Waterproofing Chemicals Market Revenue (billion) Forecast, by Application 2020 & 2033
- Table 84: Japan Waterproofing Chemicals Market Volume (K Tons) Forecast, by Application 2020 & 2033
- Table 85: South Korea Waterproofing Chemicals Market Revenue (billion) Forecast, by Application 2020 & 2033
- Table 86: South Korea Waterproofing Chemicals Market Volume (K Tons) Forecast, by Application 2020 & 2033
- Table 87: ASEAN Waterproofing Chemicals Market Revenue (billion) Forecast, by Application 2020 & 2033
- Table 88: ASEAN Waterproofing Chemicals Market Volume (K Tons) Forecast, by Application 2020 & 2033
- Table 89: Oceania Waterproofing Chemicals Market Revenue (billion) Forecast, by Application 2020 & 2033
- Table 90: Oceania Waterproofing Chemicals Market Volume (K Tons) Forecast, by Application 2020 & 2033
- Table 91: Rest of Asia Pacific Waterproofing Chemicals Market Revenue (billion) Forecast, by Application 2020 & 2033
- Table 92: Rest of Asia Pacific Waterproofing Chemicals Market Volume (K Tons) Forecast, by Application 2020 & 2033
Frequently Asked Questions
1. What is the projected Compound Annual Growth Rate (CAGR) of the Waterproofing Chemicals Market?
The projected CAGR is approximately 9.88%.
2. Which companies are prominent players in the Waterproofing Chemicals Market?
Key companies in the market include Hongyuan Waterproof Technology Group Co Ltd, Saint-Gobain, Soprema, Fosroc Inc, Ardex Group, MAPEI S p A, Sika AG, Keshun Waterproof Technology Co ltd, Standard Industries Inc, Oriental Yuhong.
3. What are the main segments of the Waterproofing Chemicals Market?
The market segments include End Use Sector, Technology.
4. Can you provide details about the market size?
The market size is estimated to be USD 22.58 billion as of 2022.
5. What are some drivers contributing to market growth?
; Banning/ Limiting Use of Plastics used in packaging applications.
6. What are the notable trends driving market growth?
OTHER KEY INDUSTRY TRENDS COVERED IN THE REPORT.
7. Are there any restraints impacting market growth?
; Harmful Amines in Dyes; Paperless Green Initiatives.
8. Can you provide examples of recent developments in the market?
November 2022: MAPEI invested in its German subsidiary, Sopro Bauchemie, which manufactures concrete admixtures, anchors & grouts, dry-mix mortars, and waterproofing solutions, to expand its production capacity and upgrade its research and development facilities.May 2022: Sika AG recently completed its acquisition of United Gilsonite Laboratories, a company based in the United States. This move was aimed at bolstering Sika AG's range of waterproofing solutions within the US market.January 2022: SOPREMA has developed a next-generation waterproofing chemical called Alsan Flashing Neo, which can waterproof any substrate without a primer.
9. What pricing options are available for accessing the report?
Pricing options include single-user, multi-user, and enterprise licenses priced at USD 3800, USD 4500, and USD 5800 respectively.
10. Is the market size provided in terms of value or volume?
The market size is provided in terms of value, measured in billion and volume, measured in K Tons.
11. Are there any specific market keywords associated with the report?
Yes, the market keyword associated with the report is "Waterproofing Chemicals Market," which aids in identifying and referencing the specific market segment covered.
12. How do I determine which pricing option suits my needs best?
The pricing options vary based on user requirements and access needs. Individual users may opt for single-user licenses, while businesses requiring broader access may choose multi-user or enterprise licenses for cost-effective access to the report.
13. Are there any additional resources or data provided in the Waterproofing Chemicals Market report?
While the report offers comprehensive insights, it's advisable to review the specific contents or supplementary materials provided to ascertain if additional resources or data are available.
14. How can I stay updated on further developments or reports in the Waterproofing Chemicals Market?
To stay informed about further developments, trends, and reports in the Waterproofing Chemicals Market, consider subscribing to industry newsletters, following relevant companies and organizations, or regularly checking reputable industry news sources and publications.
Methodology
Step 1 - Identification of Relevant Samples Size from Population Database


Step 2 - Approaches for Defining Global Market Size (Value, Volume* & Price*)

Note*: In applicable scenarios
Step 3 - Data Sources
Primary Research
- Web Analytics
- Survey Reports
- Research Institute
- Latest Research Reports
- Opinion Leaders
Secondary Research
- Annual Reports
- White Paper
- Latest Press Release
- Industry Association
- Paid Database
- Investor Presentations

Step 4 - Data Triangulation
Involves using different sources of information in order to increase the validity of a study
These sources are likely to be stakeholders in a program - participants, other researchers, program staff, other community members, and so on.
Then we put all data in single framework & apply various statistical tools to find out the dynamic on the market.
During the analysis stage, feedback from the stakeholder groups would be compared to determine areas of agreement as well as areas of divergence