

Key Insights
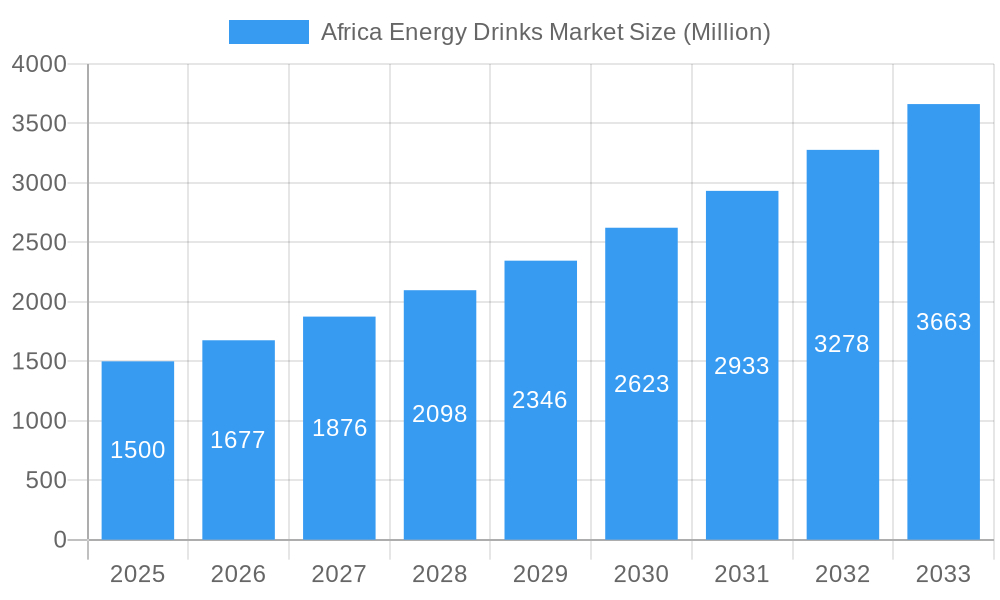
The African energy drinks market, valued at $3.65 billion in 2025, is projected for robust expansion, exhibiting a Compound Annual Growth Rate (CAGR) of 10.19% from 2025 to 2033. This growth is driven by a young, growing population with increasing disposable incomes, fostering demand for stimulating beverages. Urbanization and fast-paced lifestyles in major African cities also contribute significantly. Evolving consumer preferences are shifting towards healthier options, including sugar-free and natural/organic energy drinks, presenting innovation opportunities for manufacturers. While challenges like raw material price volatility and counterfeit products exist, the market outlook remains positive. Segmentation across packaging (glass bottles, metal cans, PET bottles), distribution channels (off-trade, on-trade), and product types (energy shots, natural/organic, sugar-free/low-calorie, traditional) offers avenues for targeted marketing and diversification. South Africa, Nigeria, and Egypt currently lead, but the Rest of Africa shows high growth potential as markets mature.
Africa Energy Drinks Market Market Size (In Billion)
Leading international and regional brands, including Red Bull, Coca-Cola, and PepsiCo, are actively vying for market share. Competitive strategies involve leveraging brand recognition, understanding regional tastes, and expanding distribution networks. Future growth will be shaped by increased marketing investments, innovative product development, and broader distribution. Strategic expansion by existing players and new entrants will continue to define the dynamic African energy drinks market. Success hinges on addressing health-conscious preferences, navigating regulatory landscapes, and ensuring supply chain efficiency.
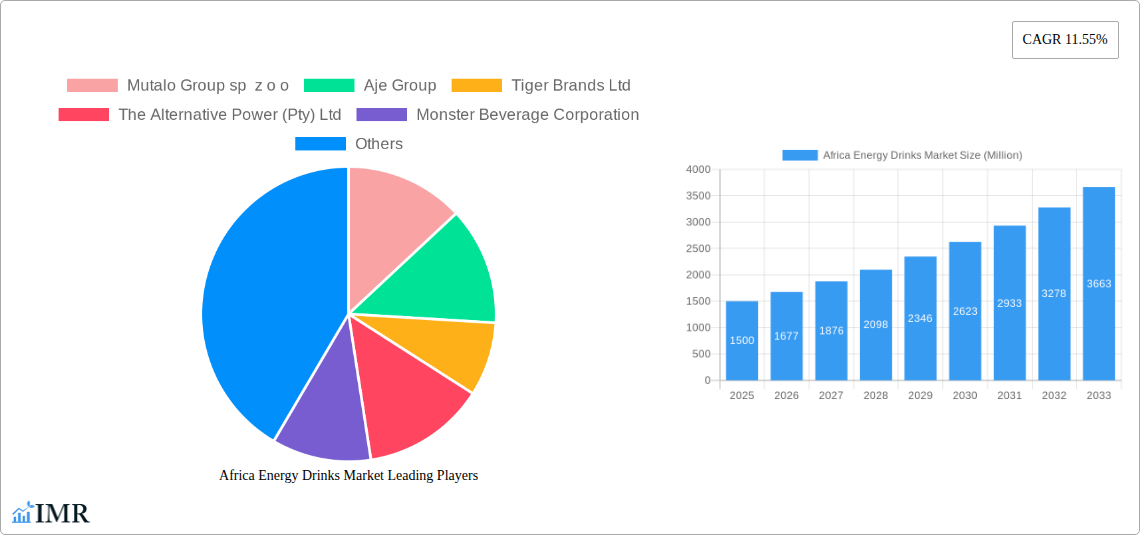
Africa Energy Drinks Market Company Market Share
Africa Energy Drinks Market: A Comprehensive Report (2019-2033)
This in-depth report provides a comprehensive analysis of the Africa energy drinks market, covering market dynamics, growth trends, key players, and future prospects. The report analyzes the parent market of soft drinks and the child market of energy drinks, providing granular insights across various segments and countries within Africa. The study period spans from 2019 to 2033, with 2025 as the base year and forecast extending to 2033. The report is an essential resource for industry professionals, investors, and stakeholders seeking to understand and capitalize on the growth opportunities within this dynamic market. Market values are presented in million units.
Africa Energy Drinks Market Dynamics & Structure
This section analyzes the competitive landscape, technological advancements, regulatory environment, and market trends within the African energy drinks sector. The market exhibits a moderately concentrated structure, with key players like Coca-Cola and Red Bull competing alongside regional brands. Technological innovation, particularly in packaging and formulation (e.g., sugar-free options), is a significant driver. Regulatory frameworks concerning sugar content and labeling vary across African nations, influencing product development and marketing strategies. The emergence of substitute beverages, such as functional waters and sports drinks, presents a competitive challenge. M&A activity within the sector remains relatively low (xx deals in the past 5 years), but strategic partnerships are increasingly prevalent. End-user demographics show a significant concentration among young adults (18-35 years), reflecting broader global trends.
- Market Concentration: Moderately concentrated, with a few major players and numerous regional brands.
- Technological Innovation: Focus on sustainable packaging, natural ingredients, and functional benefits.
- Regulatory Framework: Varying regulations across countries concerning sugar content and labeling.
- Competitive Substitutes: Functional waters, sports drinks, and other functional beverages.
- M&A Activity: Relatively low, but strategic partnerships are increasing. (xx deals in 2019-2024)
- End-User Demographics: Predominantly young adults (18-35 years).
Africa Energy Drinks Market Growth Trends & Insights
The African energy drinks market demonstrates robust growth, driven by rising disposable incomes, urbanization, and a growing youth population. The market size experienced significant expansion during the historical period (2019-2024), with a Compound Annual Growth Rate (CAGR) of xx%. This growth trajectory is projected to continue during the forecast period (2025-2033), reaching xx million units by 2033, fueled by increasing consumer awareness of energy drinks' benefits and the introduction of innovative products catered to local preferences. Market penetration remains relatively low compared to developed markets, suggesting substantial untapped potential. Technological disruptions, such as the adoption of more efficient production and distribution methods, are further propelling market growth. Changes in consumer behavior, particularly the shift towards healthier options (sugar-free/low-calorie drinks), are reshaping product offerings.
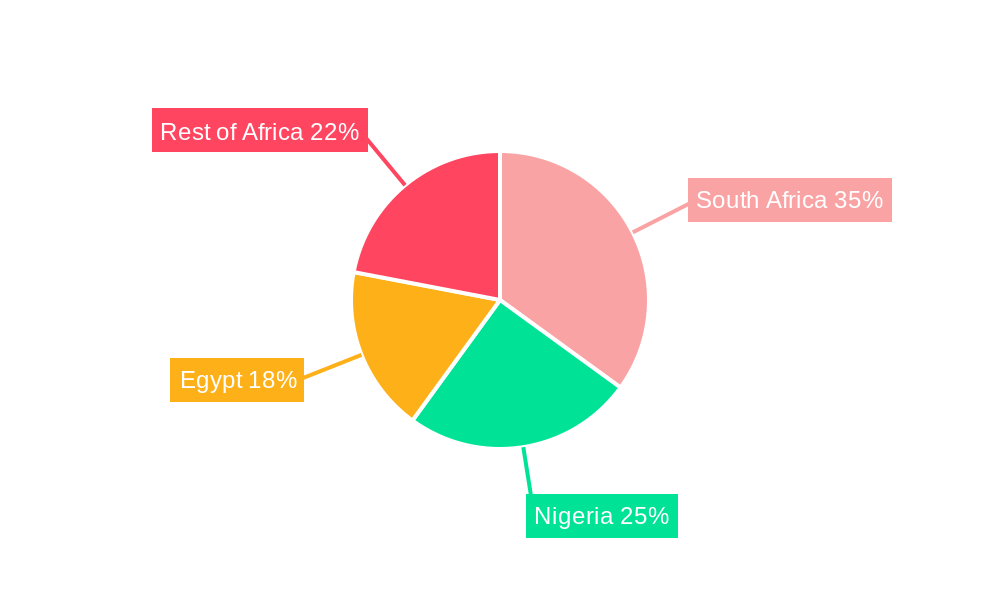
Dominant Regions, Countries, or Segments in Africa Energy Drinks Market
South Africa holds the largest market share within the African energy drink sector, followed by Nigeria and Egypt. This dominance is attributed to factors such as higher per capita incomes, greater brand awareness, and well-established distribution networks. The PET bottle packaging segment exhibits the highest growth rate, driven by its affordability and convenience. Within distribution channels, the off-trade segment (retail stores, supermarkets) holds a significantly larger share than the on-trade (restaurants, bars). Traditional energy drinks constitute the dominant soft drink type, although sugar-free and low-calorie options are experiencing rapid growth, reflecting evolving consumer health consciousness.
- Leading Country: South Africa (Market share: xx%)
- Fastest Growing Segment (Packaging): PET Bottles (CAGR: xx%)
- Largest Distribution Channel: Off-trade (Market share: xx%)
- Dominant Soft Drink Type: Traditional Energy Drinks (Market share: xx%)
- Key Growth Drivers (South Africa): Established infrastructure, high consumer spending.
- Key Growth Drivers (Nigeria): Large population, rising disposable incomes.
- Key Growth Drivers (Egypt): Growing urbanization, increased brand awareness.
Africa Energy Drinks Market Product Landscape
The African energy drinks market showcases a diverse range of products, encompassing traditional energy drinks, sugar-free/low-calorie options, and natural/organic formulations. Product innovation focuses on adapting flavors to local preferences, creating unique selling propositions, and incorporating functional benefits beyond energy enhancement. Technological advancements include improved packaging materials, optimized production processes, and enhanced ingredient sourcing for better sustainability.
Key Drivers, Barriers & Challenges in Africa Energy Drinks Market
Key Drivers:
- Rising disposable incomes and urbanization in several African countries are driving demand.
- Growing youth population creates a large consumer base.
- Increased brand awareness through marketing and distribution expansion.
- Product innovation tailored to local tastes and preferences.
Challenges:
- High import costs and import tariffs can restrict access to certain ingredients and packaging materials. This increases production costs and limits profitability. (Impact: xx% increase in production cost in some regions)
- Inconsistent regulatory frameworks across different African countries create hurdles in product standardization and marketing consistency.
- Intense competition from established international and local brands creates pressure on pricing and profitability.
Emerging Opportunities in Africa Energy Drinks Market
- Expanding into untapped markets within rural areas of Africa through mobile retail strategies.
- Introducing energy drinks with functional benefits targeted to specific health and wellness needs.
- Leveraging digital marketing channels to reach a wider consumer base.
- Development of locally sourced ingredients to cater to natural/organic consumer demand.
Growth Accelerators in the Africa Energy Drinks Market Industry
The long-term growth of the Africa energy drinks market is driven by several factors, including continued economic expansion leading to increased disposable incomes, a young and growing population, strategic partnerships between international and local brands enabling efficient market penetration, and technological advancements in areas such as efficient production and distribution systems. This combination of favorable macro-economic trends and proactive industry strategies contributes significantly to sustained market expansion.
Key Players Shaping the Africa Energy Drinks Market Market
- Mutalo Group sp z o o
- Aje Group
- Tiger Brands Ltd
- The Alternative Power (Pty) Ltd
- Monster Beverage Corporation
- PepsiCo Inc
- Mofaya Beverage Company (PTY) Ltd
- S Spitz GmbH
- Suntory Holdings Limited
- Red Bull GmbH
- Halewood International South Africa (Pty) Ltd
- The Coca-Cola Company
Notable Milestones in Africa Energy Drinks Market Sector
- September 2023: Switch Energy Drink launched a limited-edition flavor for South African Heritage Day.
- October 2023: Switch Energy Drink introduced three new limited-edition flavors.
- October 2023: Miss South Africa Natasha Joubert launched a Berry Queen-flavored energy drink under the MoFaya brand.
In-Depth Africa Energy Drinks Market Market Outlook
The Africa energy drinks market exhibits significant long-term growth potential, driven by sustained economic development, a burgeoning youth population, and increasing consumer awareness. Strategic partnerships, product innovation tailored to local preferences, and expansion into underserved markets will be key factors shaping future market dynamics. The market's continued evolution, coupled with effective adaptation to consumer trends and health consciousness, will ensure its position as a vibrant and profitable sector within the African beverage landscape.
Africa Energy Drinks Market Segmentation
-
1. Soft Drink Type
- 1.1. Energy Shots
- 1.2. Natural/Organic Energy Drinks
- 1.3. Sugar-free or Low-calories Energy Drinks
- 1.4. Traditional Energy Drinks
- 1.5. Other Energy Drinks
-
2. Packaging Type
- 2.1. Glass Bottles
- 2.2. Metal Can
- 2.3. PET Bottles
-
3. Distribution Channel
-
3.1. Off-trade
- 3.1.1. Convenience Stores
- 3.1.2. Online Retail
- 3.1.3. Supermarket/Hypermarket
- 3.1.4. Others
- 3.2. On-trade
-
3.1. Off-trade
Africa Energy Drinks Market Segmentation By Geography
-
1. Africa
- 1.1. Nigeria
- 1.2. South Africa
- 1.3. Egypt
- 1.4. Kenya
- 1.5. Ethiopia
- 1.6. Morocco
- 1.7. Ghana
- 1.8. Algeria
- 1.9. Tanzania
- 1.10. Ivory Coast
Africa Energy Drinks Market Regional Market Share
Geographic Coverage of Africa Energy Drinks Market
Africa Energy Drinks Market REPORT HIGHLIGHTS
| Aspects | Details |
|---|---|
| Study Period | 2020-2034 |
| Base Year | 2025 |
| Estimated Year | 2026 |
| Forecast Period | 2026-2034 |
| Historical Period | 2020-2025 |
| Growth Rate | CAGR of 10.19% from 2020-2034 |
| Segmentation |
|
Table of Contents
- 1. Introduction
- 1.1. Research Scope
- 1.2. Market Segmentation
- 1.3. Research Methodology
- 1.4. Definitions and Assumptions
- 2. Executive Summary
- 2.1. Introduction
- 3. Market Dynamics
- 3.1. Introduction
- 3.2. Market Drivers
- 3.2.1. Increasing Demand for Protein-Rich Food; Increasing Demand for Plant-Based and Organic Ingredients
- 3.3. Market Restrains
- 3.3.1. Presence of Counterfeit Products
- 3.4. Market Trends
- 3.4.1. OTHER KEY INDUSTRY TRENDS COVERED IN THE REPORT
- 4. Market Factor Analysis
- 4.1. Porters Five Forces
- 4.2. Supply/Value Chain
- 4.3. PESTEL analysis
- 4.4. Market Entropy
- 4.5. Patent/Trademark Analysis
- 5. Africa Energy Drinks Market Analysis, Insights and Forecast, 2020-2032
- 5.1. Market Analysis, Insights and Forecast - by Soft Drink Type
- 5.1.1. Energy Shots
- 5.1.2. Natural/Organic Energy Drinks
- 5.1.3. Sugar-free or Low-calories Energy Drinks
- 5.1.4. Traditional Energy Drinks
- 5.1.5. Other Energy Drinks
- 5.2. Market Analysis, Insights and Forecast - by Packaging Type
- 5.2.1. Glass Bottles
- 5.2.2. Metal Can
- 5.2.3. PET Bottles
- 5.3. Market Analysis, Insights and Forecast - by Distribution Channel
- 5.3.1. Off-trade
- 5.3.1.1. Convenience Stores
- 5.3.1.2. Online Retail
- 5.3.1.3. Supermarket/Hypermarket
- 5.3.1.4. Others
- 5.3.2. On-trade
- 5.3.1. Off-trade
- 5.4. Market Analysis, Insights and Forecast - by Region
- 5.4.1. Africa
- 5.1. Market Analysis, Insights and Forecast - by Soft Drink Type
- 6. Competitive Analysis
- 6.1. Market Share Analysis 2025
- 6.2. Company Profiles
- 6.2.1 Mutalo Group sp z o o
- 6.2.1.1. Overview
- 6.2.1.2. Products
- 6.2.1.3. SWOT Analysis
- 6.2.1.4. Recent Developments
- 6.2.1.5. Financials (Based on Availability)
- 6.2.2 Aje Group
- 6.2.2.1. Overview
- 6.2.2.2. Products
- 6.2.2.3. SWOT Analysis
- 6.2.2.4. Recent Developments
- 6.2.2.5. Financials (Based on Availability)
- 6.2.3 Tiger Brands Ltd
- 6.2.3.1. Overview
- 6.2.3.2. Products
- 6.2.3.3. SWOT Analysis
- 6.2.3.4. Recent Developments
- 6.2.3.5. Financials (Based on Availability)
- 6.2.4 The Alternative Power (Pty) Ltd
- 6.2.4.1. Overview
- 6.2.4.2. Products
- 6.2.4.3. SWOT Analysis
- 6.2.4.4. Recent Developments
- 6.2.4.5. Financials (Based on Availability)
- 6.2.5 Monster Beverage Corporation
- 6.2.5.1. Overview
- 6.2.5.2. Products
- 6.2.5.3. SWOT Analysis
- 6.2.5.4. Recent Developments
- 6.2.5.5. Financials (Based on Availability)
- 6.2.6 PepsiCo Inc
- 6.2.6.1. Overview
- 6.2.6.2. Products
- 6.2.6.3. SWOT Analysis
- 6.2.6.4. Recent Developments
- 6.2.6.5. Financials (Based on Availability)
- 6.2.7 Mofaya Beverage Company (PTY) Ltd
- 6.2.7.1. Overview
- 6.2.7.2. Products
- 6.2.7.3. SWOT Analysis
- 6.2.7.4. Recent Developments
- 6.2.7.5. Financials (Based on Availability)
- 6.2.8 S Spitz GmbH
- 6.2.8.1. Overview
- 6.2.8.2. Products
- 6.2.8.3. SWOT Analysis
- 6.2.8.4. Recent Developments
- 6.2.8.5. Financials (Based on Availability)
- 6.2.9 Suntory Holdings Limited
- 6.2.9.1. Overview
- 6.2.9.2. Products
- 6.2.9.3. SWOT Analysis
- 6.2.9.4. Recent Developments
- 6.2.9.5. Financials (Based on Availability)
- 6.2.10 Red Bull GmbH
- 6.2.10.1. Overview
- 6.2.10.2. Products
- 6.2.10.3. SWOT Analysis
- 6.2.10.4. Recent Developments
- 6.2.10.5. Financials (Based on Availability)
- 6.2.11 Halewood International South Africa (Pty) Ltd
- 6.2.11.1. Overview
- 6.2.11.2. Products
- 6.2.11.3. SWOT Analysis
- 6.2.11.4. Recent Developments
- 6.2.11.5. Financials (Based on Availability)
- 6.2.12 The Coca-Cola Company
- 6.2.12.1. Overview
- 6.2.12.2. Products
- 6.2.12.3. SWOT Analysis
- 6.2.12.4. Recent Developments
- 6.2.12.5. Financials (Based on Availability)
- 6.2.1 Mutalo Group sp z o o
List of Figures
- Figure 1: Africa Energy Drinks Market Revenue Breakdown (billion, %) by Product 2025 & 2033
- Figure 2: Africa Energy Drinks Market Share (%) by Company 2025
List of Tables
- Table 1: Africa Energy Drinks Market Revenue billion Forecast, by Soft Drink Type 2020 & 2033
- Table 2: Africa Energy Drinks Market Volume K Tons Forecast, by Soft Drink Type 2020 & 2033
- Table 3: Africa Energy Drinks Market Revenue billion Forecast, by Packaging Type 2020 & 2033
- Table 4: Africa Energy Drinks Market Volume K Tons Forecast, by Packaging Type 2020 & 2033
- Table 5: Africa Energy Drinks Market Revenue billion Forecast, by Distribution Channel 2020 & 2033
- Table 6: Africa Energy Drinks Market Volume K Tons Forecast, by Distribution Channel 2020 & 2033
- Table 7: Africa Energy Drinks Market Revenue billion Forecast, by Region 2020 & 2033
- Table 8: Africa Energy Drinks Market Volume K Tons Forecast, by Region 2020 & 2033
- Table 9: Africa Energy Drinks Market Revenue billion Forecast, by Soft Drink Type 2020 & 2033
- Table 10: Africa Energy Drinks Market Volume K Tons Forecast, by Soft Drink Type 2020 & 2033
- Table 11: Africa Energy Drinks Market Revenue billion Forecast, by Packaging Type 2020 & 2033
- Table 12: Africa Energy Drinks Market Volume K Tons Forecast, by Packaging Type 2020 & 2033
- Table 13: Africa Energy Drinks Market Revenue billion Forecast, by Distribution Channel 2020 & 2033
- Table 14: Africa Energy Drinks Market Volume K Tons Forecast, by Distribution Channel 2020 & 2033
- Table 15: Africa Energy Drinks Market Revenue billion Forecast, by Country 2020 & 2033
- Table 16: Africa Energy Drinks Market Volume K Tons Forecast, by Country 2020 & 2033
- Table 17: Nigeria Africa Energy Drinks Market Revenue (billion) Forecast, by Application 2020 & 2033
- Table 18: Nigeria Africa Energy Drinks Market Volume (K Tons) Forecast, by Application 2020 & 2033
- Table 19: South Africa Africa Energy Drinks Market Revenue (billion) Forecast, by Application 2020 & 2033
- Table 20: South Africa Africa Energy Drinks Market Volume (K Tons) Forecast, by Application 2020 & 2033
- Table 21: Egypt Africa Energy Drinks Market Revenue (billion) Forecast, by Application 2020 & 2033
- Table 22: Egypt Africa Energy Drinks Market Volume (K Tons) Forecast, by Application 2020 & 2033
- Table 23: Kenya Africa Energy Drinks Market Revenue (billion) Forecast, by Application 2020 & 2033
- Table 24: Kenya Africa Energy Drinks Market Volume (K Tons) Forecast, by Application 2020 & 2033
- Table 25: Ethiopia Africa Energy Drinks Market Revenue (billion) Forecast, by Application 2020 & 2033
- Table 26: Ethiopia Africa Energy Drinks Market Volume (K Tons) Forecast, by Application 2020 & 2033
- Table 27: Morocco Africa Energy Drinks Market Revenue (billion) Forecast, by Application 2020 & 2033
- Table 28: Morocco Africa Energy Drinks Market Volume (K Tons) Forecast, by Application 2020 & 2033
- Table 29: Ghana Africa Energy Drinks Market Revenue (billion) Forecast, by Application 2020 & 2033
- Table 30: Ghana Africa Energy Drinks Market Volume (K Tons) Forecast, by Application 2020 & 2033
- Table 31: Algeria Africa Energy Drinks Market Revenue (billion) Forecast, by Application 2020 & 2033
- Table 32: Algeria Africa Energy Drinks Market Volume (K Tons) Forecast, by Application 2020 & 2033
- Table 33: Tanzania Africa Energy Drinks Market Revenue (billion) Forecast, by Application 2020 & 2033
- Table 34: Tanzania Africa Energy Drinks Market Volume (K Tons) Forecast, by Application 2020 & 2033
- Table 35: Ivory Coast Africa Energy Drinks Market Revenue (billion) Forecast, by Application 2020 & 2033
- Table 36: Ivory Coast Africa Energy Drinks Market Volume (K Tons) Forecast, by Application 2020 & 2033
Frequently Asked Questions
1. What is the projected Compound Annual Growth Rate (CAGR) of the Africa Energy Drinks Market?
The projected CAGR is approximately 10.19%.
2. Which companies are prominent players in the Africa Energy Drinks Market?
Key companies in the market include Mutalo Group sp z o o, Aje Group, Tiger Brands Ltd, The Alternative Power (Pty) Ltd, Monster Beverage Corporation, PepsiCo Inc, Mofaya Beverage Company (PTY) Ltd, S Spitz GmbH, Suntory Holdings Limited, Red Bull GmbH, Halewood International South Africa (Pty) Ltd, The Coca-Cola Company.
3. What are the main segments of the Africa Energy Drinks Market?
The market segments include Soft Drink Type, Packaging Type, Distribution Channel.
4. Can you provide details about the market size?
The market size is estimated to be USD 3.65 billion as of 2022.
5. What are some drivers contributing to market growth?
Increasing Demand for Protein-Rich Food; Increasing Demand for Plant-Based and Organic Ingredients.
6. What are the notable trends driving market growth?
OTHER KEY INDUSTRY TRENDS COVERED IN THE REPORT.
7. Are there any restraints impacting market growth?
Presence of Counterfeit Products.
8. Can you provide examples of recent developments in the market?
October 2023: Miss South Africa Natasha Joubert has expanded her business venture by collaborating with the MoFaya energy drink business. Joubert has launched the Berry Queen-flavoured energy drink under the MoFaya energy drink brand.October 2023: Switch Energy Drink introduced 3 new flavors in the African region. The three new limited-edition flavors are Sour Worms, Naartjie & Grape, and Kiwi, Mango & Strawberry.September 2023: Switch Energy Drink launched a special limited-edition flavor in celebration of South African Heritage Day. As a brand deeply rooted in the South African spirit, Switch Energy Drink is excited to contribute to the festivities with this special edition.
9. What pricing options are available for accessing the report?
Pricing options include single-user, multi-user, and enterprise licenses priced at USD 3800, USD 4500, and USD 5800 respectively.
10. Is the market size provided in terms of value or volume?
The market size is provided in terms of value, measured in billion and volume, measured in K Tons.
11. Are there any specific market keywords associated with the report?
Yes, the market keyword associated with the report is "Africa Energy Drinks Market," which aids in identifying and referencing the specific market segment covered.
12. How do I determine which pricing option suits my needs best?
The pricing options vary based on user requirements and access needs. Individual users may opt for single-user licenses, while businesses requiring broader access may choose multi-user or enterprise licenses for cost-effective access to the report.
13. Are there any additional resources or data provided in the Africa Energy Drinks Market report?
While the report offers comprehensive insights, it's advisable to review the specific contents or supplementary materials provided to ascertain if additional resources or data are available.
14. How can I stay updated on further developments or reports in the Africa Energy Drinks Market?
To stay informed about further developments, trends, and reports in the Africa Energy Drinks Market, consider subscribing to industry newsletters, following relevant companies and organizations, or regularly checking reputable industry news sources and publications.
Methodology
Step 1 - Identification of Relevant Samples Size from Population Database


Step 2 - Approaches for Defining Global Market Size (Value, Volume* & Price*)

Note*: In applicable scenarios
Step 3 - Data Sources
Primary Research
- Web Analytics
- Survey Reports
- Research Institute
- Latest Research Reports
- Opinion Leaders
Secondary Research
- Annual Reports
- White Paper
- Latest Press Release
- Industry Association
- Paid Database
- Investor Presentations

Step 4 - Data Triangulation
Involves using different sources of information in order to increase the validity of a study
These sources are likely to be stakeholders in a program - participants, other researchers, program staff, other community members, and so on.
Then we put all data in single framework & apply various statistical tools to find out the dynamic on the market.
During the analysis stage, feedback from the stakeholder groups would be compared to determine areas of agreement as well as areas of divergence