

Key Insights
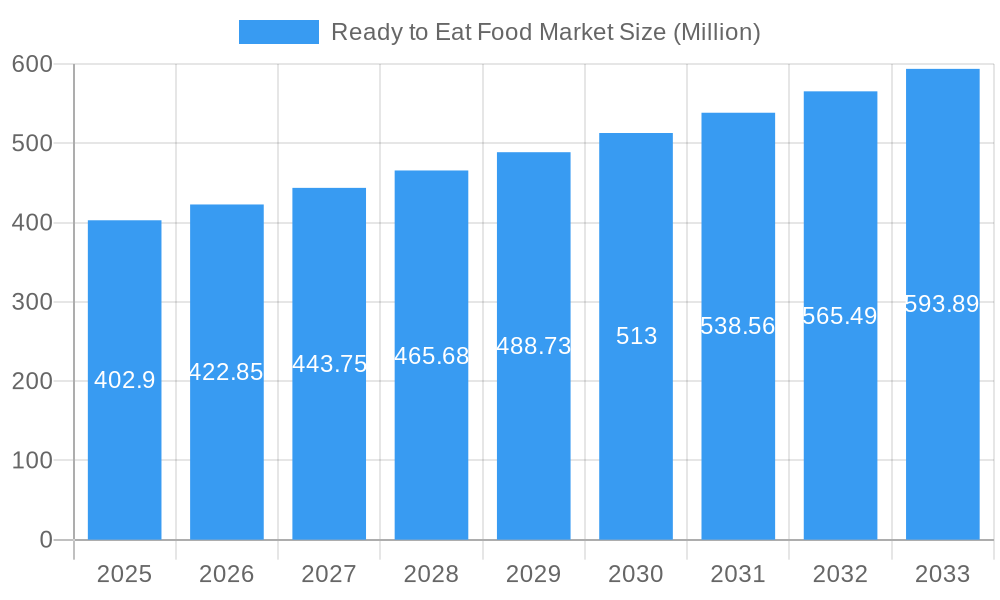
The global Ready to Eat (RTE) food market is experiencing robust growth, projected to reach $402.90 million by 2025, with an anticipated Compound Annual Growth Rate (CAGR) of 4.94% during the forecast period of 2025-2033. This expansion is fueled by a confluence of evolving consumer lifestyles, increasing disposable incomes, and a growing demand for convenience without compromising on taste or quality. Key drivers include the escalating urbanization, a surge in dual-income households, and the persistent need for quick meal solutions among busy professionals and students. Furthermore, advancements in food processing and packaging technologies are enhancing shelf life and product diversity, making RTE options more appealing and accessible. The market is witnessing a strong trend towards healthier RTE options, with a growing emphasis on natural ingredients, reduced preservatives, and a wider variety of dietary offerings such as gluten-free and vegan choices. This shift reflects a heightened consumer awareness regarding health and wellness, pushing manufacturers to innovate and cater to these evolving preferences.
Ready to Eat Food Market Market Size (In Million)
The RTE food market encompasses a diverse range of segments, with Instant Breakfast/Cereals and Ready Meals demonstrating significant traction. Distribution channels are also diversifying, with online retail stores rapidly gaining prominence alongside traditional hypermarkets/supermarkets and convenience stores. Geographically, North America and Europe currently lead the market, driven by established RTE food cultures and high consumer spending power. However, the Asia Pacific region is poised for substantial growth, owing to its large population, rapid economic development, and increasing adoption of Western dietary habits. Despite the positive outlook, the market faces certain restraints, including potential consumer concerns regarding the nutritional value and perceived artificiality of some RTE products. Intense competition among major players and the fluctuating prices of raw materials also present challenges. Nonetheless, the overall trajectory for the RTE food market remains exceptionally positive, driven by innovation, convenience, and a growing global appetite for easy-to-prepare and satisfying meals.
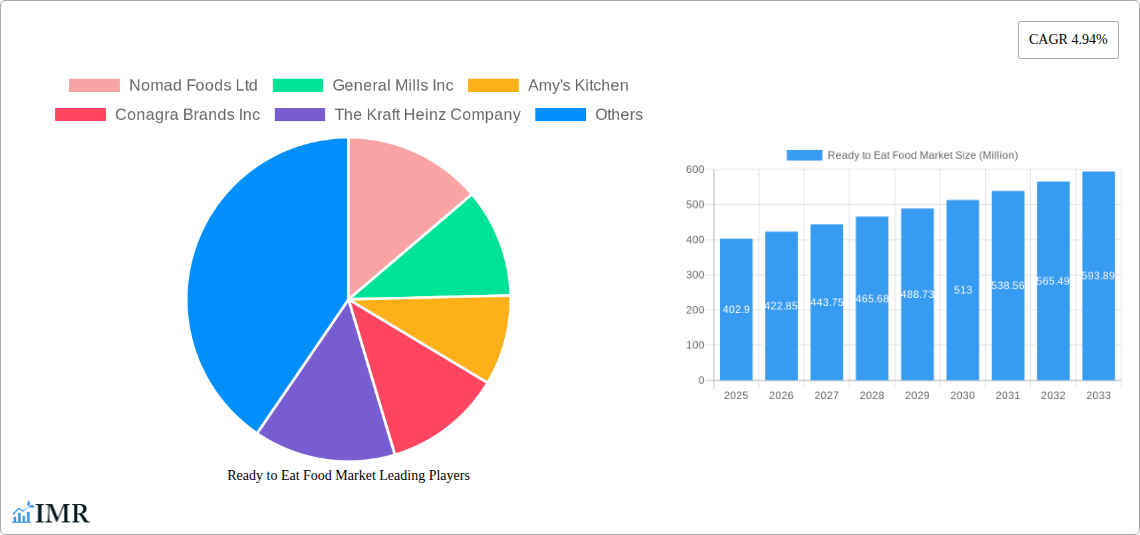
Ready to Eat Food Market Company Market Share
This report offers an in-depth analysis of the global Ready to Eat (RTE) food market, covering its dynamics, growth trends, regional dominance, product landscape, key players, and future outlook. With a focus on the period from 2019 to 2033, this comprehensive study provides actionable insights for industry professionals, investors, and stakeholders seeking to navigate the evolving RTE food sector. The analysis incorporates high-traffic keywords such as "convenience foods," "prepared meals," "instant meals," "frozen foods," "meal kits," "healthy ready meals," "vegan ready meals," and "online food delivery," ensuring maximum search engine visibility. All quantitative values are presented in Million units.
Ready to Eat Food Market Dynamics & Structure
The Ready to Eat food market is characterized by a moderate to high market concentration, with a few key global players holding significant market share, alongside a growing number of regional and niche manufacturers. Technological innovation is a primary driver, propelled by advancements in food processing, preservation techniques, and packaging that enhance shelf-life and maintain product quality. Regulatory frameworks, particularly concerning food safety, labeling, and ingredient transparency, play a crucial role in shaping market entry and product development. Competitive product substitutes, ranging from fresh ingredients requiring minimal preparation to other forms of processed foods, present ongoing challenges and opportunities for innovation. End-user demographics are increasingly driven by urbanization, busy lifestyles, and a growing demand for convenient and healthy meal solutions, particularly among millennials and Gen Z. Mergers and acquisitions (M&A) trends are active, with companies seeking to expand their product portfolios, geographical reach, and technological capabilities. For instance, the McCain Foods acquisition of Scelta Products highlights a strategic move to bolster presence in the frozen appetizer segment.
- Market Concentration: Dominated by multinational corporations with diversified product lines, but with increasing fragmentation in specific niche segments.
- Technological Innovation: Focus on extended shelf-life, improved nutritional profiles, sustainable packaging, and smart food technologies.
- Regulatory Frameworks: Stringent regulations on food safety (e.g., HACCP), labeling accuracy, and allergen management are paramount.
- Competitive Product Substitutes: Freshly prepared meals, home-cooked meals, and other convenience food options.
- End-User Demographics: Growing demand from young professionals, dual-income households, and individuals seeking quick, healthy, and diverse meal options.
- M&A Trends: Strategic acquisitions to gain market share, acquire innovative technologies, and expand into emerging markets.
Ready to Eat Food Market Growth Trends & Insights
The Ready to Eat food market is experiencing robust growth, driven by increasing consumer demand for convenience, evolving lifestyles, and a widening array of product offerings. The market size has seen a consistent upward trajectory, projected to reach USD XXXX million by 2025, with a Compound Annual Growth Rate (CAGR) of XX% from 2019 to 2033. Adoption rates for various RTE food categories are on the rise, fueled by the convenience factor and the perception of improved health and nutritional content in many modern RTE products. Technological disruptions, such as advances in flash-freezing, retort packaging, and HPP (High-Pressure Processing), are enabling longer shelf-lives and better preservation of nutrients, thereby enhancing consumer trust and product appeal. Consumer behavior shifts are evident, with a growing preference for health-conscious RTE options, including plant-based, low-sodium, and gluten-free alternatives. The rise of online retail stores and food delivery platforms has significantly accelerated market penetration, providing consumers with unparalleled access to a diverse range of RTE meals. General Mills Inc.'s launch of prepared meal kits under brands like Betty Crocker and Old El Paso exemplifies this trend, catering to the desire for simple, homemade dishes with minimal preparation time.
- Market Size Evolution: Consistent historical growth and strong future projections, driven by expanding consumer base and product innovation.
- Adoption Rates: Increasing uptake of RTE products across all demographics, particularly among time-pressed urban populations.
- Technological Disruptions: Innovations in preservation, packaging, and processing technologies are key enablers of product quality and shelf-life.
- Consumer Behavior Shifts: Growing demand for healthy, sustainable, and diverse RTE options, including a surge in plant-based and specialized dietary choices.
- Online Retail Dominance: E-commerce channels and food delivery services are becoming primary conduits for RTE food consumption, enhancing accessibility and variety.
- Specific Metrics:
- Projected Market Size (2025): USD XXXX Million
- CAGR (2019-2033): XX%
- Market Penetration: Increasing across developed and emerging economies.
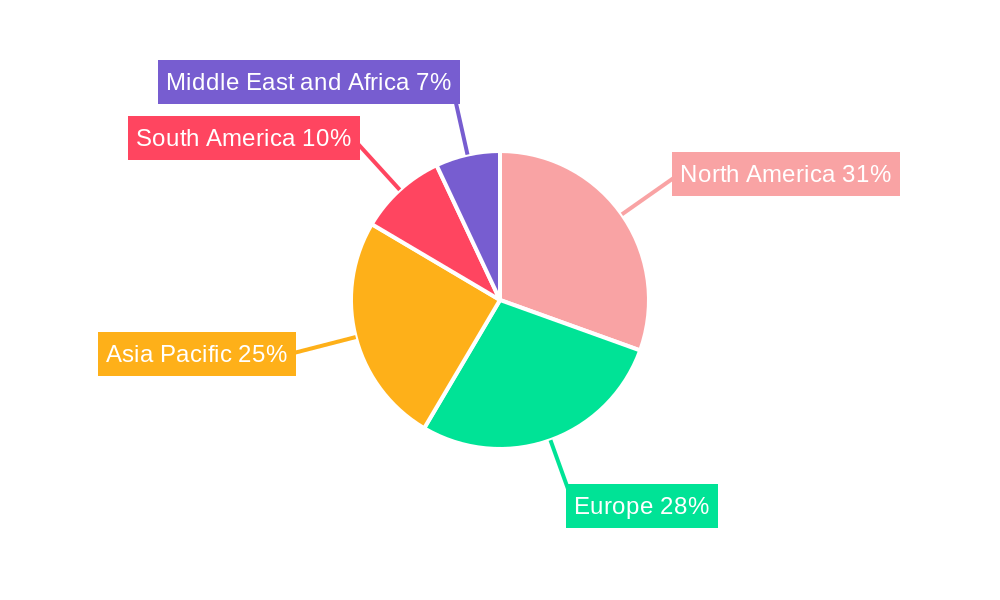
Dominant Regions, Countries, or Segments in Ready to Eat Food Market
The Ready Meals segment stands out as a dominant force within the broader RTE food market, driven by escalating consumer demand for complete and satisfying meal solutions that require minimal preparation. Within this segment, North America consistently emerges as a leading region, owing to its established infrastructure for convenience food consumption, high disposable incomes, and a strong preference for time-saving solutions. The United States, in particular, is a powerhouse, with a large and diverse consumer base actively seeking a variety of RTE options.
Dominant Segment: Ready Meals
- Key Drivers: Increasing urbanization, dual-income households, busy professional lifestyles, and a growing appreciation for culinary diversity.
- Market Share: Holds a significant portion of the overall RTE market, projected to grow consistently.
- Growth Potential: High, with continuous innovation in healthy and ethnic RTE meal options.
Dominant Region: North America
- Key Drivers:
- Economic Policies: Favorable economic conditions and high disposable incomes support premium product purchases.
- Infrastructure: Well-developed retail and logistics networks facilitate efficient distribution of RTE products.
- Consumer Lifestyle: A fast-paced lifestyle and a strong emphasis on convenience drive demand for RTE solutions.
- Awareness and Acceptance: High consumer awareness and acceptance of RTE foods due to prolonged market presence.
- Market Share: Dominant market share in terms of sales revenue and consumption volume.
- Growth Potential: Steady growth, fueled by ongoing product innovation and the expansion of online food delivery services.
- Key Drivers:
Key Countries within North America:
- United States: Largest market, driven by a vast consumer base and a culture of convenience.
- Canada: Significant market with a growing demand for health-conscious and diverse RTE options.
Dominant Distribution Channel: Hypermarkets/Supermarkets
- Key Drivers: Wide product availability, competitive pricing, and the ability to offer a broad spectrum of RTE options under one roof.
- Market Share: Continues to hold a substantial share, though online channels are rapidly gaining ground.
- Growth Potential: Remains strong due to established consumer shopping habits and promotional activities.
The Online Retail Stores distribution channel is experiencing the most rapid growth, reflecting changing consumer purchasing habits and the convenience of doorstep delivery. The increasing sophistication of e-commerce platforms and the proliferation of dedicated food delivery apps are accelerating this trend. Nestlé's Freshly brand, with its fully vegan meal line, exemplifies the success of direct-to-consumer online models, offering chef-prepared meals that are ready in minutes.
Ready to Eat Food Market Product Landscape
The Ready to Eat food market is witnessing a surge in product innovation, with a strong emphasis on health and wellness, diverse culinary experiences, and sustainable packaging. Innovations span across various product types, including instant breakfast cereals with enhanced nutritional profiles, ready meals featuring global cuisines and catering to specific dietary needs like veganism and gluten-free. For example, Nestlé's Freshly brand has launched a fully vegan meal line, showcasing plant-based foods' nutritional benefits. Product performance metrics are increasingly evaluated based on shelf-life extension, nutrient retention, taste appeal, and convenience of preparation. Unique selling propositions often revolve around natural ingredients, minimal processing, and allergen-free formulations. Technological advancements in food processing and packaging are crucial, enabling the development of RTE products that are both convenient and nutritionally superior, appealing to the modern health-conscious consumer.
Key Drivers, Barriers & Challenges in Ready to Eat Food Market
The Ready to Eat food market is propelled by several key drivers, including the persistent demand for convenience stemming from increasingly busy lifestyles, a growing global population, and rising disposable incomes. Technological advancements in food preservation, such as retort packaging and advanced freezing techniques, are crucial enablers, extending shelf-life and maintaining product quality. Evolving consumer preferences towards healthier and more diverse meal options, including plant-based and international cuisines, also act as significant growth accelerators.
Conversely, the market faces barriers and challenges such as consumer concerns regarding the nutritional content and perceived unhealthiness of some RTE products. Stringent food safety regulations and compliance costs can pose hurdles for smaller manufacturers. Supply chain disruptions, as seen in recent global events, can impact ingredient availability and distribution efficiency. Intense competitive pressure from both established brands and emerging players necessitates continuous innovation and competitive pricing strategies.
Emerging Opportunities in Ready to Eat Food Market
Emerging opportunities within the Ready to Eat food market are primarily driven by evolving consumer preferences and technological advancements. The burgeoning demand for plant-based and vegan RTE meals presents a significant untapped market, catering to a growing segment of health-conscious and ethically-minded consumers. Innovations in personalized nutrition and functional foods within the RTE space offer avenues for niche product development. Furthermore, the expansion of direct-to-consumer (DTC) models and subscription services provides new channels for reaching a broader customer base and building brand loyalty. The development of sustainable and eco-friendly packaging solutions is also becoming a key differentiator, appealing to environmentally conscious consumers.
Growth Accelerators in the Ready to Eat Food Market Industry
Catalysts driving long-term growth in the Ready to Eat food industry are multifaceted. Technological breakthroughs in food science and processing, such as shelf-life extension technologies and nutrient fortification, are continually enhancing product quality and consumer appeal. Strategic partnerships and collaborations between food manufacturers, technology providers, and retailers are fostering innovation and expanding market reach. Market expansion into emerging economies, driven by urbanization and a growing middle class, represents a significant growth opportunity. Furthermore, innovative marketing and branding strategies that emphasize health, convenience, and taste are crucial in capturing consumer attention and driving sustained demand for RTE products.
Key Players Shaping the Ready to Eat Food Market Market
- Nestlé S A
- Nomad Foods Ltd
- General Mills Inc
- The Kraft Heinz Company
- Conagra Brands Inc
- McCain Foods Limited
- Campbell Soup Company
- Amy's Kitchen
- Premier Foods Group Limited
- Dr August Oetker Nahrungsmittel KG
Notable Milestones in Ready to Eat Food Market Sector
- September 2022: McCain Foods acquired Netherlands-based Scelta Products, strengthening its position in prepared frozen appetizers and adding innovation and capacity.
- August 2022: General Mills Inc. launched prepared meal kits under brands like Betty Crocker, Old El Paso, Pillsbury, and Annie's Organic, offering ready-to-eat options for simple homemade dishes.
- August 2021: Nestlé-owned Freshly launched its first fully vegan meal line, offering chef-prepared, plant-based meals ready in approximately three minutes.
In-Depth Ready to Eat Food Market Market Outlook
The future outlook for the Ready to Eat food market is exceptionally promising, underpinned by sustained growth accelerators. The increasing adoption of e-commerce and food delivery platforms will continue to democratize access to a diverse range of RTE options, driving market penetration. Strategic initiatives focusing on health and wellness, including plant-based and functional food offerings, will resonate strongly with evolving consumer demands. Furthermore, investments in sustainable packaging and ethical sourcing are poised to become key differentiators. The market's ability to adapt to evolving dietary trends and leverage technological advancements in food preservation and personalization will be critical for capitalizing on future growth potential and maintaining competitive advantage.
Ready to Eat Food Market Segmentation
-
1. Product Type
- 1.1. Instant Breakfast/Cereals
- 1.2. Instant Soups and Snacks
- 1.3. Ready Meals
- 1.4. Baked Goods
- 1.5. Meat Products
- 1.6. Other Product Types
-
2. Distribution Channel
- 2.1. Hypermarkets/Supermarkets
- 2.2. Convenience Stores
- 2.3. Online Retail Stores
- 2.4. Other Distribution Channels
Ready to Eat Food Market Segmentation By Geography
-
1. North America
- 1.1. United States
- 1.2. Canada
- 1.3. Mexico
- 1.4. Rest of North America
-
2. Europe
- 2.1. Spain
- 2.2. United Kingdom
- 2.3. Germany
- 2.4. France
- 2.5. Italy
- 2.6. Russia
- 2.7. Rest of Europe
-
3. Asia Pacific
- 3.1. China
- 3.2. Japan
- 3.3. India
- 3.4. Australia
- 3.5. Rest of Asia Pacific
-
4. South America
- 4.1. Brazil
- 4.2. Argentina
- 4.3. Rest of South America
-
5. Middle East and Africa
- 5.1. South Africa
- 5.2. Saudi Arabia
- 5.3. Rest of Middle East and Africa
Ready to Eat Food Market Regional Market Share
Geographic Coverage of Ready to Eat Food Market
Ready to Eat Food Market REPORT HIGHLIGHTS
| Aspects | Details |
|---|---|
| Study Period | 2020-2034 |
| Base Year | 2025 |
| Estimated Year | 2026 |
| Forecast Period | 2026-2034 |
| Historical Period | 2020-2025 |
| Growth Rate | CAGR of 4.94% from 2020-2034 |
| Segmentation |
|
Table of Contents
- 1. Introduction
- 1.1. Research Scope
- 1.2. Market Segmentation
- 1.3. Research Objective
- 1.4. Definitions and Assumptions
- 2. Executive Summary
- 2.1. Market Snapshot
- 3. Market Dynamics
- 3.1. Market Drivers
- 3.2. Market Restrains
- 3.3. Market Trends
- 3.4. Market Opportunities
- 4. Market Factor Analysis
- 4.1. Porters Five Forces
- 4.1.1. Bargaining Power of Suppliers
- 4.1.2. Bargaining Power of Buyers
- 4.1.3. Threat of New Entrants
- 4.1.4. Threat of Substitutes
- 4.1.5. Competitive Rivalry
- 4.2. PESTEL analysis
- 4.3. BCG Analysis
- 4.3.1. Stars (High Growth, High Market Share)
- 4.3.2. Cash Cows (Low Growth, High Market Share)
- 4.3.3. Question Mark (High Growth, Low Market Share)
- 4.3.4. Dogs (Low Growth, Low Market Share)
- 4.4. Ansoff Matrix Analysis
- 4.5. Supply Chain Analysis
- 4.6. Regulatory Landscape
- 4.7. Current Market Potential and Opportunity Assessment (TAM–SAM–SOM Framework)
- 4.8. IMR Analyst Note
- 4.1. Porters Five Forces
- 5. Market Analysis, Insights and Forecast 2021-2033
- 5.1. Market Analysis, Insights and Forecast - by Product Type
- 5.1.1. Instant Breakfast/Cereals
- 5.1.2. Instant Soups and Snacks
- 5.1.3. Ready Meals
- 5.1.4. Baked Goods
- 5.1.5. Meat Products
- 5.1.6. Other Product Types
- 5.2. Market Analysis, Insights and Forecast - by Distribution Channel
- 5.2.1. Hypermarkets/Supermarkets
- 5.2.2. Convenience Stores
- 5.2.3. Online Retail Stores
- 5.2.4. Other Distribution Channels
- 5.3. Market Analysis, Insights and Forecast - by Region
- 5.3.1. North America
- 5.3.2. Europe
- 5.3.3. Asia Pacific
- 5.3.4. South America
- 5.3.5. Middle East and Africa
- 5.1. Market Analysis, Insights and Forecast - by Product Type
- 6. Global Ready to Eat Food Market Analysis, Insights and Forecast, 2021-2033
- 6.1. Market Analysis, Insights and Forecast - by Product Type
- 6.1.1. Instant Breakfast/Cereals
- 6.1.2. Instant Soups and Snacks
- 6.1.3. Ready Meals
- 6.1.4. Baked Goods
- 6.1.5. Meat Products
- 6.1.6. Other Product Types
- 6.2. Market Analysis, Insights and Forecast - by Distribution Channel
- 6.2.1. Hypermarkets/Supermarkets
- 6.2.2. Convenience Stores
- 6.2.3. Online Retail Stores
- 6.2.4. Other Distribution Channels
- 6.1. Market Analysis, Insights and Forecast - by Product Type
- 7. North America Ready to Eat Food Market Analysis, Insights and Forecast, 2020-2032
- 7.1. Market Analysis, Insights and Forecast - by Product Type
- 7.1.1. Instant Breakfast/Cereals
- 7.1.2. Instant Soups and Snacks
- 7.1.3. Ready Meals
- 7.1.4. Baked Goods
- 7.1.5. Meat Products
- 7.1.6. Other Product Types
- 7.2. Market Analysis, Insights and Forecast - by Distribution Channel
- 7.2.1. Hypermarkets/Supermarkets
- 7.2.2. Convenience Stores
- 7.2.3. Online Retail Stores
- 7.2.4. Other Distribution Channels
- 7.1. Market Analysis, Insights and Forecast - by Product Type
- 8. Europe Ready to Eat Food Market Analysis, Insights and Forecast, 2020-2032
- 8.1. Market Analysis, Insights and Forecast - by Product Type
- 8.1.1. Instant Breakfast/Cereals
- 8.1.2. Instant Soups and Snacks
- 8.1.3. Ready Meals
- 8.1.4. Baked Goods
- 8.1.5. Meat Products
- 8.1.6. Other Product Types
- 8.2. Market Analysis, Insights and Forecast - by Distribution Channel
- 8.2.1. Hypermarkets/Supermarkets
- 8.2.2. Convenience Stores
- 8.2.3. Online Retail Stores
- 8.2.4. Other Distribution Channels
- 8.1. Market Analysis, Insights and Forecast - by Product Type
- 9. Asia Pacific Ready to Eat Food Market Analysis, Insights and Forecast, 2020-2032
- 9.1. Market Analysis, Insights and Forecast - by Product Type
- 9.1.1. Instant Breakfast/Cereals
- 9.1.2. Instant Soups and Snacks
- 9.1.3. Ready Meals
- 9.1.4. Baked Goods
- 9.1.5. Meat Products
- 9.1.6. Other Product Types
- 9.2. Market Analysis, Insights and Forecast - by Distribution Channel
- 9.2.1. Hypermarkets/Supermarkets
- 9.2.2. Convenience Stores
- 9.2.3. Online Retail Stores
- 9.2.4. Other Distribution Channels
- 9.1. Market Analysis, Insights and Forecast - by Product Type
- 10. South America Ready to Eat Food Market Analysis, Insights and Forecast, 2020-2032
- 10.1. Market Analysis, Insights and Forecast - by Product Type
- 10.1.1. Instant Breakfast/Cereals
- 10.1.2. Instant Soups and Snacks
- 10.1.3. Ready Meals
- 10.1.4. Baked Goods
- 10.1.5. Meat Products
- 10.1.6. Other Product Types
- 10.2. Market Analysis, Insights and Forecast - by Distribution Channel
- 10.2.1. Hypermarkets/Supermarkets
- 10.2.2. Convenience Stores
- 10.2.3. Online Retail Stores
- 10.2.4. Other Distribution Channels
- 10.1. Market Analysis, Insights and Forecast - by Product Type
- 11. Middle East and Africa Ready to Eat Food Market Analysis, Insights and Forecast, 2020-2032
- 11.1. Market Analysis, Insights and Forecast - by Product Type
- 11.1.1. Instant Breakfast/Cereals
- 11.1.2. Instant Soups and Snacks
- 11.1.3. Ready Meals
- 11.1.4. Baked Goods
- 11.1.5. Meat Products
- 11.1.6. Other Product Types
- 11.2. Market Analysis, Insights and Forecast - by Distribution Channel
- 11.2.1. Hypermarkets/Supermarkets
- 11.2.2. Convenience Stores
- 11.2.3. Online Retail Stores
- 11.2.4. Other Distribution Channels
- 11.1. Market Analysis, Insights and Forecast - by Product Type
- 12. Competitive Analysis
- 12.1. Company Profiles
- 12.1.1 Nomad Foods Ltd
- 12.1.1.1. Company Overview
- 12.1.1.2. Products
- 12.1.1.3. Company Financials
- 12.1.1.4. SWOT Analysis
- 12.1.2 General Mills Inc
- 12.1.2.1. Company Overview
- 12.1.2.2. Products
- 12.1.2.3. Company Financials
- 12.1.2.4. SWOT Analysis
- 12.1.3 Amy's Kitchen
- 12.1.3.1. Company Overview
- 12.1.3.2. Products
- 12.1.3.3. Company Financials
- 12.1.3.4. SWOT Analysis
- 12.1.4 Conagra Brands Inc
- 12.1.4.1. Company Overview
- 12.1.4.2. Products
- 12.1.4.3. Company Financials
- 12.1.4.4. SWOT Analysis
- 12.1.5 The Kraft Heinz Company
- 12.1.5.1. Company Overview
- 12.1.5.2. Products
- 12.1.5.3. Company Financials
- 12.1.5.4. SWOT Analysis
- 12.1.6 McCain Foods Limited
- 12.1.6.1. Company Overview
- 12.1.6.2. Products
- 12.1.6.3. Company Financials
- 12.1.6.4. SWOT Analysis
- 12.1.7 Campbell Soup Company
- 12.1.7.1. Company Overview
- 12.1.7.2. Products
- 12.1.7.3. Company Financials
- 12.1.7.4. SWOT Analysis
- 12.1.8 Premier Foods Group Limited
- 12.1.8.1. Company Overview
- 12.1.8.2. Products
- 12.1.8.3. Company Financials
- 12.1.8.4. SWOT Analysis
- 12.1.9 Dr August Oetker Nahrungsmittel KG
- 12.1.9.1. Company Overview
- 12.1.9.2. Products
- 12.1.9.3. Company Financials
- 12.1.9.4. SWOT Analysis
- 12.1.10 Nestlé S A
- 12.1.10.1. Company Overview
- 12.1.10.2. Products
- 12.1.10.3. Company Financials
- 12.1.10.4. SWOT Analysis
- 12.1.1 Nomad Foods Ltd
- 12.2. Market Entropy
- 12.2.1 Company's Key Areas Served
- 12.2.2 Recent Developments
- 12.3. Company Market Share Analysis 2025
- 12.3.1 Top 5 Companies Market Share Analysis
- 12.3.2 Top 3 Companies Market Share Analysis
- 12.4. List of Potential Customers
- 13. Research Methodology
List of Figures
- Figure 1: Global Ready to Eat Food Market Revenue Breakdown (Million, %) by Region 2025 & 2033
- Figure 2: North America Ready to Eat Food Market Revenue (Million), by Product Type 2025 & 2033
- Figure 3: North America Ready to Eat Food Market Revenue Share (%), by Product Type 2025 & 2033
- Figure 4: North America Ready to Eat Food Market Revenue (Million), by Distribution Channel 2025 & 2033
- Figure 5: North America Ready to Eat Food Market Revenue Share (%), by Distribution Channel 2025 & 2033
- Figure 6: North America Ready to Eat Food Market Revenue (Million), by Country 2025 & 2033
- Figure 7: North America Ready to Eat Food Market Revenue Share (%), by Country 2025 & 2033
- Figure 8: Europe Ready to Eat Food Market Revenue (Million), by Product Type 2025 & 2033
- Figure 9: Europe Ready to Eat Food Market Revenue Share (%), by Product Type 2025 & 2033
- Figure 10: Europe Ready to Eat Food Market Revenue (Million), by Distribution Channel 2025 & 2033
- Figure 11: Europe Ready to Eat Food Market Revenue Share (%), by Distribution Channel 2025 & 2033
- Figure 12: Europe Ready to Eat Food Market Revenue (Million), by Country 2025 & 2033
- Figure 13: Europe Ready to Eat Food Market Revenue Share (%), by Country 2025 & 2033
- Figure 14: Asia Pacific Ready to Eat Food Market Revenue (Million), by Product Type 2025 & 2033
- Figure 15: Asia Pacific Ready to Eat Food Market Revenue Share (%), by Product Type 2025 & 2033
- Figure 16: Asia Pacific Ready to Eat Food Market Revenue (Million), by Distribution Channel 2025 & 2033
- Figure 17: Asia Pacific Ready to Eat Food Market Revenue Share (%), by Distribution Channel 2025 & 2033
- Figure 18: Asia Pacific Ready to Eat Food Market Revenue (Million), by Country 2025 & 2033
- Figure 19: Asia Pacific Ready to Eat Food Market Revenue Share (%), by Country 2025 & 2033
- Figure 20: South America Ready to Eat Food Market Revenue (Million), by Product Type 2025 & 2033
- Figure 21: South America Ready to Eat Food Market Revenue Share (%), by Product Type 2025 & 2033
- Figure 22: South America Ready to Eat Food Market Revenue (Million), by Distribution Channel 2025 & 2033
- Figure 23: South America Ready to Eat Food Market Revenue Share (%), by Distribution Channel 2025 & 2033
- Figure 24: South America Ready to Eat Food Market Revenue (Million), by Country 2025 & 2033
- Figure 25: South America Ready to Eat Food Market Revenue Share (%), by Country 2025 & 2033
- Figure 26: Middle East and Africa Ready to Eat Food Market Revenue (Million), by Product Type 2025 & 2033
- Figure 27: Middle East and Africa Ready to Eat Food Market Revenue Share (%), by Product Type 2025 & 2033
- Figure 28: Middle East and Africa Ready to Eat Food Market Revenue (Million), by Distribution Channel 2025 & 2033
- Figure 29: Middle East and Africa Ready to Eat Food Market Revenue Share (%), by Distribution Channel 2025 & 2033
- Figure 30: Middle East and Africa Ready to Eat Food Market Revenue (Million), by Country 2025 & 2033
- Figure 31: Middle East and Africa Ready to Eat Food Market Revenue Share (%), by Country 2025 & 2033
List of Tables
- Table 1: Global Ready to Eat Food Market Revenue Million Forecast, by Product Type 2020 & 2033
- Table 2: Global Ready to Eat Food Market Revenue Million Forecast, by Distribution Channel 2020 & 2033
- Table 3: Global Ready to Eat Food Market Revenue Million Forecast, by Region 2020 & 2033
- Table 4: Global Ready to Eat Food Market Revenue Million Forecast, by Product Type 2020 & 2033
- Table 5: Global Ready to Eat Food Market Revenue Million Forecast, by Distribution Channel 2020 & 2033
- Table 6: Global Ready to Eat Food Market Revenue Million Forecast, by Country 2020 & 2033
- Table 7: United States Ready to Eat Food Market Revenue (Million) Forecast, by Application 2020 & 2033
- Table 8: Canada Ready to Eat Food Market Revenue (Million) Forecast, by Application 2020 & 2033
- Table 9: Mexico Ready to Eat Food Market Revenue (Million) Forecast, by Application 2020 & 2033
- Table 10: Rest of North America Ready to Eat Food Market Revenue (Million) Forecast, by Application 2020 & 2033
- Table 11: Global Ready to Eat Food Market Revenue Million Forecast, by Product Type 2020 & 2033
- Table 12: Global Ready to Eat Food Market Revenue Million Forecast, by Distribution Channel 2020 & 2033
- Table 13: Global Ready to Eat Food Market Revenue Million Forecast, by Country 2020 & 2033
- Table 14: Spain Ready to Eat Food Market Revenue (Million) Forecast, by Application 2020 & 2033
- Table 15: United Kingdom Ready to Eat Food Market Revenue (Million) Forecast, by Application 2020 & 2033
- Table 16: Germany Ready to Eat Food Market Revenue (Million) Forecast, by Application 2020 & 2033
- Table 17: France Ready to Eat Food Market Revenue (Million) Forecast, by Application 2020 & 2033
- Table 18: Italy Ready to Eat Food Market Revenue (Million) Forecast, by Application 2020 & 2033
- Table 19: Russia Ready to Eat Food Market Revenue (Million) Forecast, by Application 2020 & 2033
- Table 20: Rest of Europe Ready to Eat Food Market Revenue (Million) Forecast, by Application 2020 & 2033
- Table 21: Global Ready to Eat Food Market Revenue Million Forecast, by Product Type 2020 & 2033
- Table 22: Global Ready to Eat Food Market Revenue Million Forecast, by Distribution Channel 2020 & 2033
- Table 23: Global Ready to Eat Food Market Revenue Million Forecast, by Country 2020 & 2033
- Table 24: China Ready to Eat Food Market Revenue (Million) Forecast, by Application 2020 & 2033
- Table 25: Japan Ready to Eat Food Market Revenue (Million) Forecast, by Application 2020 & 2033
- Table 26: India Ready to Eat Food Market Revenue (Million) Forecast, by Application 2020 & 2033
- Table 27: Australia Ready to Eat Food Market Revenue (Million) Forecast, by Application 2020 & 2033
- Table 28: Rest of Asia Pacific Ready to Eat Food Market Revenue (Million) Forecast, by Application 2020 & 2033
- Table 29: Global Ready to Eat Food Market Revenue Million Forecast, by Product Type 2020 & 2033
- Table 30: Global Ready to Eat Food Market Revenue Million Forecast, by Distribution Channel 2020 & 2033
- Table 31: Global Ready to Eat Food Market Revenue Million Forecast, by Country 2020 & 2033
- Table 32: Brazil Ready to Eat Food Market Revenue (Million) Forecast, by Application 2020 & 2033
- Table 33: Argentina Ready to Eat Food Market Revenue (Million) Forecast, by Application 2020 & 2033
- Table 34: Rest of South America Ready to Eat Food Market Revenue (Million) Forecast, by Application 2020 & 2033
- Table 35: Global Ready to Eat Food Market Revenue Million Forecast, by Product Type 2020 & 2033
- Table 36: Global Ready to Eat Food Market Revenue Million Forecast, by Distribution Channel 2020 & 2033
- Table 37: Global Ready to Eat Food Market Revenue Million Forecast, by Country 2020 & 2033
- Table 38: South Africa Ready to Eat Food Market Revenue (Million) Forecast, by Application 2020 & 2033
- Table 39: Saudi Arabia Ready to Eat Food Market Revenue (Million) Forecast, by Application 2020 & 2033
- Table 40: Rest of Middle East and Africa Ready to Eat Food Market Revenue (Million) Forecast, by Application 2020 & 2033
Frequently Asked Questions
1. What is the projected Compound Annual Growth Rate (CAGR) of the Ready to Eat Food Market?
The projected CAGR is approximately 4.94%.
2. Which companies are prominent players in the Ready to Eat Food Market?
Key companies in the market include Nomad Foods Ltd, General Mills Inc, Amy's Kitchen, Conagra Brands Inc, The Kraft Heinz Company, McCain Foods Limited, Campbell Soup Company, Premier Foods Group Limited, Dr August Oetker Nahrungsmittel KG, Nestlé S A.
3. What are the main segments of the Ready to Eat Food Market?
The market segments include Product Type, Distribution Channel.
4. Can you provide details about the market size?
The market size is estimated to be USD 402.90 Million as of 2022.
5. What are some drivers contributing to market growth?
The numerous benefits offered by collagen in the food and beverage industry.
6. What are the notable trends driving market growth?
Surge in Demand for Convenient and Healthy Instant Food.
7. Are there any restraints impacting market growth?
Increasing vegan population in the region.
8. Can you provide examples of recent developments in the market?
In September 2022, McCain Foods acquired Netherlands-based Scelta Products. This acquisition will strengthen the position of the company in prepared frozen appetizers and will add innovation and capacity to frozen appetizers. Nomad Foods Ltd
9. What pricing options are available for accessing the report?
Pricing options include single-user, multi-user, and enterprise licenses priced at USD 4750, USD 5250, and USD 8750 respectively.
10. Is the market size provided in terms of value or volume?
The market size is provided in terms of value, measured in Million.
11. Are there any specific market keywords associated with the report?
Yes, the market keyword associated with the report is "Ready to Eat Food Market," which aids in identifying and referencing the specific market segment covered.
12. How do I determine which pricing option suits my needs best?
The pricing options vary based on user requirements and access needs. Individual users may opt for single-user licenses, while businesses requiring broader access may choose multi-user or enterprise licenses for cost-effective access to the report.
13. Are there any additional resources or data provided in the Ready to Eat Food Market report?
While the report offers comprehensive insights, it's advisable to review the specific contents or supplementary materials provided to ascertain if additional resources or data are available.
14. How can I stay updated on further developments or reports in the Ready to Eat Food Market?
To stay informed about further developments, trends, and reports in the Ready to Eat Food Market, consider subscribing to industry newsletters, following relevant companies and organizations, or regularly checking reputable industry news sources and publications.
Methodology
Step 1 - Identification of Relevant Samples Size from Population Database


Step 2 - Approaches for Defining Global Market Size (Value, Volume* & Price*)

Note*: In applicable scenarios
Step 3 - Data Sources
Primary Research
- Web Analytics
- Survey Reports
- Research Institute
- Latest Research Reports
- Opinion Leaders
Secondary Research
- Annual Reports
- White Paper
- Latest Press Release
- Industry Association
- Paid Database
- Investor Presentations

Step 4 - Data Triangulation
Involves using different sources of information in order to increase the validity of a study
These sources are likely to be stakeholders in a program - participants, other researchers, program staff, other community members, and so on.
Then we put all data in single framework & apply various statistical tools to find out the dynamic on the market.
During the analysis stage, feedback from the stakeholder groups would be compared to determine areas of agreement as well as areas of divergence