

Key Insights
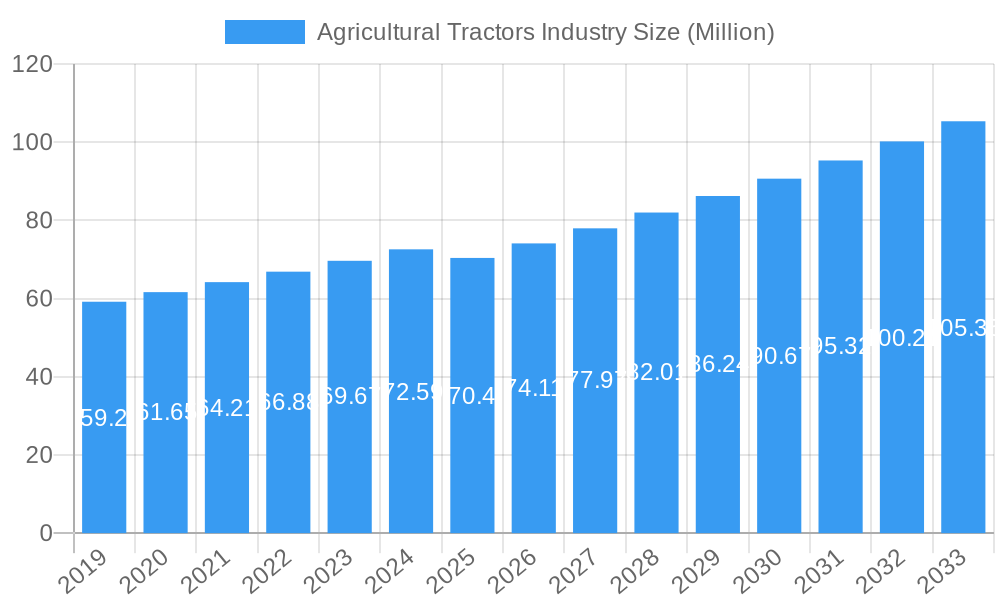
The global Agricultural Tractors market is poised for robust expansion, projected to reach a valuation of USD 70.40 billion by 2025. This growth trajectory is underpinned by a Compound Annual Growth Rate (CAGR) of 5.20% from 2025 to 2033, indicating sustained momentum in demand. A primary driver for this market is the increasing need for enhanced farm productivity and efficiency in the face of a growing global population and shrinking arable land. Mechanization through advanced agricultural tractors is critical to achieving higher yields and optimizing resource utilization. Furthermore, governmental initiatives promoting modern farming practices and providing subsidies for farm equipment adoption in various regions are significantly bolstering market growth. The demand for technologically advanced tractors, equipped with features like GPS guidance, precision farming capabilities, and automation, is on the rise as farmers seek to improve operational effectiveness and reduce labor costs.
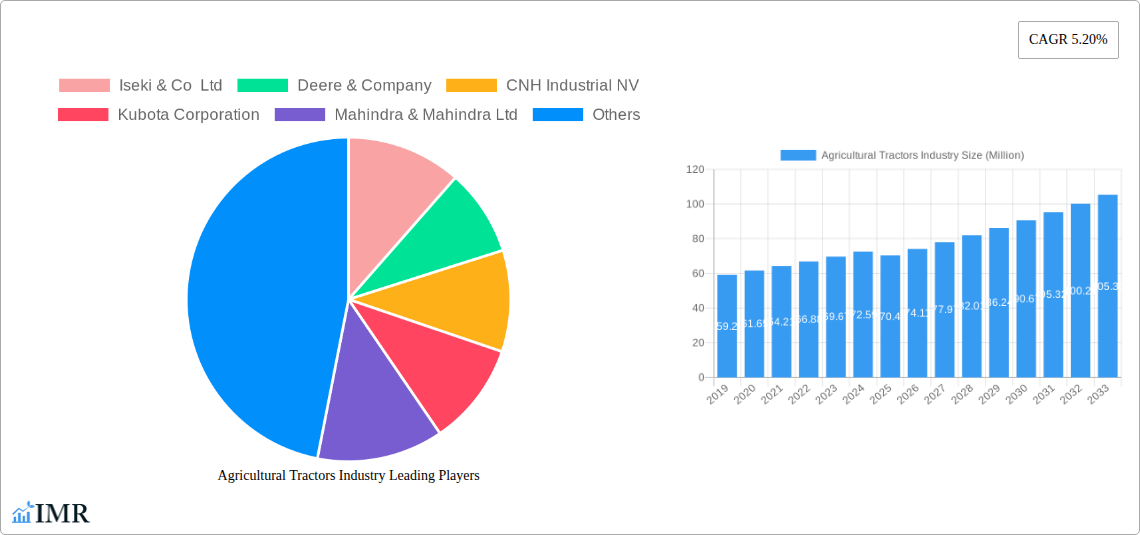
Agricultural Tractors Industry Market Size (In Million)
Key trends shaping the agricultural tractors market include a strong emphasis on the development and adoption of smart and connected farming technologies. This involves the integration of IoT sensors, data analytics, and artificial intelligence to enable predictive maintenance, optimized field operations, and better decision-making for farmers. The increasing preference for electric and hybrid tractors also represents a significant trend, driven by environmental concerns and the desire for lower operating costs. However, the market faces certain restraints, including the high initial cost of advanced agricultural machinery, which can be a barrier for smallholder farmers. Fluctuations in raw material prices and the availability of skilled labor for operation and maintenance can also present challenges. Despite these obstacles, the relentless pursuit of agricultural modernization and the ongoing innovation in tractor technology are expected to propel the market forward, creating substantial opportunities for key players across various regions.
Agricultural Tractors Industry Company Market Share
This in-depth report provides a panoramic view of the global Agricultural Tractors Industry, meticulously analyzing market dynamics, growth trends, and future opportunities from 2019 to 2033. With a Base Year of 2025 and a Forecast Period spanning 2025–2033, this analysis leverages historical data from 2019–2024 to deliver actionable insights for industry stakeholders. We dissect the parent and child market segments, offering a granular understanding of production, consumption, imports, exports, and pricing. This report is essential for manufacturers, suppliers, investors, and policymakers seeking to navigate the evolving landscape of farm equipment, tractor manufacturing, and precision agriculture technologies.
Agricultural Tractors Industry Market Dynamics & Structure
The Agricultural Tractors Industry exhibits a moderately concentrated market structure, with a few key players dominating global sales while a significant number of smaller manufacturers cater to regional demands. Technological innovation is a primary driver, fueled by advancements in engine efficiency, automation, and GPS-guided tractors. Regulatory frameworks, including emissions standards and government subsidies for mechanization, significantly influence market accessibility and product development. Competitive product substitutes, such as specialized farm machinery and advancements in older tractor refurbishment, pose a dynamic challenge. End-user demographics, primarily driven by the aging farmer population in developed economies and the growing need for efficient farming in emerging markets, shape product demand. Mergers & Acquisitions (M&A) trends indicate consolidation, with major players acquiring smaller innovators to expand their product portfolios and geographic reach. For instance, approximately 10-15 major M&A deals are observed annually, focusing on companies with expertise in electric tractors or autonomous farming solutions. Innovation barriers include high R&D costs for advanced features and the need for extensive field testing.
- Market Concentration: Dominated by a few global leaders, with regional players holding substantial market share in specific geographies.
- Technological Innovation Drivers: Focus on fuel efficiency, automation, connectivity, and reduced environmental impact.
- Regulatory Frameworks: Emissions standards (e.g., Tier 4, Stage V) and agricultural support policies are key influencers.
- Competitive Product Substitutes: While direct substitutes are limited, innovations in other farm machinery and alternative cultivation methods indirectly impact tractor demand.
- End-User Demographics: Influenced by farm size, crop type, and adoption of modern farming practices.
- M&A Trends: Strategic acquisitions aimed at expanding technological capabilities and market presence.
- Innovation Barriers: High capital investment for new technologies and the need for robust distribution and service networks.
Agricultural Tractors Industry Growth Trends & Insights
The Agricultural Tractors Industry is projected to witness robust growth driven by the increasing global demand for food, coupled with the imperative for enhanced agricultural productivity. The market size is expected to expand significantly, reaching an estimated value of USD 120,000 Million units by 2033, exhibiting a Compound Annual Growth Rate (CAGR) of approximately 4.5% from 2025. Adoption rates for technologically advanced tractors, including smart tractors and those equipped with telematics and precision farming capabilities, are on an upward trajectory, particularly in North America and Europe. Technological disruptions, such as the development of electric tractors and autonomous farming solutions, are poised to reshape the market in the long term, appealing to younger generations of farmers seeking sustainable and efficient operations. Consumer behavior shifts are characterized by a growing preference for fuel-efficient models, reduced operational costs, and features that enhance operator comfort and safety. The market penetration of advanced tractor technologies is estimated to grow by 15-20% annually in developed regions.
- Market Size Evolution: From an estimated USD 75,000 Million units in 2025, projected to reach USD 120,000 Million units by 2033.
- CAGR: Anticipated at 4.5% during the forecast period (2025-2033).
- Adoption Rates: Increasing adoption of autonomous tractors, electric tractors, and GPS-enabled tractors in developed markets.
- Technological Disruptions: Emergence of AI-powered farming assistance, drone integration, and advanced robotics.
- Consumer Behavior Shifts: Demand for eco-friendly solutions, connectivity for data-driven farming, and integrated farm management systems.
- Market Penetration: Accelerated growth in the adoption of smart farming equipment and connected tractor technology.
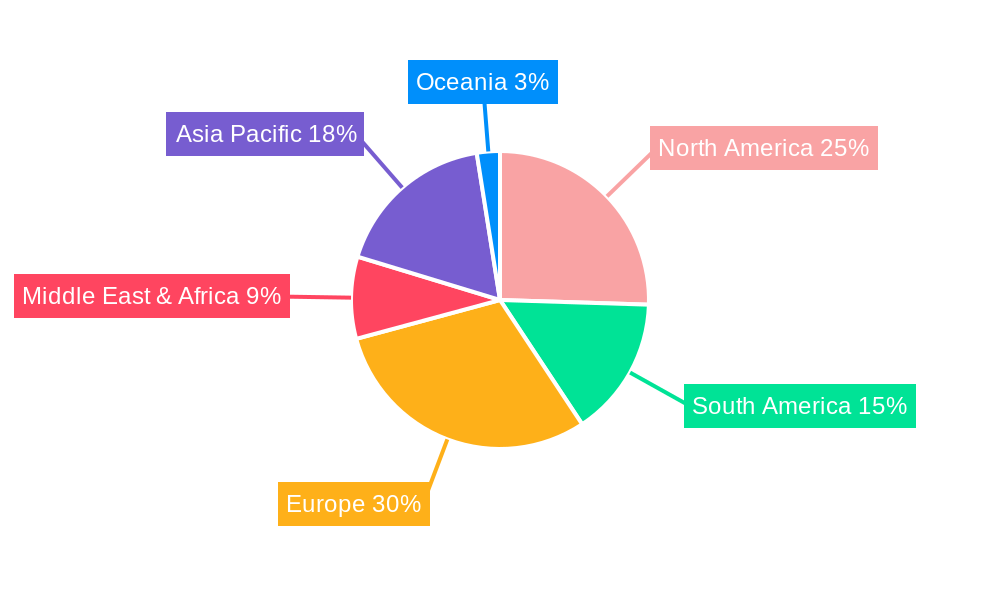
Dominant Regions, Countries, or Segments in Agricultural Tractors Industry
North America, particularly the United States, and Europe, led by countries like Germany and France, are the dominant regions in the Agricultural Tractors Industry due to their high levels of agricultural mechanization, advanced farming practices, and substantial government support for modern agriculture. In terms of Production Analysis, North America and Europe lead in the manufacturing of high-horsepower and technologically advanced tractors, with an estimated production volume of 350,000 Million units annually. Consumption Analysis is also highest in these regions, driven by large farm sizes and a consistent demand for efficient farm machinery, accounting for approximately 300,000 Million units annually. The Import Market Analysis reveals significant import volumes for specialized tractors and components in both regions, valued at over USD 15,000 Million units and USD 12,000 Million units respectively, with volumes around 75,000 Million units and 60,000 Million units. Export Market Analysis highlights North America and Europe as major exporters of advanced agricultural tractors globally, generating export revenues exceeding USD 20,000 Million units combined, with volumes around 100,000 Million units. The Price Trend Analysis indicates higher price points for premium and technologically advanced tractors in these regions, averaging USD 60,000-USD 90,000 per unit. Key drivers include robust economic policies promoting agricultural efficiency, advanced infrastructure supporting logistics and distribution, and a strong emphasis on precision agriculture.
Asia-Pacific, particularly India and China, represents the largest and fastest-growing child market in terms of volume, driven by a vast agricultural base and increasing government initiatives to boost farm productivity. Production volumes in Asia-Pacific are estimated at 550,000 Million units annually, with consumption reaching 500,000 Million units. However, the import market is smaller in value compared to the west, focusing on mid-range and smaller horsepower tractors, with imports valued at USD 4,000 Million units and volumes around 150,000 Million units. Exports from Asia-Pacific are substantial in volume, primarily to other developing nations, valued at USD 7,000 Million units with volumes of 250,000 Million units. Price trends are generally lower, with an average price range of USD 10,000-USD 25,000 per unit. Economic policies promoting farm mechanization, rapid infrastructure development, and a growing middle class demanding increased food production are critical growth factors.
- Dominant Regions: North America and Europe lead in high-value, technologically advanced tractors.
- Largest Child Market (Volume): Asia-Pacific, driven by India and China's extensive agricultural sectors.
- Production Analysis: North America & Europe (350,000 Million units), Asia-Pacific (550,000 Million units).
- Consumption Analysis: North America & Europe (300,000 Million units), Asia-Pacific (500,000 Million units).
- Import Market Analysis (Value & Volume): North America (USD 15,000 Million units, 75,000 Million units), Europe (USD 12,000 Million units, 60,000 Million units), Asia-Pacific (USD 4,000 Million units, 150,000 Million units).
- Export Market Analysis (Value & Volume): North America & Europe (USD 20,000+ Million units, 100,000 Million units), Asia-Pacific (USD 7,000 Million units, 250,000 Million units).
- Price Trend Analysis: Higher in North America & Europe (USD 60,000-USD 90,000), lower in Asia-Pacific (USD 10,000-USD 25,000).
Agricultural Tractors Industry Product Landscape
The Agricultural Tractors Industry product landscape is characterized by continuous innovation in power output, fuel efficiency, and technological integration. Key product innovations include the development of compact tractors for specialized applications and smaller farms, as well as high-horsepower articulated tractors for large-scale operations. Applications range from basic plowing and tilling to complex tasks like precision planting, spraying, and harvesting, often enhanced by GPS navigation systems and autosteer technology. Performance metrics are increasingly focused on fuel consumption reduction, reduced emissions (meeting stringent environmental regulations), enhanced operator comfort, and improved maneuverability. Unique selling propositions often revolve around advanced hydraulics, intelligent transmission systems, and integrated telematics for remote monitoring and diagnostics. Technological advancements are rapidly incorporating IoT capabilities for predictive maintenance and real-time data analysis, enabling farmers to optimize their operations for maximum yield and efficiency.
Key Drivers, Barriers & Challenges in Agricultural Tractors Industry
The Agricultural Tractors Industry is propelled by several key drivers, including the rising global demand for food, increasing need for agricultural mechanization in developing economies, and government initiatives promoting farm efficiency and modernization. Technological advancements in precision agriculture and the development of eco-friendly tractor solutions also act as significant growth catalysts.
- Key Drivers:
- Global population growth and increased food demand.
- Government support and subsidies for farm mechanization.
- Advancements in precision agriculture and smart farming technologies.
- Growing emphasis on sustainable and eco-friendly farming practices.
- Need for increased operational efficiency and reduced labor costs.
Key challenges and restraints in the Agricultural Tractors Industry include high initial investment costs for advanced machinery, fluctuating commodity prices impacting farmer spending, and the need for widespread rural infrastructure development to support advanced tractor technologies. Supply chain disruptions, such as semiconductor shortages and raw material price volatility, also pose significant challenges. Regulatory hurdles, including evolving emission standards and import/export tariffs, can impact production and market access. Competitive pressures from established brands and emerging players, particularly in the compact tractor segment, also necessitate continuous innovation and competitive pricing strategies.
- Key Challenges & Restraints:
- High upfront cost of advanced agricultural tractors.
- Volatility in agricultural commodity prices affecting farmer purchasing power.
- Inadequate rural infrastructure and limited access to financing in some regions.
- Supply chain disruptions and raw material price fluctuations.
- Stringent environmental regulations and evolving emission standards.
- Intense competition and the need for continuous product differentiation.
Emerging Opportunities in Agricultural Tractors Industry
Emerging opportunities within the Agricultural Tractors Industry lie in the rapidly growing demand for electric tractors and autonomous farming solutions, particularly in regions with strict environmental regulations and a focus on sustainability. The untapped potential in emerging markets, such as Africa and parts of Southeast Asia, presents significant growth avenues for affordable and robust tractor models. The integration of artificial intelligence (AI) and machine learning for enhanced farm management through connected tractors is another key opportunity, offering farmers data-driven insights for improved crop yields and resource management. Furthermore, the development of specialized compact tractors for urban farming and vertical agriculture applications is an evolving niche.
Growth Accelerators in the Agricultural Tractors Industry Industry
Several factors are accelerating the long-term growth of the Agricultural Tractors Industry. Technological breakthroughs in battery technology and electric powertrains are paving the way for the widespread adoption of electric farm tractors. Strategic partnerships between tractor manufacturers and technology companies are fostering the development of integrated smart farming ecosystems. Market expansion strategies, including the introduction of flexible financing options and comprehensive after-sales services, are making advanced machinery more accessible. The increasing adoption of robotics and automation in agriculture is creating a synergistic growth effect, driving demand for tractors that can seamlessly integrate with these technologies.
Key Players Shaping the Agricultural Tractors Industry Market
- Iseki & Co Ltd
- Deere & Company
- CNH Industrial NV
- Kubota Corporation
- Mahindra & Mahindra Ltd
- Claas KGaA mbH
- Tractors and Farm Equipment Ltd
- AGCO Corporation (Massey Ferguson Limited)
- Yanmar Holdings Co Ltd
Notable Milestones in Agricultural Tractors Industry Sector
- November 2022: VST Tillers Tractors Ltd and ZETOR TRACTORS unveiled two best-in-class tractors at the CII Agro Tech India 2022 exhibition. These 45 HP and 50 HP category tractors are jointly developed by VST & ZETOR at their India & Czech Republic plants, indicating collaborative product development and market expansion efforts.
- July 2021: New Holland North America launched T7 Heavy-duty Tractor with PLM Intelligence as an addition to its line of agricultural tractors. The new tractor is aimed to help farmers be more productive, enabling multi-tasking in a variety of field and transport applications, highlighting innovation in operator assistance and multi-functional capabilities.
- June 2022: Solis Yanmar company launched three new tractor models in the below 30 HP category for Turkish farms that are to be exported from India, showcasing a strategic focus on the compact tractor segment and expanding export markets from India.
In-Depth Agricultural Tractors Industry Market Outlook
The Agricultural Tractors Industry is poised for significant expansion, driven by a confluence of technological advancements, increasing global food demand, and supportive government policies. The future market potential lies in the widespread adoption of sustainable farming solutions, including electric and hybrid tractors, which will address environmental concerns and reduce operating costs. Strategic opportunities will emerge from the integration of AI and IoT in tractors to create fully connected and data-driven agricultural ecosystems, enhancing precision and efficiency. The growth of the compact tractor segment for diversified farming operations and the penetration of advanced machinery in emerging economies will further fuel market expansion. Companies that focus on innovation, affordability, and robust after-sales support will be well-positioned to capitalize on these burgeoning opportunities.
Agricultural Tractors Industry Segmentation
- 1. Production Analysis
- 2. Consumption Analysis
- 3. Import Market Analysis (Value & Volume)
- 4. Export Market Analysis (Value & Volume)
- 5. Price Trend Analysis
Agricultural Tractors Industry Segmentation By Geography
-
1. North America
- 1.1. United States
- 1.2. Canada
- 1.3. Mexico
-
2. South America
- 2.1. Brazil
- 2.2. Argentina
- 2.3. Rest of South America
-
3. Europe
- 3.1. United Kingdom
- 3.2. Germany
- 3.3. France
- 3.4. Italy
- 3.5. Spain
- 3.6. Russia
- 3.7. Benelux
- 3.8. Nordics
- 3.9. Rest of Europe
-
4. Middle East & Africa
- 4.1. Turkey
- 4.2. Israel
- 4.3. GCC
- 4.4. North Africa
- 4.5. South Africa
- 4.6. Rest of Middle East & Africa
-
5. Asia Pacific
- 5.1. China
- 5.2. India
- 5.3. Japan
- 5.4. South Korea
- 5.5. ASEAN
- 5.6. Oceania
- 5.7. Rest of Asia Pacific
Agricultural Tractors Industry Regional Market Share
Geographic Coverage of Agricultural Tractors Industry
Agricultural Tractors Industry REPORT HIGHLIGHTS
| Aspects | Details |
|---|---|
| Study Period | 2020-2034 |
| Base Year | 2025 |
| Estimated Year | 2026 |
| Forecast Period | 2026-2034 |
| Historical Period | 2020-2025 |
| Growth Rate | CAGR of 5.20% from 2020-2034 |
| Segmentation |
|
Table of Contents
- 1. Introduction
- 1.1. Research Scope
- 1.2. Market Segmentation
- 1.3. Research Objective
- 1.4. Definitions and Assumptions
- 2. Executive Summary
- 2.1. Market Snapshot
- 3. Market Dynamics
- 3.1. Market Drivers
- 3.2. Market Restrains
- 3.3. Market Trends
- 3.4. Market Opportunities
- 4. Market Factor Analysis
- 4.1. Porters Five Forces
- 4.1.1. Bargaining Power of Suppliers
- 4.1.2. Bargaining Power of Buyers
- 4.1.3. Threat of New Entrants
- 4.1.4. Threat of Substitutes
- 4.1.5. Competitive Rivalry
- 4.2. PESTEL analysis
- 4.3. BCG Analysis
- 4.3.1. Stars (High Growth, High Market Share)
- 4.3.2. Cash Cows (Low Growth, High Market Share)
- 4.3.3. Question Mark (High Growth, Low Market Share)
- 4.3.4. Dogs (Low Growth, Low Market Share)
- 4.4. Ansoff Matrix Analysis
- 4.5. Supply Chain Analysis
- 4.6. Regulatory Landscape
- 4.7. Current Market Potential and Opportunity Assessment (TAM–SAM–SOM Framework)
- 4.8. IMR Analyst Note
- 4.1. Porters Five Forces
- 5. Market Analysis, Insights and Forecast 2021-2033
- 5.1. Market Analysis, Insights and Forecast - by Production Analysis
- 5.2. Market Analysis, Insights and Forecast - by Consumption Analysis
- 5.3. Market Analysis, Insights and Forecast - by Import Market Analysis (Value & Volume)
- 5.4. Market Analysis, Insights and Forecast - by Export Market Analysis (Value & Volume)
- 5.5. Market Analysis, Insights and Forecast - by Price Trend Analysis
- 5.6. Market Analysis, Insights and Forecast - by Region
- 5.6.1. North America
- 5.6.2. South America
- 5.6.3. Europe
- 5.6.4. Middle East & Africa
- 5.6.5. Asia Pacific
- 6. Global Agricultural Tractors Industry Analysis, Insights and Forecast, 2021-2033
- 6.1. Market Analysis, Insights and Forecast - by Production Analysis
- 6.2. Market Analysis, Insights and Forecast - by Consumption Analysis
- 6.3. Market Analysis, Insights and Forecast - by Import Market Analysis (Value & Volume)
- 6.4. Market Analysis, Insights and Forecast - by Export Market Analysis (Value & Volume)
- 6.5. Market Analysis, Insights and Forecast - by Price Trend Analysis
- 7. North America Agricultural Tractors Industry Analysis, Insights and Forecast, 2020-2032
- 7.1. Market Analysis, Insights and Forecast - by Production Analysis
- 7.2. Market Analysis, Insights and Forecast - by Consumption Analysis
- 7.3. Market Analysis, Insights and Forecast - by Import Market Analysis (Value & Volume)
- 7.4. Market Analysis, Insights and Forecast - by Export Market Analysis (Value & Volume)
- 7.5. Market Analysis, Insights and Forecast - by Price Trend Analysis
- 8. South America Agricultural Tractors Industry Analysis, Insights and Forecast, 2020-2032
- 8.1. Market Analysis, Insights and Forecast - by Production Analysis
- 8.2. Market Analysis, Insights and Forecast - by Consumption Analysis
- 8.3. Market Analysis, Insights and Forecast - by Import Market Analysis (Value & Volume)
- 8.4. Market Analysis, Insights and Forecast - by Export Market Analysis (Value & Volume)
- 8.5. Market Analysis, Insights and Forecast - by Price Trend Analysis
- 9. Europe Agricultural Tractors Industry Analysis, Insights and Forecast, 2020-2032
- 9.1. Market Analysis, Insights and Forecast - by Production Analysis
- 9.2. Market Analysis, Insights and Forecast - by Consumption Analysis
- 9.3. Market Analysis, Insights and Forecast - by Import Market Analysis (Value & Volume)
- 9.4. Market Analysis, Insights and Forecast - by Export Market Analysis (Value & Volume)
- 9.5. Market Analysis, Insights and Forecast - by Price Trend Analysis
- 10. Middle East & Africa Agricultural Tractors Industry Analysis, Insights and Forecast, 2020-2032
- 10.1. Market Analysis, Insights and Forecast - by Production Analysis
- 10.2. Market Analysis, Insights and Forecast - by Consumption Analysis
- 10.3. Market Analysis, Insights and Forecast - by Import Market Analysis (Value & Volume)
- 10.4. Market Analysis, Insights and Forecast - by Export Market Analysis (Value & Volume)
- 10.5. Market Analysis, Insights and Forecast - by Price Trend Analysis
- 11. Asia Pacific Agricultural Tractors Industry Analysis, Insights and Forecast, 2020-2032
- 11.1. Market Analysis, Insights and Forecast - by Production Analysis
- 11.2. Market Analysis, Insights and Forecast - by Consumption Analysis
- 11.3. Market Analysis, Insights and Forecast - by Import Market Analysis (Value & Volume)
- 11.4. Market Analysis, Insights and Forecast - by Export Market Analysis (Value & Volume)
- 11.5. Market Analysis, Insights and Forecast - by Price Trend Analysis
- 12. Competitive Analysis
- 12.1. Company Profiles
- 12.1.1 Iseki & Co Ltd
- 12.1.1.1. Company Overview
- 12.1.1.2. Products
- 12.1.1.3. Company Financials
- 12.1.1.4. SWOT Analysis
- 12.1.2 Deere & Company
- 12.1.2.1. Company Overview
- 12.1.2.2. Products
- 12.1.2.3. Company Financials
- 12.1.2.4. SWOT Analysis
- 12.1.3 CNH Industrial NV
- 12.1.3.1. Company Overview
- 12.1.3.2. Products
- 12.1.3.3. Company Financials
- 12.1.3.4. SWOT Analysis
- 12.1.4 Kubota Corporation
- 12.1.4.1. Company Overview
- 12.1.4.2. Products
- 12.1.4.3. Company Financials
- 12.1.4.4. SWOT Analysis
- 12.1.5 Mahindra & Mahindra Ltd
- 12.1.5.1. Company Overview
- 12.1.5.2. Products
- 12.1.5.3. Company Financials
- 12.1.5.4. SWOT Analysis
- 12.1.6 Claas KGaA mbH
- 12.1.6.1. Company Overview
- 12.1.6.2. Products
- 12.1.6.3. Company Financials
- 12.1.6.4. SWOT Analysis
- 12.1.7 Tractors and Farm Equipment Ltd
- 12.1.7.1. Company Overview
- 12.1.7.2. Products
- 12.1.7.3. Company Financials
- 12.1.7.4. SWOT Analysis
- 12.1.8 AGCO Corporation (Massey Ferguson Limited)
- 12.1.8.1. Company Overview
- 12.1.8.2. Products
- 12.1.8.3. Company Financials
- 12.1.8.4. SWOT Analysis
- 12.1.9 Yanmar Holdings Co Lt
- 12.1.9.1. Company Overview
- 12.1.9.2. Products
- 12.1.9.3. Company Financials
- 12.1.9.4. SWOT Analysis
- 12.1.1 Iseki & Co Ltd
- 12.2. Market Entropy
- 12.2.1 Company's Key Areas Served
- 12.2.2 Recent Developments
- 12.3. Company Market Share Analysis 2025
- 12.3.1 Top 5 Companies Market Share Analysis
- 12.3.2 Top 3 Companies Market Share Analysis
- 12.4. List of Potential Customers
- 13. Research Methodology
List of Figures
- Figure 1: Global Agricultural Tractors Industry Revenue Breakdown (Million, %) by Region 2025 & 2033
- Figure 2: North America Agricultural Tractors Industry Revenue (Million), by Production Analysis 2025 & 2033
- Figure 3: North America Agricultural Tractors Industry Revenue Share (%), by Production Analysis 2025 & 2033
- Figure 4: North America Agricultural Tractors Industry Revenue (Million), by Consumption Analysis 2025 & 2033
- Figure 5: North America Agricultural Tractors Industry Revenue Share (%), by Consumption Analysis 2025 & 2033
- Figure 6: North America Agricultural Tractors Industry Revenue (Million), by Import Market Analysis (Value & Volume) 2025 & 2033
- Figure 7: North America Agricultural Tractors Industry Revenue Share (%), by Import Market Analysis (Value & Volume) 2025 & 2033
- Figure 8: North America Agricultural Tractors Industry Revenue (Million), by Export Market Analysis (Value & Volume) 2025 & 2033
- Figure 9: North America Agricultural Tractors Industry Revenue Share (%), by Export Market Analysis (Value & Volume) 2025 & 2033
- Figure 10: North America Agricultural Tractors Industry Revenue (Million), by Price Trend Analysis 2025 & 2033
- Figure 11: North America Agricultural Tractors Industry Revenue Share (%), by Price Trend Analysis 2025 & 2033
- Figure 12: North America Agricultural Tractors Industry Revenue (Million), by Country 2025 & 2033
- Figure 13: North America Agricultural Tractors Industry Revenue Share (%), by Country 2025 & 2033
- Figure 14: South America Agricultural Tractors Industry Revenue (Million), by Production Analysis 2025 & 2033
- Figure 15: South America Agricultural Tractors Industry Revenue Share (%), by Production Analysis 2025 & 2033
- Figure 16: South America Agricultural Tractors Industry Revenue (Million), by Consumption Analysis 2025 & 2033
- Figure 17: South America Agricultural Tractors Industry Revenue Share (%), by Consumption Analysis 2025 & 2033
- Figure 18: South America Agricultural Tractors Industry Revenue (Million), by Import Market Analysis (Value & Volume) 2025 & 2033
- Figure 19: South America Agricultural Tractors Industry Revenue Share (%), by Import Market Analysis (Value & Volume) 2025 & 2033
- Figure 20: South America Agricultural Tractors Industry Revenue (Million), by Export Market Analysis (Value & Volume) 2025 & 2033
- Figure 21: South America Agricultural Tractors Industry Revenue Share (%), by Export Market Analysis (Value & Volume) 2025 & 2033
- Figure 22: South America Agricultural Tractors Industry Revenue (Million), by Price Trend Analysis 2025 & 2033
- Figure 23: South America Agricultural Tractors Industry Revenue Share (%), by Price Trend Analysis 2025 & 2033
- Figure 24: South America Agricultural Tractors Industry Revenue (Million), by Country 2025 & 2033
- Figure 25: South America Agricultural Tractors Industry Revenue Share (%), by Country 2025 & 2033
- Figure 26: Europe Agricultural Tractors Industry Revenue (Million), by Production Analysis 2025 & 2033
- Figure 27: Europe Agricultural Tractors Industry Revenue Share (%), by Production Analysis 2025 & 2033
- Figure 28: Europe Agricultural Tractors Industry Revenue (Million), by Consumption Analysis 2025 & 2033
- Figure 29: Europe Agricultural Tractors Industry Revenue Share (%), by Consumption Analysis 2025 & 2033
- Figure 30: Europe Agricultural Tractors Industry Revenue (Million), by Import Market Analysis (Value & Volume) 2025 & 2033
- Figure 31: Europe Agricultural Tractors Industry Revenue Share (%), by Import Market Analysis (Value & Volume) 2025 & 2033
- Figure 32: Europe Agricultural Tractors Industry Revenue (Million), by Export Market Analysis (Value & Volume) 2025 & 2033
- Figure 33: Europe Agricultural Tractors Industry Revenue Share (%), by Export Market Analysis (Value & Volume) 2025 & 2033
- Figure 34: Europe Agricultural Tractors Industry Revenue (Million), by Price Trend Analysis 2025 & 2033
- Figure 35: Europe Agricultural Tractors Industry Revenue Share (%), by Price Trend Analysis 2025 & 2033
- Figure 36: Europe Agricultural Tractors Industry Revenue (Million), by Country 2025 & 2033
- Figure 37: Europe Agricultural Tractors Industry Revenue Share (%), by Country 2025 & 2033
- Figure 38: Middle East & Africa Agricultural Tractors Industry Revenue (Million), by Production Analysis 2025 & 2033
- Figure 39: Middle East & Africa Agricultural Tractors Industry Revenue Share (%), by Production Analysis 2025 & 2033
- Figure 40: Middle East & Africa Agricultural Tractors Industry Revenue (Million), by Consumption Analysis 2025 & 2033
- Figure 41: Middle East & Africa Agricultural Tractors Industry Revenue Share (%), by Consumption Analysis 2025 & 2033
- Figure 42: Middle East & Africa Agricultural Tractors Industry Revenue (Million), by Import Market Analysis (Value & Volume) 2025 & 2033
- Figure 43: Middle East & Africa Agricultural Tractors Industry Revenue Share (%), by Import Market Analysis (Value & Volume) 2025 & 2033
- Figure 44: Middle East & Africa Agricultural Tractors Industry Revenue (Million), by Export Market Analysis (Value & Volume) 2025 & 2033
- Figure 45: Middle East & Africa Agricultural Tractors Industry Revenue Share (%), by Export Market Analysis (Value & Volume) 2025 & 2033
- Figure 46: Middle East & Africa Agricultural Tractors Industry Revenue (Million), by Price Trend Analysis 2025 & 2033
- Figure 47: Middle East & Africa Agricultural Tractors Industry Revenue Share (%), by Price Trend Analysis 2025 & 2033
- Figure 48: Middle East & Africa Agricultural Tractors Industry Revenue (Million), by Country 2025 & 2033
- Figure 49: Middle East & Africa Agricultural Tractors Industry Revenue Share (%), by Country 2025 & 2033
- Figure 50: Asia Pacific Agricultural Tractors Industry Revenue (Million), by Production Analysis 2025 & 2033
- Figure 51: Asia Pacific Agricultural Tractors Industry Revenue Share (%), by Production Analysis 2025 & 2033
- Figure 52: Asia Pacific Agricultural Tractors Industry Revenue (Million), by Consumption Analysis 2025 & 2033
- Figure 53: Asia Pacific Agricultural Tractors Industry Revenue Share (%), by Consumption Analysis 2025 & 2033
- Figure 54: Asia Pacific Agricultural Tractors Industry Revenue (Million), by Import Market Analysis (Value & Volume) 2025 & 2033
- Figure 55: Asia Pacific Agricultural Tractors Industry Revenue Share (%), by Import Market Analysis (Value & Volume) 2025 & 2033
- Figure 56: Asia Pacific Agricultural Tractors Industry Revenue (Million), by Export Market Analysis (Value & Volume) 2025 & 2033
- Figure 57: Asia Pacific Agricultural Tractors Industry Revenue Share (%), by Export Market Analysis (Value & Volume) 2025 & 2033
- Figure 58: Asia Pacific Agricultural Tractors Industry Revenue (Million), by Price Trend Analysis 2025 & 2033
- Figure 59: Asia Pacific Agricultural Tractors Industry Revenue Share (%), by Price Trend Analysis 2025 & 2033
- Figure 60: Asia Pacific Agricultural Tractors Industry Revenue (Million), by Country 2025 & 2033
- Figure 61: Asia Pacific Agricultural Tractors Industry Revenue Share (%), by Country 2025 & 2033
List of Tables
- Table 1: Global Agricultural Tractors Industry Revenue Million Forecast, by Production Analysis 2020 & 2033
- Table 2: Global Agricultural Tractors Industry Revenue Million Forecast, by Consumption Analysis 2020 & 2033
- Table 3: Global Agricultural Tractors Industry Revenue Million Forecast, by Import Market Analysis (Value & Volume) 2020 & 2033
- Table 4: Global Agricultural Tractors Industry Revenue Million Forecast, by Export Market Analysis (Value & Volume) 2020 & 2033
- Table 5: Global Agricultural Tractors Industry Revenue Million Forecast, by Price Trend Analysis 2020 & 2033
- Table 6: Global Agricultural Tractors Industry Revenue Million Forecast, by Region 2020 & 2033
- Table 7: Global Agricultural Tractors Industry Revenue Million Forecast, by Production Analysis 2020 & 2033
- Table 8: Global Agricultural Tractors Industry Revenue Million Forecast, by Consumption Analysis 2020 & 2033
- Table 9: Global Agricultural Tractors Industry Revenue Million Forecast, by Import Market Analysis (Value & Volume) 2020 & 2033
- Table 10: Global Agricultural Tractors Industry Revenue Million Forecast, by Export Market Analysis (Value & Volume) 2020 & 2033
- Table 11: Global Agricultural Tractors Industry Revenue Million Forecast, by Price Trend Analysis 2020 & 2033
- Table 12: Global Agricultural Tractors Industry Revenue Million Forecast, by Country 2020 & 2033
- Table 13: United States Agricultural Tractors Industry Revenue (Million) Forecast, by Application 2020 & 2033
- Table 14: Canada Agricultural Tractors Industry Revenue (Million) Forecast, by Application 2020 & 2033
- Table 15: Mexico Agricultural Tractors Industry Revenue (Million) Forecast, by Application 2020 & 2033
- Table 16: Global Agricultural Tractors Industry Revenue Million Forecast, by Production Analysis 2020 & 2033
- Table 17: Global Agricultural Tractors Industry Revenue Million Forecast, by Consumption Analysis 2020 & 2033
- Table 18: Global Agricultural Tractors Industry Revenue Million Forecast, by Import Market Analysis (Value & Volume) 2020 & 2033
- Table 19: Global Agricultural Tractors Industry Revenue Million Forecast, by Export Market Analysis (Value & Volume) 2020 & 2033
- Table 20: Global Agricultural Tractors Industry Revenue Million Forecast, by Price Trend Analysis 2020 & 2033
- Table 21: Global Agricultural Tractors Industry Revenue Million Forecast, by Country 2020 & 2033
- Table 22: Brazil Agricultural Tractors Industry Revenue (Million) Forecast, by Application 2020 & 2033
- Table 23: Argentina Agricultural Tractors Industry Revenue (Million) Forecast, by Application 2020 & 2033
- Table 24: Rest of South America Agricultural Tractors Industry Revenue (Million) Forecast, by Application 2020 & 2033
- Table 25: Global Agricultural Tractors Industry Revenue Million Forecast, by Production Analysis 2020 & 2033
- Table 26: Global Agricultural Tractors Industry Revenue Million Forecast, by Consumption Analysis 2020 & 2033
- Table 27: Global Agricultural Tractors Industry Revenue Million Forecast, by Import Market Analysis (Value & Volume) 2020 & 2033
- Table 28: Global Agricultural Tractors Industry Revenue Million Forecast, by Export Market Analysis (Value & Volume) 2020 & 2033
- Table 29: Global Agricultural Tractors Industry Revenue Million Forecast, by Price Trend Analysis 2020 & 2033
- Table 30: Global Agricultural Tractors Industry Revenue Million Forecast, by Country 2020 & 2033
- Table 31: United Kingdom Agricultural Tractors Industry Revenue (Million) Forecast, by Application 2020 & 2033
- Table 32: Germany Agricultural Tractors Industry Revenue (Million) Forecast, by Application 2020 & 2033
- Table 33: France Agricultural Tractors Industry Revenue (Million) Forecast, by Application 2020 & 2033
- Table 34: Italy Agricultural Tractors Industry Revenue (Million) Forecast, by Application 2020 & 2033
- Table 35: Spain Agricultural Tractors Industry Revenue (Million) Forecast, by Application 2020 & 2033
- Table 36: Russia Agricultural Tractors Industry Revenue (Million) Forecast, by Application 2020 & 2033
- Table 37: Benelux Agricultural Tractors Industry Revenue (Million) Forecast, by Application 2020 & 2033
- Table 38: Nordics Agricultural Tractors Industry Revenue (Million) Forecast, by Application 2020 & 2033
- Table 39: Rest of Europe Agricultural Tractors Industry Revenue (Million) Forecast, by Application 2020 & 2033
- Table 40: Global Agricultural Tractors Industry Revenue Million Forecast, by Production Analysis 2020 & 2033
- Table 41: Global Agricultural Tractors Industry Revenue Million Forecast, by Consumption Analysis 2020 & 2033
- Table 42: Global Agricultural Tractors Industry Revenue Million Forecast, by Import Market Analysis (Value & Volume) 2020 & 2033
- Table 43: Global Agricultural Tractors Industry Revenue Million Forecast, by Export Market Analysis (Value & Volume) 2020 & 2033
- Table 44: Global Agricultural Tractors Industry Revenue Million Forecast, by Price Trend Analysis 2020 & 2033
- Table 45: Global Agricultural Tractors Industry Revenue Million Forecast, by Country 2020 & 2033
- Table 46: Turkey Agricultural Tractors Industry Revenue (Million) Forecast, by Application 2020 & 2033
- Table 47: Israel Agricultural Tractors Industry Revenue (Million) Forecast, by Application 2020 & 2033
- Table 48: GCC Agricultural Tractors Industry Revenue (Million) Forecast, by Application 2020 & 2033
- Table 49: North Africa Agricultural Tractors Industry Revenue (Million) Forecast, by Application 2020 & 2033
- Table 50: South Africa Agricultural Tractors Industry Revenue (Million) Forecast, by Application 2020 & 2033
- Table 51: Rest of Middle East & Africa Agricultural Tractors Industry Revenue (Million) Forecast, by Application 2020 & 2033
- Table 52: Global Agricultural Tractors Industry Revenue Million Forecast, by Production Analysis 2020 & 2033
- Table 53: Global Agricultural Tractors Industry Revenue Million Forecast, by Consumption Analysis 2020 & 2033
- Table 54: Global Agricultural Tractors Industry Revenue Million Forecast, by Import Market Analysis (Value & Volume) 2020 & 2033
- Table 55: Global Agricultural Tractors Industry Revenue Million Forecast, by Export Market Analysis (Value & Volume) 2020 & 2033
- Table 56: Global Agricultural Tractors Industry Revenue Million Forecast, by Price Trend Analysis 2020 & 2033
- Table 57: Global Agricultural Tractors Industry Revenue Million Forecast, by Country 2020 & 2033
- Table 58: China Agricultural Tractors Industry Revenue (Million) Forecast, by Application 2020 & 2033
- Table 59: India Agricultural Tractors Industry Revenue (Million) Forecast, by Application 2020 & 2033
- Table 60: Japan Agricultural Tractors Industry Revenue (Million) Forecast, by Application 2020 & 2033
- Table 61: South Korea Agricultural Tractors Industry Revenue (Million) Forecast, by Application 2020 & 2033
- Table 62: ASEAN Agricultural Tractors Industry Revenue (Million) Forecast, by Application 2020 & 2033
- Table 63: Oceania Agricultural Tractors Industry Revenue (Million) Forecast, by Application 2020 & 2033
- Table 64: Rest of Asia Pacific Agricultural Tractors Industry Revenue (Million) Forecast, by Application 2020 & 2033
Frequently Asked Questions
1. What is the projected Compound Annual Growth Rate (CAGR) of the Agricultural Tractors Industry?
The projected CAGR is approximately 5.20%.
2. Which companies are prominent players in the Agricultural Tractors Industry?
Key companies in the market include Iseki & Co Ltd, Deere & Company, CNH Industrial NV, Kubota Corporation, Mahindra & Mahindra Ltd, Claas KGaA mbH, Tractors and Farm Equipment Ltd, AGCO Corporation (Massey Ferguson Limited), Yanmar Holdings Co Lt.
3. What are the main segments of the Agricultural Tractors Industry?
The market segments include Production Analysis, Consumption Analysis, Import Market Analysis (Value & Volume), Export Market Analysis (Value & Volume), Price Trend Analysis.
4. Can you provide details about the market size?
The market size is estimated to be USD 70.40 Million as of 2022.
5. What are some drivers contributing to market growth?
Shortage of Skilled Labor; Government Support to Enhance Farm Mechanization.
6. What are the notable trends driving market growth?
Increasing Farm Mechanization in Developing Markets.
7. Are there any restraints impacting market growth?
Heavy Initial Procurement Cost and High Expenditure on Maintenance.
8. Can you provide examples of recent developments in the market?
November 2022: VST Tillers Tractors Ltd and ZETOR TRACTORS unveiled two best-in-class tractors at the CII Agro Tech India 2022 exhibition. These 45 HP and 50 HP category tractors are jointly developed by VST & ZETOR at their India & Czech Republic plants.
9. What pricing options are available for accessing the report?
Pricing options include single-user, multi-user, and enterprise licenses priced at USD 4750, USD 5250, and USD 8750 respectively.
10. Is the market size provided in terms of value or volume?
The market size is provided in terms of value, measured in Million.
11. Are there any specific market keywords associated with the report?
Yes, the market keyword associated with the report is "Agricultural Tractors Industry," which aids in identifying and referencing the specific market segment covered.
12. How do I determine which pricing option suits my needs best?
The pricing options vary based on user requirements and access needs. Individual users may opt for single-user licenses, while businesses requiring broader access may choose multi-user or enterprise licenses for cost-effective access to the report.
13. Are there any additional resources or data provided in the Agricultural Tractors Industry report?
While the report offers comprehensive insights, it's advisable to review the specific contents or supplementary materials provided to ascertain if additional resources or data are available.
14. How can I stay updated on further developments or reports in the Agricultural Tractors Industry?
To stay informed about further developments, trends, and reports in the Agricultural Tractors Industry, consider subscribing to industry newsletters, following relevant companies and organizations, or regularly checking reputable industry news sources and publications.
Methodology
Step 1 - Identification of Relevant Samples Size from Population Database


Step 2 - Approaches for Defining Global Market Size (Value, Volume* & Price*)

Note*: In applicable scenarios
Step 3 - Data Sources
Primary Research
- Web Analytics
- Survey Reports
- Research Institute
- Latest Research Reports
- Opinion Leaders
Secondary Research
- Annual Reports
- White Paper
- Latest Press Release
- Industry Association
- Paid Database
- Investor Presentations

Step 4 - Data Triangulation
Involves using different sources of information in order to increase the validity of a study
These sources are likely to be stakeholders in a program - participants, other researchers, program staff, other community members, and so on.
Then we put all data in single framework & apply various statistical tools to find out the dynamic on the market.
During the analysis stage, feedback from the stakeholder groups would be compared to determine areas of agreement as well as areas of divergence