

Key Insights
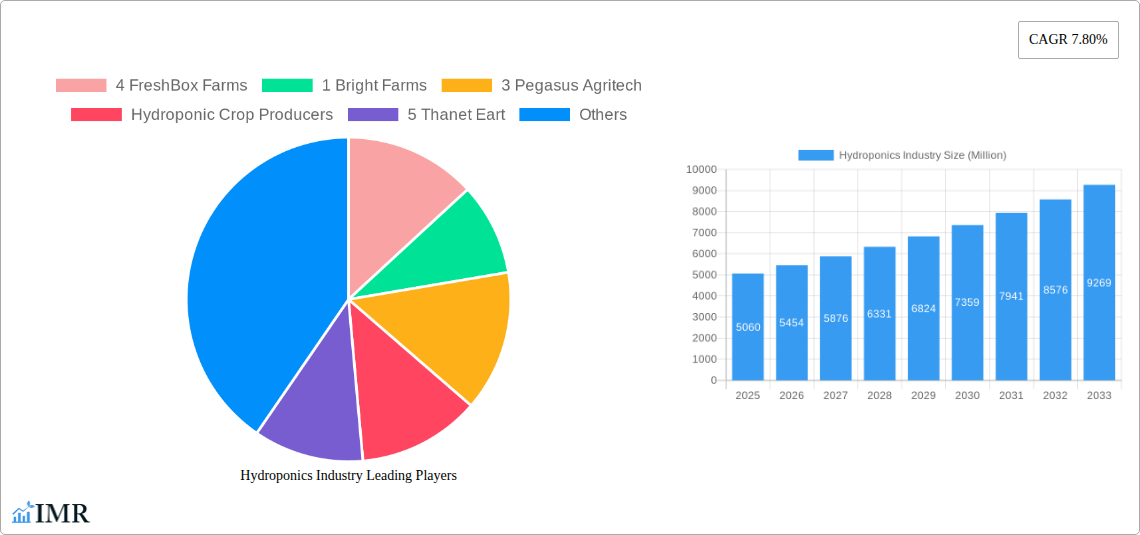
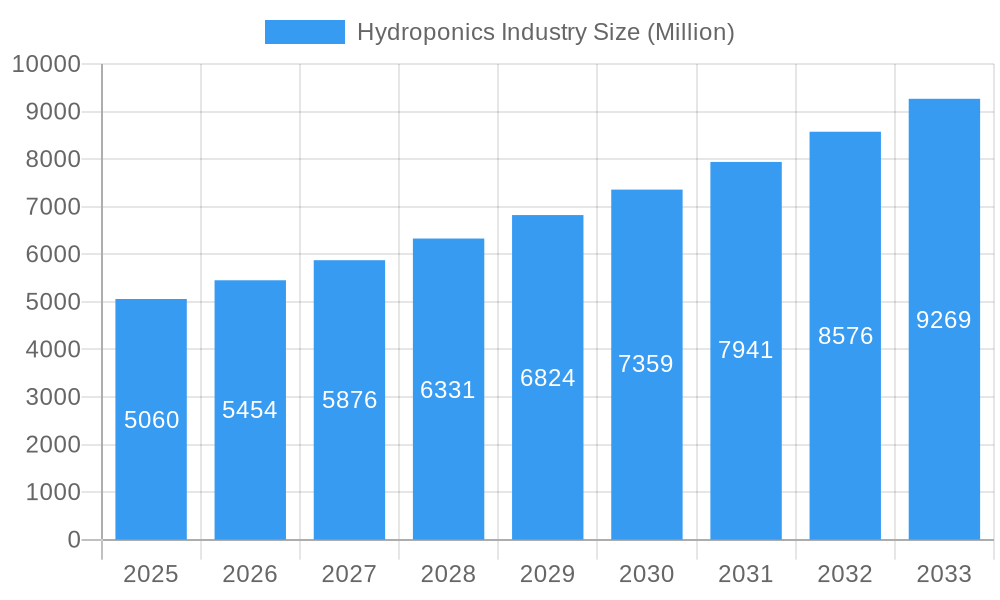
The global hydroponics market is poised for robust expansion, currently valued at approximately USD 5.06 billion. This dynamic sector is projected to witness a Compound Annual Growth Rate (CAGR) of 7.80% through 2033, indicating significant investment and adoption of soilless farming techniques. The primary drivers fueling this growth are the increasing demand for fresh, locally sourced produce, the need for sustainable agricultural practices in the face of water scarcity and climate change, and advancements in hydroponic technology that enhance efficiency and yield. Urbanization, with its growing population density, also contributes to the market's upward trajectory as hydroponics offers a solution for producing food in limited urban spaces. Furthermore, the rising awareness among consumers regarding the health benefits of pesticide-free produce and the desire for year-round availability of various crops are creating a fertile ground for hydroponic systems. Emerging trends include the integration of artificial intelligence and IoT for precision agriculture, the development of modular and scalable hydroponic setups for both commercial and home use, and the growing popularity of vertical farming enabled by hydroponics.
Hydroponics Industry Market Size (In Billion)
Despite the promising outlook, the market is not without its restraints. Initial setup costs for advanced hydroponic systems can be a deterrent for smaller players and developing regions. The reliance on electricity for lighting, nutrient pumps, and climate control can also lead to higher operational expenses, particularly in areas with unreliable power grids. Moreover, the need for specialized knowledge in nutrient management and disease control within closed-loop systems presents a learning curve for new entrants. However, ongoing research and development are continuously addressing these challenges by improving energy efficiency, developing more cost-effective technologies, and creating user-friendly systems. The market's segmentation is expected to reflect varied adoption rates across production, consumption, import/export dynamics, and pricing, with North America and Europe anticipated to lead in terms of technological adoption and market value, while Asia Pacific shows immense potential for rapid growth due to its large population and increasing focus on food security.
Hydroponics Industry Company Market Share
Hydroponics Industry Report: Market Dynamics, Growth Trends, and Future Outlook (2019-2033)
This comprehensive report provides an in-depth analysis of the global hydroponics industry, a rapidly expanding sector transforming food production through advanced agricultural technologies. Spanning from 2019 to 2033, with a base year of 2025, this study offers critical insights into market dynamics, growth drivers, regional dominance, product landscape, challenges, opportunities, and key players. The report leverages high-traffic keywords such as "hydroponic farming," "vertical farming," "controlled environment agriculture (CEA)," "indoor farming," "sustainable agriculture," and "urban farming" to ensure maximum search engine visibility and engagement with industry professionals, investors, and policymakers. We present all values in Million units for clear quantitative analysis, focusing on both parent and child market segments to capture the full spectrum of the industry.
Hydroponics Industry Market Dynamics & Structure
The hydroponics industry is characterized by a moderately concentrated market structure, driven by significant capital investment and technological sophistication. Key market drivers include the escalating demand for fresh, locally sourced produce, growing concerns over water scarcity and traditional farming's environmental impact, and advancements in LED lighting, automation, and nutrient delivery systems. Regulatory frameworks are evolving to support sustainable agriculture and food safety standards, though regional variations exist. Competitive product substitutes, primarily conventional agriculture, are gradually losing ground as hydroponics offers predictable yields, reduced land use, and year-round production. End-user demographics are increasingly urban and environmentally conscious, seeking traceable and healthy food options. Mergers and acquisitions (M&A) are on the rise as larger corporations seek to enter or expand their footprint in this lucrative sector, consolidating market share and fostering innovation.
- Market Concentration: Dominated by a blend of established agricultural giants and innovative startups.
- Technological Innovation Drivers: Advancements in LED spectrum optimization, AI-driven climate control, automated harvesting, and sustainable nutrient recycling systems.
- Regulatory Frameworks: Increasing government support for sustainable agriculture and urban food production initiatives.
- Competitive Product Substitutes: Traditional agriculture, with ongoing efforts to highlight hydroponics' advantages in resource efficiency and yield consistency.
- End-User Demographics: Growing demand from urban populations, health-conscious consumers, and food service industries seeking reliable supply chains.
- M&A Trends: A surge in acquisitions by large food conglomerates and investment firms seeking to integrate CEA into their portfolios.
Hydroponics Industry Growth Trends & Insights
The global hydroponics industry is poised for robust expansion, driven by a confluence of technological advancements, environmental imperatives, and shifting consumer preferences. The market size is projected to witness a significant CAGR, fueled by increasing adoption rates across diverse geographical regions and crop types. Technological disruptions, such as the integration of AI and IoT in farm management, are enhancing efficiency and reducing operational costs, making hydroponic systems more accessible and scalable. Consumer behavior is increasingly shifting towards locally grown, pesticide-free produce, directly benefiting the hydroponics sector which can deliver these attributes consistently. Furthermore, the growing awareness of climate change and the need for resilient food systems are accelerating the transition towards controlled environment agriculture (CEA). The integration of hydroponics into urban landscapes through vertical farms is also a significant trend, addressing food miles and enhancing food security in densely populated areas. The market penetration of hydroponic produce is expected to rise significantly in the coming years, as awareness and accessibility improve.
- Market Size Evolution: Projecting substantial growth from USD XXX Million in 2019 to an estimated USD XXX Million by 2033.
- Adoption Rates: Increasing adoption by commercial growers, food retailers, and even home enthusiasts.
- Technological Disruptions: Real-time monitoring, predictive analytics for crop health, and autonomous operations.
- Consumer Behavior Shifts: Growing preference for hyper-local, sustainably grown, and nutrient-rich produce.
- Market Penetration: Expanding into new crop categories and geographical markets.
- CAGR: Expected to be in the xx% range during the forecast period, indicating rapid market expansion.
Dominant Regions, Countries, or Segments in Hydroponics Industry
North America, particularly the United States, stands out as a dominant region in the hydroponics industry, driven by a combination of advanced technological adoption, significant investment, and strong consumer demand for fresh produce. The Production Analysis in this region is characterized by large-scale commercial vertical farms and greenhouse operations focusing on high-value crops like leafy greens and herbs. In terms of Consumption Analysis, the U.S. exhibits a high per capita consumption of hydroponically grown produce, spurred by health consciousness and a desire for locally sourced food. The Import Market Analysis (Value & Volume) for hydroponics in North America shows a consistent inflow of specialized equipment and technologies, while the Export Market Analysis (Value & Volume) is primarily focused on exporting the produce itself to regions with limited growing seasons or suitable climates. The Price Trend Analysis in North America indicates a gradual decrease in production costs due to economies of scale and technological efficiencies, making hydroponic produce more competitive.
- Leading Region: North America (United States and Canada)
- Key Drivers in North America:
- Economic Policies: Government incentives and grants supporting sustainable agriculture and innovation.
- Infrastructure: Well-developed logistics networks enabling efficient distribution of produce.
- Technological Advancement: Early adoption and development of cutting-edge hydroponic technologies.
- Consumer Demand: High awareness and preference for fresh, healthy, and sustainably grown food.
- Dominance Factors: Significant investment in R&D, large-scale commercial operations, and a robust retail ecosystem.
- Market Share: North America currently holds a substantial share in global hydroponic production and consumption.
- Growth Potential: Continued expansion driven by urbanization and the pursuit of food security.
The Production Analysis within the parent market of Hydroponics shows North America leading, with the United States having the largest number of commercial hydroponic farms. Within the child market of Leafy Greens production, companies like Bright Farms are expanding their capacity significantly.
The Consumption Analysis also sees North America at the forefront, with a rising demand for locally grown produce. This is further supported by the Import Market Analysis (Value & Volume), where countries like Canada import advanced hydroponic systems and technologies. The Export Market Analysis (Value & Volume) is seeing growth as North American hydroponic produce gains international recognition. The Price Trend Analysis indicates a downward trend in production costs, making hydroponic produce more accessible.
Hydroponics Industry Product Landscape
The hydroponics industry's product landscape is diverse, encompassing a range of advanced cultivation systems and crop varieties. Innovations focus on optimizing nutrient solutions, improving light spectrum efficiency for accelerated growth, and integrating smart technologies for precise environmental control. Applications range from large-scale commercial vertical farms producing staple crops like lettuce and tomatoes to smaller, modular systems for urban settings and home use. Performance metrics are increasingly centered on yield per square foot, water usage efficiency, and reduced carbon footprint. Unique selling propositions include the ability to grow produce year-round, free from pesticides, and closer to consumers, reducing transportation emissions. Technological advancements are continuously enhancing crop quality, shelf-life, and nutritional content.
Key Drivers, Barriers & Challenges in Hydroponics Industry
The hydroponics industry is propelled by several key drivers, including the global imperative for sustainable food production, increasing urbanization leading to reduced arable land, and growing consumer demand for fresh, healthy, and locally sourced produce. Technological advancements in automation, LED lighting, and nutrient management are further accelerating adoption. Policy support and investment in agri-tech are also significant catalysts.
However, the industry faces several barriers and challenges. High initial capital investment for setting up advanced hydroponic systems remains a significant hurdle. The energy-intensive nature of indoor farming, particularly for lighting and climate control, poses economic and environmental challenges. Regulatory hurdles and the need for specialized knowledge and skilled labor can also impede growth. Supply chain complexities for equipment and consumables, along with potential pest and disease outbreaks, require robust management strategies. Competitive pressures from traditional agriculture, though diminishing, still exist.
Emerging Opportunities in Hydroponics Industry
Emerging opportunities in the hydroponics industry are vast and varied. There is significant untapped potential in expanding hydroponic cultivation to a wider array of crops beyond leafy greens and herbs, including fruits and root vegetables. The development of advanced, modular, and affordable hydroponic systems for developing nations presents a considerable market. Furthermore, the integration of AI and machine learning for predictive analytics in crop management and yield optimization offers substantial innovation avenues. Growing consumer interest in functional foods and nutraceuticals also opens doors for specialized hydroponic crop cultivation. The concept of "agri-tourism" and direct-to-consumer hydroponic kits are also gaining traction.
Growth Accelerators in the Hydroponics Industry Industry
Several factors are acting as growth accelerators for the hydroponics industry. Technological breakthroughs in energy-efficient LED lighting and renewable energy integration are significantly reducing operational costs and environmental impact. Strategic partnerships between technology providers, growers, and food retailers are creating more efficient value chains and expanding market access. The increasing focus on circular economy principles, such as water recycling and waste valorization, is enhancing sustainability and cost-effectiveness. Market expansion strategies, including the development of smaller-scale, community-based hydroponic farms and the adoption of vertical farming in urban food deserts, are further fueling growth.
Key Players Shaping the Hydroponics Industry Market
- FreshBox Farms
- Bright Farms
- Pegasus Agritech
- Hydroponic Crop Producers
- Thanet Earth
- Village Farms International Inc
Notable Milestones in Hydroponics Industry Sector
- March 2024: INSONGREEN announced a significant expansion of its hydroponic and vertical greenhouse production in the Middle East and Africa.
- January 2024: Bright Farms expanded its greenhouse hydroponic farms to three locations: Yorkville, Illinois; Lorena, Texas; and Macon, Georgia.
- October 2022: GrowGeneration Corp (GRWG) opened a 9,000-square-foot store in Richmond, its first hydroponic store in Virginia.
- July 2022: Bustanica unveiled the world's largest hydroponic farm, which received a USD 40 million investment.
In-Depth Hydroponics Industry Market Outlook
The future outlook for the hydroponics industry is exceptionally promising, driven by its inherent ability to address critical global challenges in food security and sustainability. Growth accelerators such as continuous technological innovation, particularly in automation and AI-driven precision agriculture, will further optimize resource utilization and operational efficiency. The increasing demand for controlled environment agriculture (CEA) solutions, fueled by climate change and urbanization, will create substantial market opportunities. Strategic partnerships across the value chain, from technology developers to end-consumers, will foster a more integrated and resilient food system. Market expansion will be further propelled by the diversification of crop portfolios and the adoption of hydroponic systems in emerging economies, solidifying its role as a cornerstone of future food production.
Hydroponics Industry Segmentation
- 1. Production Analysis
- 2. Consumption Analysis
- 3. Import Market Analysis (Value & Volume)
- 4. Export Market Analysis (Value & Volume)
- 5. Price Trend Analysis
Hydroponics Industry Segmentation By Geography
-
1. North America
- 1.1. United States
- 1.2. Canada
- 1.3. Mexico
-
2. South America
- 2.1. Brazil
- 2.2. Argentina
- 2.3. Rest of South America
-
3. Europe
- 3.1. United Kingdom
- 3.2. Germany
- 3.3. France
- 3.4. Italy
- 3.5. Spain
- 3.6. Russia
- 3.7. Benelux
- 3.8. Nordics
- 3.9. Rest of Europe
-
4. Middle East & Africa
- 4.1. Turkey
- 4.2. Israel
- 4.3. GCC
- 4.4. North Africa
- 4.5. South Africa
- 4.6. Rest of Middle East & Africa
-
5. Asia Pacific
- 5.1. China
- 5.2. India
- 5.3. Japan
- 5.4. South Korea
- 5.5. ASEAN
- 5.6. Oceania
- 5.7. Rest of Asia Pacific
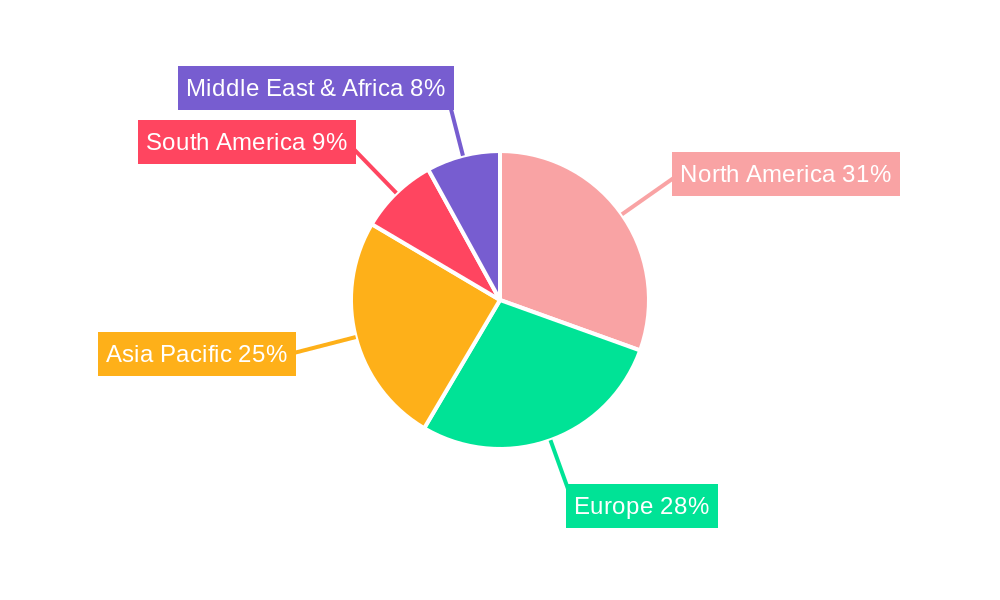
Hydroponics Industry Regional Market Share
Geographic Coverage of Hydroponics Industry
Hydroponics Industry REPORT HIGHLIGHTS
| Aspects | Details |
|---|---|
| Study Period | 2020-2034 |
| Base Year | 2025 |
| Estimated Year | 2026 |
| Forecast Period | 2026-2034 |
| Historical Period | 2020-2025 |
| Growth Rate | CAGR of 7.80% from 2020-2034 |
| Segmentation |
|
Table of Contents
- 1. Introduction
- 1.1. Research Scope
- 1.2. Market Segmentation
- 1.3. Research Objective
- 1.4. Definitions and Assumptions
- 2. Executive Summary
- 2.1. Market Snapshot
- 3. Market Dynamics
- 3.1. Market Drivers
- 3.2. Market Restrains
- 3.3. Market Trends
- 3.4. Market Opportunities
- 4. Market Factor Analysis
- 4.1. Porters Five Forces
- 4.1.1. Bargaining Power of Suppliers
- 4.1.2. Bargaining Power of Buyers
- 4.1.3. Threat of New Entrants
- 4.1.4. Threat of Substitutes
- 4.1.5. Competitive Rivalry
- 4.2. PESTEL analysis
- 4.3. BCG Analysis
- 4.3.1. Stars (High Growth, High Market Share)
- 4.3.2. Cash Cows (Low Growth, High Market Share)
- 4.3.3. Question Mark (High Growth, Low Market Share)
- 4.3.4. Dogs (Low Growth, Low Market Share)
- 4.4. Ansoff Matrix Analysis
- 4.5. Supply Chain Analysis
- 4.6. Regulatory Landscape
- 4.7. Current Market Potential and Opportunity Assessment (TAM–SAM–SOM Framework)
- 4.8. IMR Analyst Note
- 4.1. Porters Five Forces
- 5. Market Analysis, Insights and Forecast 2021-2033
- 5.1. Market Analysis, Insights and Forecast - by Production Analysis
- 5.2. Market Analysis, Insights and Forecast - by Consumption Analysis
- 5.3. Market Analysis, Insights and Forecast - by Import Market Analysis (Value & Volume)
- 5.4. Market Analysis, Insights and Forecast - by Export Market Analysis (Value & Volume)
- 5.5. Market Analysis, Insights and Forecast - by Price Trend Analysis
- 5.6. Market Analysis, Insights and Forecast - by Region
- 5.6.1. North America
- 5.6.2. South America
- 5.6.3. Europe
- 5.6.4. Middle East & Africa
- 5.6.5. Asia Pacific
- 6. Global Hydroponics Industry Analysis, Insights and Forecast, 2021-2033
- 6.1. Market Analysis, Insights and Forecast - by Production Analysis
- 6.2. Market Analysis, Insights and Forecast - by Consumption Analysis
- 6.3. Market Analysis, Insights and Forecast - by Import Market Analysis (Value & Volume)
- 6.4. Market Analysis, Insights and Forecast - by Export Market Analysis (Value & Volume)
- 6.5. Market Analysis, Insights and Forecast - by Price Trend Analysis
- 7. North America Hydroponics Industry Analysis, Insights and Forecast, 2020-2032
- 7.1. Market Analysis, Insights and Forecast - by Production Analysis
- 7.2. Market Analysis, Insights and Forecast - by Consumption Analysis
- 7.3. Market Analysis, Insights and Forecast - by Import Market Analysis (Value & Volume)
- 7.4. Market Analysis, Insights and Forecast - by Export Market Analysis (Value & Volume)
- 7.5. Market Analysis, Insights and Forecast - by Price Trend Analysis
- 8. South America Hydroponics Industry Analysis, Insights and Forecast, 2020-2032
- 8.1. Market Analysis, Insights and Forecast - by Production Analysis
- 8.2. Market Analysis, Insights and Forecast - by Consumption Analysis
- 8.3. Market Analysis, Insights and Forecast - by Import Market Analysis (Value & Volume)
- 8.4. Market Analysis, Insights and Forecast - by Export Market Analysis (Value & Volume)
- 8.5. Market Analysis, Insights and Forecast - by Price Trend Analysis
- 9. Europe Hydroponics Industry Analysis, Insights and Forecast, 2020-2032
- 9.1. Market Analysis, Insights and Forecast - by Production Analysis
- 9.2. Market Analysis, Insights and Forecast - by Consumption Analysis
- 9.3. Market Analysis, Insights and Forecast - by Import Market Analysis (Value & Volume)
- 9.4. Market Analysis, Insights and Forecast - by Export Market Analysis (Value & Volume)
- 9.5. Market Analysis, Insights and Forecast - by Price Trend Analysis
- 10. Middle East & Africa Hydroponics Industry Analysis, Insights and Forecast, 2020-2032
- 10.1. Market Analysis, Insights and Forecast - by Production Analysis
- 10.2. Market Analysis, Insights and Forecast - by Consumption Analysis
- 10.3. Market Analysis, Insights and Forecast - by Import Market Analysis (Value & Volume)
- 10.4. Market Analysis, Insights and Forecast - by Export Market Analysis (Value & Volume)
- 10.5. Market Analysis, Insights and Forecast - by Price Trend Analysis
- 11. Asia Pacific Hydroponics Industry Analysis, Insights and Forecast, 2020-2032
- 11.1. Market Analysis, Insights and Forecast - by Production Analysis
- 11.2. Market Analysis, Insights and Forecast - by Consumption Analysis
- 11.3. Market Analysis, Insights and Forecast - by Import Market Analysis (Value & Volume)
- 11.4. Market Analysis, Insights and Forecast - by Export Market Analysis (Value & Volume)
- 11.5. Market Analysis, Insights and Forecast - by Price Trend Analysis
- 12. Competitive Analysis
- 12.1. Company Profiles
- 12.1.1 4 FreshBox Farms
- 12.1.1.1. Company Overview
- 12.1.1.2. Products
- 12.1.1.3. Company Financials
- 12.1.1.4. SWOT Analysis
- 12.1.2 1 Bright Farms
- 12.1.2.1. Company Overview
- 12.1.2.2. Products
- 12.1.2.3. Company Financials
- 12.1.2.4. SWOT Analysis
- 12.1.3 3 Pegasus Agritech
- 12.1.3.1. Company Overview
- 12.1.3.2. Products
- 12.1.3.3. Company Financials
- 12.1.3.4. SWOT Analysis
- 12.1.4 Hydroponic Crop Producers
- 12.1.4.1. Company Overview
- 12.1.4.2. Products
- 12.1.4.3. Company Financials
- 12.1.4.4. SWOT Analysis
- 12.1.5 5 Thanet Eart
- 12.1.5.1. Company Overview
- 12.1.5.2. Products
- 12.1.5.3. Company Financials
- 12.1.5.4. SWOT Analysis
- 12.1.6 2 Village Farms International Inc
- 12.1.6.1. Company Overview
- 12.1.6.2. Products
- 12.1.6.3. Company Financials
- 12.1.6.4. SWOT Analysis
- 12.1.1 4 FreshBox Farms
- 12.2. Market Entropy
- 12.2.1 Company's Key Areas Served
- 12.2.2 Recent Developments
- 12.3. Company Market Share Analysis 2025
- 12.3.1 Top 5 Companies Market Share Analysis
- 12.3.2 Top 3 Companies Market Share Analysis
- 12.4. List of Potential Customers
- 13. Research Methodology
List of Figures
- Figure 1: Global Hydroponics Industry Revenue Breakdown (Million, %) by Region 2025 & 2033
- Figure 2: North America Hydroponics Industry Revenue (Million), by Production Analysis 2025 & 2033
- Figure 3: North America Hydroponics Industry Revenue Share (%), by Production Analysis 2025 & 2033
- Figure 4: North America Hydroponics Industry Revenue (Million), by Consumption Analysis 2025 & 2033
- Figure 5: North America Hydroponics Industry Revenue Share (%), by Consumption Analysis 2025 & 2033
- Figure 6: North America Hydroponics Industry Revenue (Million), by Import Market Analysis (Value & Volume) 2025 & 2033
- Figure 7: North America Hydroponics Industry Revenue Share (%), by Import Market Analysis (Value & Volume) 2025 & 2033
- Figure 8: North America Hydroponics Industry Revenue (Million), by Export Market Analysis (Value & Volume) 2025 & 2033
- Figure 9: North America Hydroponics Industry Revenue Share (%), by Export Market Analysis (Value & Volume) 2025 & 2033
- Figure 10: North America Hydroponics Industry Revenue (Million), by Price Trend Analysis 2025 & 2033
- Figure 11: North America Hydroponics Industry Revenue Share (%), by Price Trend Analysis 2025 & 2033
- Figure 12: North America Hydroponics Industry Revenue (Million), by Country 2025 & 2033
- Figure 13: North America Hydroponics Industry Revenue Share (%), by Country 2025 & 2033
- Figure 14: South America Hydroponics Industry Revenue (Million), by Production Analysis 2025 & 2033
- Figure 15: South America Hydroponics Industry Revenue Share (%), by Production Analysis 2025 & 2033
- Figure 16: South America Hydroponics Industry Revenue (Million), by Consumption Analysis 2025 & 2033
- Figure 17: South America Hydroponics Industry Revenue Share (%), by Consumption Analysis 2025 & 2033
- Figure 18: South America Hydroponics Industry Revenue (Million), by Import Market Analysis (Value & Volume) 2025 & 2033
- Figure 19: South America Hydroponics Industry Revenue Share (%), by Import Market Analysis (Value & Volume) 2025 & 2033
- Figure 20: South America Hydroponics Industry Revenue (Million), by Export Market Analysis (Value & Volume) 2025 & 2033
- Figure 21: South America Hydroponics Industry Revenue Share (%), by Export Market Analysis (Value & Volume) 2025 & 2033
- Figure 22: South America Hydroponics Industry Revenue (Million), by Price Trend Analysis 2025 & 2033
- Figure 23: South America Hydroponics Industry Revenue Share (%), by Price Trend Analysis 2025 & 2033
- Figure 24: South America Hydroponics Industry Revenue (Million), by Country 2025 & 2033
- Figure 25: South America Hydroponics Industry Revenue Share (%), by Country 2025 & 2033
- Figure 26: Europe Hydroponics Industry Revenue (Million), by Production Analysis 2025 & 2033
- Figure 27: Europe Hydroponics Industry Revenue Share (%), by Production Analysis 2025 & 2033
- Figure 28: Europe Hydroponics Industry Revenue (Million), by Consumption Analysis 2025 & 2033
- Figure 29: Europe Hydroponics Industry Revenue Share (%), by Consumption Analysis 2025 & 2033
- Figure 30: Europe Hydroponics Industry Revenue (Million), by Import Market Analysis (Value & Volume) 2025 & 2033
- Figure 31: Europe Hydroponics Industry Revenue Share (%), by Import Market Analysis (Value & Volume) 2025 & 2033
- Figure 32: Europe Hydroponics Industry Revenue (Million), by Export Market Analysis (Value & Volume) 2025 & 2033
- Figure 33: Europe Hydroponics Industry Revenue Share (%), by Export Market Analysis (Value & Volume) 2025 & 2033
- Figure 34: Europe Hydroponics Industry Revenue (Million), by Price Trend Analysis 2025 & 2033
- Figure 35: Europe Hydroponics Industry Revenue Share (%), by Price Trend Analysis 2025 & 2033
- Figure 36: Europe Hydroponics Industry Revenue (Million), by Country 2025 & 2033
- Figure 37: Europe Hydroponics Industry Revenue Share (%), by Country 2025 & 2033
- Figure 38: Middle East & Africa Hydroponics Industry Revenue (Million), by Production Analysis 2025 & 2033
- Figure 39: Middle East & Africa Hydroponics Industry Revenue Share (%), by Production Analysis 2025 & 2033
- Figure 40: Middle East & Africa Hydroponics Industry Revenue (Million), by Consumption Analysis 2025 & 2033
- Figure 41: Middle East & Africa Hydroponics Industry Revenue Share (%), by Consumption Analysis 2025 & 2033
- Figure 42: Middle East & Africa Hydroponics Industry Revenue (Million), by Import Market Analysis (Value & Volume) 2025 & 2033
- Figure 43: Middle East & Africa Hydroponics Industry Revenue Share (%), by Import Market Analysis (Value & Volume) 2025 & 2033
- Figure 44: Middle East & Africa Hydroponics Industry Revenue (Million), by Export Market Analysis (Value & Volume) 2025 & 2033
- Figure 45: Middle East & Africa Hydroponics Industry Revenue Share (%), by Export Market Analysis (Value & Volume) 2025 & 2033
- Figure 46: Middle East & Africa Hydroponics Industry Revenue (Million), by Price Trend Analysis 2025 & 2033
- Figure 47: Middle East & Africa Hydroponics Industry Revenue Share (%), by Price Trend Analysis 2025 & 2033
- Figure 48: Middle East & Africa Hydroponics Industry Revenue (Million), by Country 2025 & 2033
- Figure 49: Middle East & Africa Hydroponics Industry Revenue Share (%), by Country 2025 & 2033
- Figure 50: Asia Pacific Hydroponics Industry Revenue (Million), by Production Analysis 2025 & 2033
- Figure 51: Asia Pacific Hydroponics Industry Revenue Share (%), by Production Analysis 2025 & 2033
- Figure 52: Asia Pacific Hydroponics Industry Revenue (Million), by Consumption Analysis 2025 & 2033
- Figure 53: Asia Pacific Hydroponics Industry Revenue Share (%), by Consumption Analysis 2025 & 2033
- Figure 54: Asia Pacific Hydroponics Industry Revenue (Million), by Import Market Analysis (Value & Volume) 2025 & 2033
- Figure 55: Asia Pacific Hydroponics Industry Revenue Share (%), by Import Market Analysis (Value & Volume) 2025 & 2033
- Figure 56: Asia Pacific Hydroponics Industry Revenue (Million), by Export Market Analysis (Value & Volume) 2025 & 2033
- Figure 57: Asia Pacific Hydroponics Industry Revenue Share (%), by Export Market Analysis (Value & Volume) 2025 & 2033
- Figure 58: Asia Pacific Hydroponics Industry Revenue (Million), by Price Trend Analysis 2025 & 2033
- Figure 59: Asia Pacific Hydroponics Industry Revenue Share (%), by Price Trend Analysis 2025 & 2033
- Figure 60: Asia Pacific Hydroponics Industry Revenue (Million), by Country 2025 & 2033
- Figure 61: Asia Pacific Hydroponics Industry Revenue Share (%), by Country 2025 & 2033
List of Tables
- Table 1: Global Hydroponics Industry Revenue Million Forecast, by Production Analysis 2020 & 2033
- Table 2: Global Hydroponics Industry Revenue Million Forecast, by Consumption Analysis 2020 & 2033
- Table 3: Global Hydroponics Industry Revenue Million Forecast, by Import Market Analysis (Value & Volume) 2020 & 2033
- Table 4: Global Hydroponics Industry Revenue Million Forecast, by Export Market Analysis (Value & Volume) 2020 & 2033
- Table 5: Global Hydroponics Industry Revenue Million Forecast, by Price Trend Analysis 2020 & 2033
- Table 6: Global Hydroponics Industry Revenue Million Forecast, by Region 2020 & 2033
- Table 7: Global Hydroponics Industry Revenue Million Forecast, by Production Analysis 2020 & 2033
- Table 8: Global Hydroponics Industry Revenue Million Forecast, by Consumption Analysis 2020 & 2033
- Table 9: Global Hydroponics Industry Revenue Million Forecast, by Import Market Analysis (Value & Volume) 2020 & 2033
- Table 10: Global Hydroponics Industry Revenue Million Forecast, by Export Market Analysis (Value & Volume) 2020 & 2033
- Table 11: Global Hydroponics Industry Revenue Million Forecast, by Price Trend Analysis 2020 & 2033
- Table 12: Global Hydroponics Industry Revenue Million Forecast, by Country 2020 & 2033
- Table 13: United States Hydroponics Industry Revenue (Million) Forecast, by Application 2020 & 2033
- Table 14: Canada Hydroponics Industry Revenue (Million) Forecast, by Application 2020 & 2033
- Table 15: Mexico Hydroponics Industry Revenue (Million) Forecast, by Application 2020 & 2033
- Table 16: Global Hydroponics Industry Revenue Million Forecast, by Production Analysis 2020 & 2033
- Table 17: Global Hydroponics Industry Revenue Million Forecast, by Consumption Analysis 2020 & 2033
- Table 18: Global Hydroponics Industry Revenue Million Forecast, by Import Market Analysis (Value & Volume) 2020 & 2033
- Table 19: Global Hydroponics Industry Revenue Million Forecast, by Export Market Analysis (Value & Volume) 2020 & 2033
- Table 20: Global Hydroponics Industry Revenue Million Forecast, by Price Trend Analysis 2020 & 2033
- Table 21: Global Hydroponics Industry Revenue Million Forecast, by Country 2020 & 2033
- Table 22: Brazil Hydroponics Industry Revenue (Million) Forecast, by Application 2020 & 2033
- Table 23: Argentina Hydroponics Industry Revenue (Million) Forecast, by Application 2020 & 2033
- Table 24: Rest of South America Hydroponics Industry Revenue (Million) Forecast, by Application 2020 & 2033
- Table 25: Global Hydroponics Industry Revenue Million Forecast, by Production Analysis 2020 & 2033
- Table 26: Global Hydroponics Industry Revenue Million Forecast, by Consumption Analysis 2020 & 2033
- Table 27: Global Hydroponics Industry Revenue Million Forecast, by Import Market Analysis (Value & Volume) 2020 & 2033
- Table 28: Global Hydroponics Industry Revenue Million Forecast, by Export Market Analysis (Value & Volume) 2020 & 2033
- Table 29: Global Hydroponics Industry Revenue Million Forecast, by Price Trend Analysis 2020 & 2033
- Table 30: Global Hydroponics Industry Revenue Million Forecast, by Country 2020 & 2033
- Table 31: United Kingdom Hydroponics Industry Revenue (Million) Forecast, by Application 2020 & 2033
- Table 32: Germany Hydroponics Industry Revenue (Million) Forecast, by Application 2020 & 2033
- Table 33: France Hydroponics Industry Revenue (Million) Forecast, by Application 2020 & 2033
- Table 34: Italy Hydroponics Industry Revenue (Million) Forecast, by Application 2020 & 2033
- Table 35: Spain Hydroponics Industry Revenue (Million) Forecast, by Application 2020 & 2033
- Table 36: Russia Hydroponics Industry Revenue (Million) Forecast, by Application 2020 & 2033
- Table 37: Benelux Hydroponics Industry Revenue (Million) Forecast, by Application 2020 & 2033
- Table 38: Nordics Hydroponics Industry Revenue (Million) Forecast, by Application 2020 & 2033
- Table 39: Rest of Europe Hydroponics Industry Revenue (Million) Forecast, by Application 2020 & 2033
- Table 40: Global Hydroponics Industry Revenue Million Forecast, by Production Analysis 2020 & 2033
- Table 41: Global Hydroponics Industry Revenue Million Forecast, by Consumption Analysis 2020 & 2033
- Table 42: Global Hydroponics Industry Revenue Million Forecast, by Import Market Analysis (Value & Volume) 2020 & 2033
- Table 43: Global Hydroponics Industry Revenue Million Forecast, by Export Market Analysis (Value & Volume) 2020 & 2033
- Table 44: Global Hydroponics Industry Revenue Million Forecast, by Price Trend Analysis 2020 & 2033
- Table 45: Global Hydroponics Industry Revenue Million Forecast, by Country 2020 & 2033
- Table 46: Turkey Hydroponics Industry Revenue (Million) Forecast, by Application 2020 & 2033
- Table 47: Israel Hydroponics Industry Revenue (Million) Forecast, by Application 2020 & 2033
- Table 48: GCC Hydroponics Industry Revenue (Million) Forecast, by Application 2020 & 2033
- Table 49: North Africa Hydroponics Industry Revenue (Million) Forecast, by Application 2020 & 2033
- Table 50: South Africa Hydroponics Industry Revenue (Million) Forecast, by Application 2020 & 2033
- Table 51: Rest of Middle East & Africa Hydroponics Industry Revenue (Million) Forecast, by Application 2020 & 2033
- Table 52: Global Hydroponics Industry Revenue Million Forecast, by Production Analysis 2020 & 2033
- Table 53: Global Hydroponics Industry Revenue Million Forecast, by Consumption Analysis 2020 & 2033
- Table 54: Global Hydroponics Industry Revenue Million Forecast, by Import Market Analysis (Value & Volume) 2020 & 2033
- Table 55: Global Hydroponics Industry Revenue Million Forecast, by Export Market Analysis (Value & Volume) 2020 & 2033
- Table 56: Global Hydroponics Industry Revenue Million Forecast, by Price Trend Analysis 2020 & 2033
- Table 57: Global Hydroponics Industry Revenue Million Forecast, by Country 2020 & 2033
- Table 58: China Hydroponics Industry Revenue (Million) Forecast, by Application 2020 & 2033
- Table 59: India Hydroponics Industry Revenue (Million) Forecast, by Application 2020 & 2033
- Table 60: Japan Hydroponics Industry Revenue (Million) Forecast, by Application 2020 & 2033
- Table 61: South Korea Hydroponics Industry Revenue (Million) Forecast, by Application 2020 & 2033
- Table 62: ASEAN Hydroponics Industry Revenue (Million) Forecast, by Application 2020 & 2033
- Table 63: Oceania Hydroponics Industry Revenue (Million) Forecast, by Application 2020 & 2033
- Table 64: Rest of Asia Pacific Hydroponics Industry Revenue (Million) Forecast, by Application 2020 & 2033
Frequently Asked Questions
1. What is the projected Compound Annual Growth Rate (CAGR) of the Hydroponics Industry?
The projected CAGR is approximately 7.80%.
2. Which companies are prominent players in the Hydroponics Industry?
Key companies in the market include 4 FreshBox Farms, 1 Bright Farms, 3 Pegasus Agritech, Hydroponic Crop Producers, 5 Thanet Eart, 2 Village Farms International Inc.
3. What are the main segments of the Hydroponics Industry?
The market segments include Production Analysis, Consumption Analysis, Import Market Analysis (Value & Volume), Export Market Analysis (Value & Volume), Price Trend Analysis.
4. Can you provide details about the market size?
The market size is estimated to be USD 5.06 Million as of 2022.
5. What are some drivers contributing to market growth?
Need for Custom Product Development; Use of CROs for Regulatory Services.
6. What are the notable trends driving market growth?
Higher Consumption of Salads and Exotic Vegetables.
7. Are there any restraints impacting market growth?
Data and Cyber Security Concerns; Lack of Experts and Professionals in this Industry.
8. Can you provide examples of recent developments in the market?
March 2024: INSONGREEN announced a significant expansion of its hydroponic and vertical greenhouse production in the Middle East and Africa. This initiative aims to tackle regional water scarcity and food security challenges by utilizing advanced agricultural technologies for sustainable development.
9. What pricing options are available for accessing the report?
Pricing options include single-user, multi-user, and enterprise licenses priced at USD 4750, USD 5250, and USD 8750 respectively.
10. Is the market size provided in terms of value or volume?
The market size is provided in terms of value, measured in Million.
11. Are there any specific market keywords associated with the report?
Yes, the market keyword associated with the report is "Hydroponics Industry," which aids in identifying and referencing the specific market segment covered.
12. How do I determine which pricing option suits my needs best?
The pricing options vary based on user requirements and access needs. Individual users may opt for single-user licenses, while businesses requiring broader access may choose multi-user or enterprise licenses for cost-effective access to the report.
13. Are there any additional resources or data provided in the Hydroponics Industry report?
While the report offers comprehensive insights, it's advisable to review the specific contents or supplementary materials provided to ascertain if additional resources or data are available.
14. How can I stay updated on further developments or reports in the Hydroponics Industry?
To stay informed about further developments, trends, and reports in the Hydroponics Industry, consider subscribing to industry newsletters, following relevant companies and organizations, or regularly checking reputable industry news sources and publications.
Methodology
Step 1 - Identification of Relevant Samples Size from Population Database


Step 2 - Approaches for Defining Global Market Size (Value, Volume* & Price*)

Note*: In applicable scenarios
Step 3 - Data Sources
Primary Research
- Web Analytics
- Survey Reports
- Research Institute
- Latest Research Reports
- Opinion Leaders
Secondary Research
- Annual Reports
- White Paper
- Latest Press Release
- Industry Association
- Paid Database
- Investor Presentations

Step 4 - Data Triangulation
Involves using different sources of information in order to increase the validity of a study
These sources are likely to be stakeholders in a program - participants, other researchers, program staff, other community members, and so on.
Then we put all data in single framework & apply various statistical tools to find out the dynamic on the market.
During the analysis stage, feedback from the stakeholder groups would be compared to determine areas of agreement as well as areas of divergence