

Key Insights
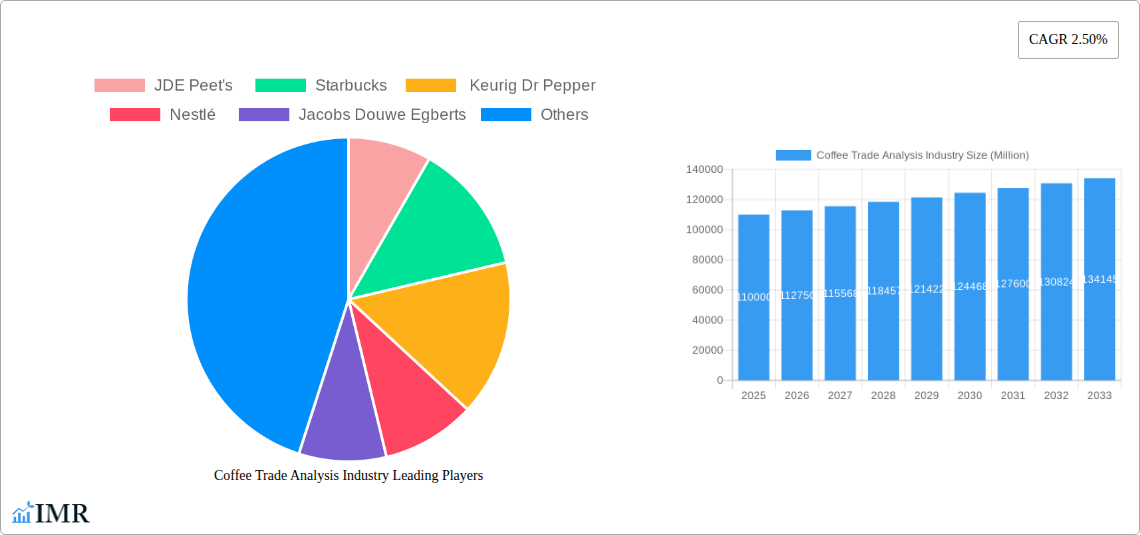
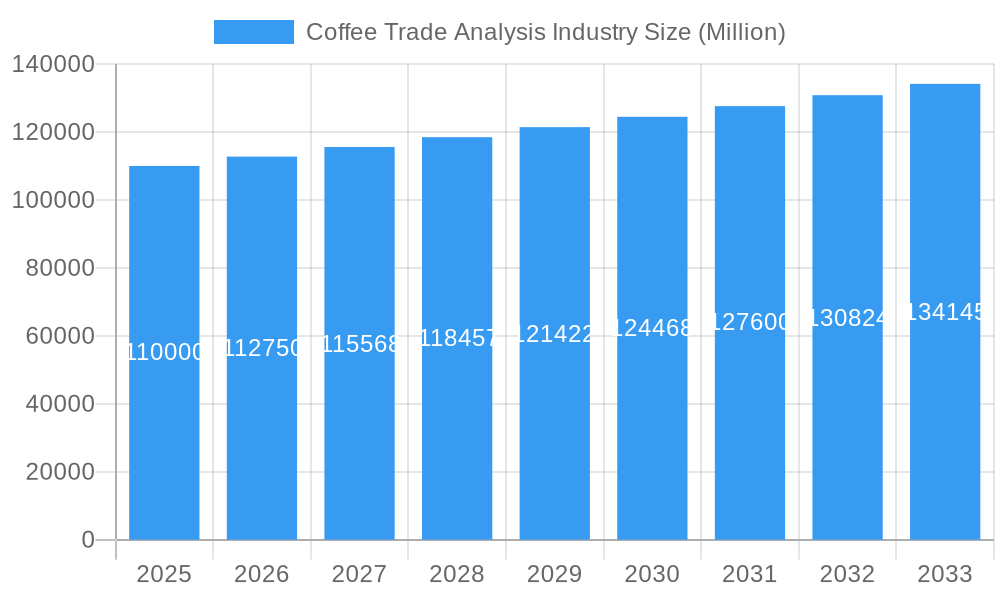
The global Coffee Trade Analysis Industry is poised for steady expansion, projected to reach an estimated market size of $110,000 million by 2025, with a Compound Annual Growth Rate (CAGR) of 2.50% extending through 2033. This growth is underpinned by a confluence of escalating consumer demand for premium and specialty coffee, driven by evolving taste preferences and a growing appreciation for the origin and ethical sourcing of beans. Key market drivers include the increasing prevalence of coffee culture, particularly in emerging economies, coupled with the innovation in brewing technologies and ready-to-drink (RTD) coffee products that cater to busy lifestyles. The expansion of coffee shops, both independent and chain, further fuels consumption and market penetration.
Coffee Trade Analysis Industry Market Size (In Billion)
However, the industry faces several restraints that could temper its growth trajectory. These include volatile raw coffee bean prices, influenced by climate change, geopolitical instability in producing regions, and currency fluctuations, which can impact profitability for traders and manufacturers. Additionally, increasing regulatory scrutiny regarding sustainability practices and fair trade can add to operational complexities and costs. The competitive landscape is characterized by the presence of major global players like Nestlé, Starbucks, and JDE Peet's, alongside a burgeoning number of niche and artisanal brands, intensifying competition and potentially leading to price pressures. Trends such as the surge in plant-based milk alternatives and the demand for sustainable packaging solutions are also reshaping consumer choices and industry practices.
Coffee Trade Analysis Industry Company Market Share
Comprehensive Coffee Trade Analysis Industry Report: Market Dynamics, Growth, and Future Outlook (2019-2033)
This in-depth Coffee Trade Analysis Industry Report offers a strategic overview of the global coffee market, covering production, consumption, imports, exports, and pricing trends from 2019 to 2033. With a base year of 2025, the report provides critical insights for coffee businesses, coffee importers, coffee exporters, coffee producers, and coffee roasters. It delves into parent and child markets, analyzing key players like JDE Peet's, Starbucks, Keurig Dr Pepper, Nestlé, and Jacobs Douwe Egberts. All quantitative values are presented in Million units.
Coffee Trade Analysis Industry Market Dynamics & Structure
The global coffee trade market is characterized by moderate concentration, with a few multinational corporations like Nestlé and Starbucks holding significant market share. Technological innovation in areas such as sustainable farming practices, advanced processing techniques, and blockchain-enabled supply chain traceability are key drivers of market evolution. Regulatory frameworks, including fair trade certifications and environmental standards, are increasingly shaping market entry and operational strategies. Competitive product substitutes, such as tea and energy drinks, exert some pressure, but the unique appeal of coffee continues to drive demand. End-user demographics are shifting, with growing demand from emerging economies and a rise in health-conscious consumers seeking premium and ethically sourced coffee. Mergers and acquisitions (M&A) trends indicate consolidation and strategic alliances aimed at expanding market reach and securing supply chains. For instance, the past year has seen several smaller acquisitions in the specialty coffee segment.
- Market Concentration: Dominated by a few key players, but with a growing number of agile specialty coffee brands.
- Technological Innovation: Focus on sustainable agriculture, improved roasting technologies, and enhanced consumer experiences.
- Regulatory Landscape: Increasing emphasis on ethical sourcing, environmental impact, and food safety standards.
- Competitive Substitutes: While present, the unique cultural and functional appeal of coffee remains strong.
- End-User Demographics: Growing middle class in developing nations and increasing demand for convenience and premiumization.
- M&A Trends: Strategic acquisitions to gain market share, access new technologies, and strengthen supply chains.
Coffee Trade Analysis Industry Growth Trends & Insights
The global coffee market size is projected to experience robust growth, driven by evolving consumer preferences and increasing global disposable incomes. The adoption rate of innovative coffee products, such as single-serve pods and plant-based coffee creamers, continues to rise. Technological disruptions, including automated farming and advanced roasting technologies, are enhancing efficiency and product quality across the value chain. Consumer behavior shifts are evident, with a growing preference for sustainable, ethically sourced, and premium coffee varieties. The compound annual growth rate (CAGR) for the global coffee market is estimated at xx%, with significant penetration in untapped markets. The shift towards at-home coffee consumption, spurred by changing work habits, further bolsters market expansion. The demand for instant coffee, particularly in Asian markets, is a significant growth driver.
- Market Size Evolution: Consistent upward trajectory driven by population growth and increasing consumption per capita.
- Adoption Rates: High for convenience-driven products and premium/specialty coffee segments.
- Technological Disruptions: Automation in farming and processing, AI in demand forecasting, and advanced brewing technologies.
- Consumer Behavior Shifts: Rise of health and wellness trends, ethical consumerism, and demand for personalized coffee experiences.
- Market Penetration: Significant opportunities in emerging economies across Asia and Africa.
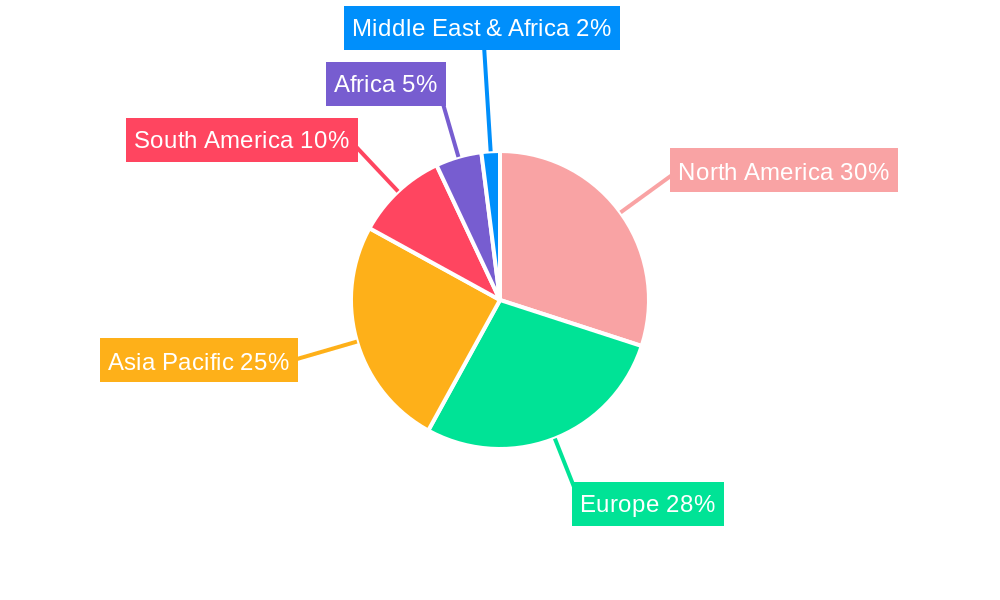
Dominant Regions, Countries, or Segments in Coffee Trade Analysis Industry
The global coffee trade is significantly influenced by various regions and countries.
Production Analysis: South America, particularly Brazil, remains the dominant force in coffee production, accounting for approximately 35% of the global volume. Vietnam is a major producer of Robusta coffee. The coffee bean market is segmented into Arabica and Robusta, with Arabica often commanding higher prices due to its nuanced flavor profiles.
Consumption Analysis: Europe and North America represent the largest coffee-consuming regions, driven by established coffee cultures and high disposable incomes. However, the fastest-growing consumption rates are observed in emerging markets within Asia. The coffee consumption market is witnessing a surge in demand for specialty coffee.
Import Market Analysis (Value & Volume): The United States and the European Union are the largest coffee import markets by both value and volume. Germany, Italy, and France are key European importers. The coffee import market is highly sensitive to global supply and demand dynamics.
Export Market Analysis (Value & Volume): Brazil leads global coffee exports, followed by Vietnam, Colombia, and Indonesia. India has shown significant growth in its coffee export market, particularly in instant coffee. The value of exports is often higher for specialty and single-origin beans.
Price Trend Analysis: Coffee prices are volatile, influenced by weather patterns, geopolitical events, and global supply. The coffee price trend analysis reveals a general upward trend driven by increased demand and rising production costs. Futures markets play a crucial role in price discovery.
- Dominant Production Region: South America (Brazil)
- Largest Importing Regions: Europe & North America
- Fastest Growing Consumption Markets: Asia
- Leading Export Nations: Brazil, Vietnam, Colombia
- Key Price Influencers: Weather, supply chain disruptions, global demand.
Coffee Trade Analysis Industry Product Landscape
The coffee product landscape is diverse, ranging from whole beans and ground coffee to instant coffee, ready-to-drink (RTD) beverages, and coffee pods. Product innovations are focused on enhancing convenience, improving flavor profiles, and addressing health and sustainability concerns. Unique selling propositions often lie in single-origin sourcing, artisanal roasting, and ethical production methods. Technological advancements in brewing equipment, such as smart coffee makers and cold brew systems, are also shaping the market. The rise of plant-based coffee alternatives and functional coffee with added health benefits represents a significant innovation trend.
Key Drivers, Barriers & Challenges in Coffee Trade Analysis Industry
Key Drivers:
- Growing global demand for coffee: Driven by population growth and increasing per capita consumption.
- Rising disposable incomes: Particularly in emerging economies, leading to increased spending on premium coffee.
- Innovation in product offerings: Development of new flavors, brewing methods, and convenient formats.
- Health and wellness trends: Growing interest in coffee's perceived health benefits and functional ingredients.
- Ethical and sustainable sourcing trends: Increasing consumer preference for responsibly produced coffee.
Barriers & Challenges:
- Price volatility and supply chain disruptions: Susceptibility to weather events, geopolitical instability, and logistical issues.
- Climate change impact on coffee cultivation: Threatens crop yields and quality in key growing regions.
- Intense competition: From both established brands and emerging specialty coffee players.
- Fluctuating raw material costs: Affecting profitability for producers and distributors.
- Regulatory complexities: Varying import/export regulations and quality standards across countries.
- Labor shortages and rising labor costs in coffee-producing regions.
Emerging Opportunities in Coffee Trade Analysis Industry
Emerging opportunities within the coffee trade industry are abundant. The burgeoning specialty coffee market continues to expand, with consumers willing to pay a premium for unique flavor profiles and ethically sourced beans. Untapped markets in Southeast Asia and Africa present significant growth potential as disposable incomes rise and coffee culture takes root. Innovative applications, such as coffee-infused food products and premium coffee-based cosmetics, are gaining traction. Evolving consumer preferences for plant-based alternatives and functional beverages offer avenues for product diversification. The demand for traceable and transparent supply chains also opens doors for blockchain-enabled solutions and direct-to-consumer models.
Growth Accelerators in the Coffee Trade Analysis Industry Industry
Several catalysts are accelerating growth in the coffee trade industry. Technological breakthroughs in precision agriculture and sustainable farming are improving yields and reducing environmental impact. Strategic partnerships between coffee producers, roasters, and retailers are enhancing market access and brand visibility. Furthermore, market expansion strategies, including the development of new product lines and entry into underserved geographical regions, are propelling overall growth. The increasing popularity of coffee shop culture globally, coupled with the rise of home brewing technologies, creates a dual-engine for market expansion. Investment in research and development for new coffee varieties with enhanced resilience and flavor profiles is also a key accelerator.
Key Players Shaping the Coffee Trade Analysis Industry Market
- JDE Peet's
- Starbucks
- Keurig Dr Pepper
- Nestlé
- Jacobs Douwe Egberts
Notable Milestones in Coffee Trade Analysis Industry Sector
- January 2023: Coffee exported from India was up by nearly 2% to 400,000 tons in 2022, with the rise in instant coffee exports and re-exports in the country. The export of instant coffee increased by 16.73% to 35,810 tons in 2022 from 29,819 tons in the previous year.
- December 2022: The US Government, through the US Agency for International Development (USAID), launched the Indonesia Coffee Enterprise Resilience Initiative (Resilient coffee) to support coffee farmers in Indonesia.
- October 2022: Nestlé committed over USD 1 billion to a sustainable coffee farming plan. The brand plans to improve the sustainability of coffee farming and help farmers transition to regenerative agriculture practices.
In-Depth Coffee Trade Analysis Industry Market Outlook
The coffee trade analysis industry market outlook is exceptionally positive, driven by sustained demand and innovative growth strategies. Key growth accelerators include the continued expansion of the specialty coffee segment, increasing adoption of sustainable and ethical sourcing practices, and the growing penetration in emerging markets. The market is poised for significant expansion as companies invest in technological advancements for improved efficiency and product quality. Strategic partnerships and market expansion initiatives will further fuel this growth. The evolving consumer preference for premium, convenient, and health-conscious coffee options will continue to shape product development and market strategies, ensuring a robust and dynamic future for the global coffee trade.
Coffee Trade Analysis Industry Segmentation
- 1. Production Analysis
- 2. Consumption Analysis
- 3. Import Market Analysis (Value & Volume)
- 4. Export Market Analysis (Value & Volume)
- 5. Price Trend Analysis
Coffee Trade Analysis Industry Segmentation By Geography
-
1. North America
- 1.1. United States
- 1.2. Canada
- 1.3. Mexico
-
2. Europe
- 2.1. United Kingdom
- 2.2. Denmark
- 2.3. Netherlands
- 2.4. Germany
- 2.5. Norway
- 2.6. Sweden
-
3. Asia Pacific
- 3.1. China
- 3.2. India
- 3.3. Japan
- 3.4. Indonesia
- 3.5. Philippines
-
4. South America
- 4.1. Brazil
- 4.2. Argentina
-
5. Africa
- 5.1. South Africa
Coffee Trade Analysis Industry Regional Market Share
Geographic Coverage of Coffee Trade Analysis Industry
Coffee Trade Analysis Industry REPORT HIGHLIGHTS
| Aspects | Details |
|---|---|
| Study Period | 2020-2034 |
| Base Year | 2025 |
| Estimated Year | 2026 |
| Forecast Period | 2026-2034 |
| Historical Period | 2020-2025 |
| Growth Rate | CAGR of 2.50% from 2020-2034 |
| Segmentation |
|
Table of Contents
- 1. Introduction
- 1.1. Research Scope
- 1.2. Market Segmentation
- 1.3. Research Objective
- 1.4. Definitions and Assumptions
- 2. Executive Summary
- 2.1. Market Snapshot
- 3. Market Dynamics
- 3.1. Market Drivers
- 3.2. Market Restrains
- 3.3. Market Trends
- 3.4. Market Opportunities
- 4. Market Factor Analysis
- 4.1. Porters Five Forces
- 4.1.1. Bargaining Power of Suppliers
- 4.1.2. Bargaining Power of Buyers
- 4.1.3. Threat of New Entrants
- 4.1.4. Threat of Substitutes
- 4.1.5. Competitive Rivalry
- 4.2. PESTEL analysis
- 4.3. BCG Analysis
- 4.3.1. Stars (High Growth, High Market Share)
- 4.3.2. Cash Cows (Low Growth, High Market Share)
- 4.3.3. Question Mark (High Growth, Low Market Share)
- 4.3.4. Dogs (Low Growth, Low Market Share)
- 4.4. Ansoff Matrix Analysis
- 4.5. Supply Chain Analysis
- 4.6. Regulatory Landscape
- 4.7. Current Market Potential and Opportunity Assessment (TAM–SAM–SOM Framework)
- 4.8. IMR Analyst Note
- 4.1. Porters Five Forces
- 5. Market Analysis, Insights and Forecast 2021-2033
- 5.1. Market Analysis, Insights and Forecast - by Production Analysis
- 5.2. Market Analysis, Insights and Forecast - by Consumption Analysis
- 5.3. Market Analysis, Insights and Forecast - by Import Market Analysis (Value & Volume)
- 5.4. Market Analysis, Insights and Forecast - by Export Market Analysis (Value & Volume)
- 5.5. Market Analysis, Insights and Forecast - by Price Trend Analysis
- 5.6. Market Analysis, Insights and Forecast - by Region
- 5.6.1. North America
- 5.6.2. Europe
- 5.6.3. Asia Pacific
- 5.6.4. South America
- 5.6.5. Africa
- 6. Global Coffee Trade Analysis Industry Analysis, Insights and Forecast, 2021-2033
- 6.1. Market Analysis, Insights and Forecast - by Production Analysis
- 6.2. Market Analysis, Insights and Forecast - by Consumption Analysis
- 6.3. Market Analysis, Insights and Forecast - by Import Market Analysis (Value & Volume)
- 6.4. Market Analysis, Insights and Forecast - by Export Market Analysis (Value & Volume)
- 6.5. Market Analysis, Insights and Forecast - by Price Trend Analysis
- 7. North America Coffee Trade Analysis Industry Analysis, Insights and Forecast, 2020-2032
- 7.1. Market Analysis, Insights and Forecast - by Production Analysis
- 7.2. Market Analysis, Insights and Forecast - by Consumption Analysis
- 7.3. Market Analysis, Insights and Forecast - by Import Market Analysis (Value & Volume)
- 7.4. Market Analysis, Insights and Forecast - by Export Market Analysis (Value & Volume)
- 7.5. Market Analysis, Insights and Forecast - by Price Trend Analysis
- 8. Europe Coffee Trade Analysis Industry Analysis, Insights and Forecast, 2020-2032
- 8.1. Market Analysis, Insights and Forecast - by Production Analysis
- 8.2. Market Analysis, Insights and Forecast - by Consumption Analysis
- 8.3. Market Analysis, Insights and Forecast - by Import Market Analysis (Value & Volume)
- 8.4. Market Analysis, Insights and Forecast - by Export Market Analysis (Value & Volume)
- 8.5. Market Analysis, Insights and Forecast - by Price Trend Analysis
- 9. Asia Pacific Coffee Trade Analysis Industry Analysis, Insights and Forecast, 2020-2032
- 9.1. Market Analysis, Insights and Forecast - by Production Analysis
- 9.2. Market Analysis, Insights and Forecast - by Consumption Analysis
- 9.3. Market Analysis, Insights and Forecast - by Import Market Analysis (Value & Volume)
- 9.4. Market Analysis, Insights and Forecast - by Export Market Analysis (Value & Volume)
- 9.5. Market Analysis, Insights and Forecast - by Price Trend Analysis
- 10. South America Coffee Trade Analysis Industry Analysis, Insights and Forecast, 2020-2032
- 10.1. Market Analysis, Insights and Forecast - by Production Analysis
- 10.2. Market Analysis, Insights and Forecast - by Consumption Analysis
- 10.3. Market Analysis, Insights and Forecast - by Import Market Analysis (Value & Volume)
- 10.4. Market Analysis, Insights and Forecast - by Export Market Analysis (Value & Volume)
- 10.5. Market Analysis, Insights and Forecast - by Price Trend Analysis
- 11. Africa Coffee Trade Analysis Industry Analysis, Insights and Forecast, 2020-2032
- 11.1. Market Analysis, Insights and Forecast - by Production Analysis
- 11.2. Market Analysis, Insights and Forecast - by Consumption Analysis
- 11.3. Market Analysis, Insights and Forecast - by Import Market Analysis (Value & Volume)
- 11.4. Market Analysis, Insights and Forecast - by Export Market Analysis (Value & Volume)
- 11.5. Market Analysis, Insights and Forecast - by Price Trend Analysis
- 12. Competitive Analysis
- 12.1. Company Profiles
- 12.1.1 JDE Peet's
- 12.1.1.1. Company Overview
- 12.1.1.2. Products
- 12.1.1.3. Company Financials
- 12.1.1.4. SWOT Analysis
- 12.1.2 Starbucks
- 12.1.2.1. Company Overview
- 12.1.2.2. Products
- 12.1.2.3. Company Financials
- 12.1.2.4. SWOT Analysis
- 12.1.3 Keurig Dr Pepper
- 12.1.3.1. Company Overview
- 12.1.3.2. Products
- 12.1.3.3. Company Financials
- 12.1.3.4. SWOT Analysis
- 12.1.4 Nestlé
- 12.1.4.1. Company Overview
- 12.1.4.2. Products
- 12.1.4.3. Company Financials
- 12.1.4.4. SWOT Analysis
- 12.1.5 Jacobs Douwe Egberts
- 12.1.5.1. Company Overview
- 12.1.5.2. Products
- 12.1.5.3. Company Financials
- 12.1.5.4. SWOT Analysis
- 12.1.1 JDE Peet's
- 12.2. Market Entropy
- 12.2.1 Company's Key Areas Served
- 12.2.2 Recent Developments
- 12.3. Company Market Share Analysis 2025
- 12.3.1 Top 5 Companies Market Share Analysis
- 12.3.2 Top 3 Companies Market Share Analysis
- 12.4. List of Potential Customers
- 13. Research Methodology
List of Figures
- Figure 1: Global Coffee Trade Analysis Industry Revenue Breakdown (Million, %) by Region 2025 & 2033
- Figure 2: North America Coffee Trade Analysis Industry Revenue (Million), by Production Analysis 2025 & 2033
- Figure 3: North America Coffee Trade Analysis Industry Revenue Share (%), by Production Analysis 2025 & 2033
- Figure 4: North America Coffee Trade Analysis Industry Revenue (Million), by Consumption Analysis 2025 & 2033
- Figure 5: North America Coffee Trade Analysis Industry Revenue Share (%), by Consumption Analysis 2025 & 2033
- Figure 6: North America Coffee Trade Analysis Industry Revenue (Million), by Import Market Analysis (Value & Volume) 2025 & 2033
- Figure 7: North America Coffee Trade Analysis Industry Revenue Share (%), by Import Market Analysis (Value & Volume) 2025 & 2033
- Figure 8: North America Coffee Trade Analysis Industry Revenue (Million), by Export Market Analysis (Value & Volume) 2025 & 2033
- Figure 9: North America Coffee Trade Analysis Industry Revenue Share (%), by Export Market Analysis (Value & Volume) 2025 & 2033
- Figure 10: North America Coffee Trade Analysis Industry Revenue (Million), by Price Trend Analysis 2025 & 2033
- Figure 11: North America Coffee Trade Analysis Industry Revenue Share (%), by Price Trend Analysis 2025 & 2033
- Figure 12: North America Coffee Trade Analysis Industry Revenue (Million), by Country 2025 & 2033
- Figure 13: North America Coffee Trade Analysis Industry Revenue Share (%), by Country 2025 & 2033
- Figure 14: Europe Coffee Trade Analysis Industry Revenue (Million), by Production Analysis 2025 & 2033
- Figure 15: Europe Coffee Trade Analysis Industry Revenue Share (%), by Production Analysis 2025 & 2033
- Figure 16: Europe Coffee Trade Analysis Industry Revenue (Million), by Consumption Analysis 2025 & 2033
- Figure 17: Europe Coffee Trade Analysis Industry Revenue Share (%), by Consumption Analysis 2025 & 2033
- Figure 18: Europe Coffee Trade Analysis Industry Revenue (Million), by Import Market Analysis (Value & Volume) 2025 & 2033
- Figure 19: Europe Coffee Trade Analysis Industry Revenue Share (%), by Import Market Analysis (Value & Volume) 2025 & 2033
- Figure 20: Europe Coffee Trade Analysis Industry Revenue (Million), by Export Market Analysis (Value & Volume) 2025 & 2033
- Figure 21: Europe Coffee Trade Analysis Industry Revenue Share (%), by Export Market Analysis (Value & Volume) 2025 & 2033
- Figure 22: Europe Coffee Trade Analysis Industry Revenue (Million), by Price Trend Analysis 2025 & 2033
- Figure 23: Europe Coffee Trade Analysis Industry Revenue Share (%), by Price Trend Analysis 2025 & 2033
- Figure 24: Europe Coffee Trade Analysis Industry Revenue (Million), by Country 2025 & 2033
- Figure 25: Europe Coffee Trade Analysis Industry Revenue Share (%), by Country 2025 & 2033
- Figure 26: Asia Pacific Coffee Trade Analysis Industry Revenue (Million), by Production Analysis 2025 & 2033
- Figure 27: Asia Pacific Coffee Trade Analysis Industry Revenue Share (%), by Production Analysis 2025 & 2033
- Figure 28: Asia Pacific Coffee Trade Analysis Industry Revenue (Million), by Consumption Analysis 2025 & 2033
- Figure 29: Asia Pacific Coffee Trade Analysis Industry Revenue Share (%), by Consumption Analysis 2025 & 2033
- Figure 30: Asia Pacific Coffee Trade Analysis Industry Revenue (Million), by Import Market Analysis (Value & Volume) 2025 & 2033
- Figure 31: Asia Pacific Coffee Trade Analysis Industry Revenue Share (%), by Import Market Analysis (Value & Volume) 2025 & 2033
- Figure 32: Asia Pacific Coffee Trade Analysis Industry Revenue (Million), by Export Market Analysis (Value & Volume) 2025 & 2033
- Figure 33: Asia Pacific Coffee Trade Analysis Industry Revenue Share (%), by Export Market Analysis (Value & Volume) 2025 & 2033
- Figure 34: Asia Pacific Coffee Trade Analysis Industry Revenue (Million), by Price Trend Analysis 2025 & 2033
- Figure 35: Asia Pacific Coffee Trade Analysis Industry Revenue Share (%), by Price Trend Analysis 2025 & 2033
- Figure 36: Asia Pacific Coffee Trade Analysis Industry Revenue (Million), by Country 2025 & 2033
- Figure 37: Asia Pacific Coffee Trade Analysis Industry Revenue Share (%), by Country 2025 & 2033
- Figure 38: South America Coffee Trade Analysis Industry Revenue (Million), by Production Analysis 2025 & 2033
- Figure 39: South America Coffee Trade Analysis Industry Revenue Share (%), by Production Analysis 2025 & 2033
- Figure 40: South America Coffee Trade Analysis Industry Revenue (Million), by Consumption Analysis 2025 & 2033
- Figure 41: South America Coffee Trade Analysis Industry Revenue Share (%), by Consumption Analysis 2025 & 2033
- Figure 42: South America Coffee Trade Analysis Industry Revenue (Million), by Import Market Analysis (Value & Volume) 2025 & 2033
- Figure 43: South America Coffee Trade Analysis Industry Revenue Share (%), by Import Market Analysis (Value & Volume) 2025 & 2033
- Figure 44: South America Coffee Trade Analysis Industry Revenue (Million), by Export Market Analysis (Value & Volume) 2025 & 2033
- Figure 45: South America Coffee Trade Analysis Industry Revenue Share (%), by Export Market Analysis (Value & Volume) 2025 & 2033
- Figure 46: South America Coffee Trade Analysis Industry Revenue (Million), by Price Trend Analysis 2025 & 2033
- Figure 47: South America Coffee Trade Analysis Industry Revenue Share (%), by Price Trend Analysis 2025 & 2033
- Figure 48: South America Coffee Trade Analysis Industry Revenue (Million), by Country 2025 & 2033
- Figure 49: South America Coffee Trade Analysis Industry Revenue Share (%), by Country 2025 & 2033
- Figure 50: Africa Coffee Trade Analysis Industry Revenue (Million), by Production Analysis 2025 & 2033
- Figure 51: Africa Coffee Trade Analysis Industry Revenue Share (%), by Production Analysis 2025 & 2033
- Figure 52: Africa Coffee Trade Analysis Industry Revenue (Million), by Consumption Analysis 2025 & 2033
- Figure 53: Africa Coffee Trade Analysis Industry Revenue Share (%), by Consumption Analysis 2025 & 2033
- Figure 54: Africa Coffee Trade Analysis Industry Revenue (Million), by Import Market Analysis (Value & Volume) 2025 & 2033
- Figure 55: Africa Coffee Trade Analysis Industry Revenue Share (%), by Import Market Analysis (Value & Volume) 2025 & 2033
- Figure 56: Africa Coffee Trade Analysis Industry Revenue (Million), by Export Market Analysis (Value & Volume) 2025 & 2033
- Figure 57: Africa Coffee Trade Analysis Industry Revenue Share (%), by Export Market Analysis (Value & Volume) 2025 & 2033
- Figure 58: Africa Coffee Trade Analysis Industry Revenue (Million), by Price Trend Analysis 2025 & 2033
- Figure 59: Africa Coffee Trade Analysis Industry Revenue Share (%), by Price Trend Analysis 2025 & 2033
- Figure 60: Africa Coffee Trade Analysis Industry Revenue (Million), by Country 2025 & 2033
- Figure 61: Africa Coffee Trade Analysis Industry Revenue Share (%), by Country 2025 & 2033
List of Tables
- Table 1: Global Coffee Trade Analysis Industry Revenue Million Forecast, by Production Analysis 2020 & 2033
- Table 2: Global Coffee Trade Analysis Industry Revenue Million Forecast, by Consumption Analysis 2020 & 2033
- Table 3: Global Coffee Trade Analysis Industry Revenue Million Forecast, by Import Market Analysis (Value & Volume) 2020 & 2033
- Table 4: Global Coffee Trade Analysis Industry Revenue Million Forecast, by Export Market Analysis (Value & Volume) 2020 & 2033
- Table 5: Global Coffee Trade Analysis Industry Revenue Million Forecast, by Price Trend Analysis 2020 & 2033
- Table 6: Global Coffee Trade Analysis Industry Revenue Million Forecast, by Region 2020 & 2033
- Table 7: Global Coffee Trade Analysis Industry Revenue Million Forecast, by Production Analysis 2020 & 2033
- Table 8: Global Coffee Trade Analysis Industry Revenue Million Forecast, by Consumption Analysis 2020 & 2033
- Table 9: Global Coffee Trade Analysis Industry Revenue Million Forecast, by Import Market Analysis (Value & Volume) 2020 & 2033
- Table 10: Global Coffee Trade Analysis Industry Revenue Million Forecast, by Export Market Analysis (Value & Volume) 2020 & 2033
- Table 11: Global Coffee Trade Analysis Industry Revenue Million Forecast, by Price Trend Analysis 2020 & 2033
- Table 12: Global Coffee Trade Analysis Industry Revenue Million Forecast, by Country 2020 & 2033
- Table 13: United States Coffee Trade Analysis Industry Revenue (Million) Forecast, by Application 2020 & 2033
- Table 14: Canada Coffee Trade Analysis Industry Revenue (Million) Forecast, by Application 2020 & 2033
- Table 15: Mexico Coffee Trade Analysis Industry Revenue (Million) Forecast, by Application 2020 & 2033
- Table 16: Global Coffee Trade Analysis Industry Revenue Million Forecast, by Production Analysis 2020 & 2033
- Table 17: Global Coffee Trade Analysis Industry Revenue Million Forecast, by Consumption Analysis 2020 & 2033
- Table 18: Global Coffee Trade Analysis Industry Revenue Million Forecast, by Import Market Analysis (Value & Volume) 2020 & 2033
- Table 19: Global Coffee Trade Analysis Industry Revenue Million Forecast, by Export Market Analysis (Value & Volume) 2020 & 2033
- Table 20: Global Coffee Trade Analysis Industry Revenue Million Forecast, by Price Trend Analysis 2020 & 2033
- Table 21: Global Coffee Trade Analysis Industry Revenue Million Forecast, by Country 2020 & 2033
- Table 22: United Kingdom Coffee Trade Analysis Industry Revenue (Million) Forecast, by Application 2020 & 2033
- Table 23: Denmark Coffee Trade Analysis Industry Revenue (Million) Forecast, by Application 2020 & 2033
- Table 24: Netherlands Coffee Trade Analysis Industry Revenue (Million) Forecast, by Application 2020 & 2033
- Table 25: Germany Coffee Trade Analysis Industry Revenue (Million) Forecast, by Application 2020 & 2033
- Table 26: Norway Coffee Trade Analysis Industry Revenue (Million) Forecast, by Application 2020 & 2033
- Table 27: Sweden Coffee Trade Analysis Industry Revenue (Million) Forecast, by Application 2020 & 2033
- Table 28: Global Coffee Trade Analysis Industry Revenue Million Forecast, by Production Analysis 2020 & 2033
- Table 29: Global Coffee Trade Analysis Industry Revenue Million Forecast, by Consumption Analysis 2020 & 2033
- Table 30: Global Coffee Trade Analysis Industry Revenue Million Forecast, by Import Market Analysis (Value & Volume) 2020 & 2033
- Table 31: Global Coffee Trade Analysis Industry Revenue Million Forecast, by Export Market Analysis (Value & Volume) 2020 & 2033
- Table 32: Global Coffee Trade Analysis Industry Revenue Million Forecast, by Price Trend Analysis 2020 & 2033
- Table 33: Global Coffee Trade Analysis Industry Revenue Million Forecast, by Country 2020 & 2033
- Table 34: China Coffee Trade Analysis Industry Revenue (Million) Forecast, by Application 2020 & 2033
- Table 35: India Coffee Trade Analysis Industry Revenue (Million) Forecast, by Application 2020 & 2033
- Table 36: Japan Coffee Trade Analysis Industry Revenue (Million) Forecast, by Application 2020 & 2033
- Table 37: Indonesia Coffee Trade Analysis Industry Revenue (Million) Forecast, by Application 2020 & 2033
- Table 38: Philippines Coffee Trade Analysis Industry Revenue (Million) Forecast, by Application 2020 & 2033
- Table 39: Global Coffee Trade Analysis Industry Revenue Million Forecast, by Production Analysis 2020 & 2033
- Table 40: Global Coffee Trade Analysis Industry Revenue Million Forecast, by Consumption Analysis 2020 & 2033
- Table 41: Global Coffee Trade Analysis Industry Revenue Million Forecast, by Import Market Analysis (Value & Volume) 2020 & 2033
- Table 42: Global Coffee Trade Analysis Industry Revenue Million Forecast, by Export Market Analysis (Value & Volume) 2020 & 2033
- Table 43: Global Coffee Trade Analysis Industry Revenue Million Forecast, by Price Trend Analysis 2020 & 2033
- Table 44: Global Coffee Trade Analysis Industry Revenue Million Forecast, by Country 2020 & 2033
- Table 45: Brazil Coffee Trade Analysis Industry Revenue (Million) Forecast, by Application 2020 & 2033
- Table 46: Argentina Coffee Trade Analysis Industry Revenue (Million) Forecast, by Application 2020 & 2033
- Table 47: Global Coffee Trade Analysis Industry Revenue Million Forecast, by Production Analysis 2020 & 2033
- Table 48: Global Coffee Trade Analysis Industry Revenue Million Forecast, by Consumption Analysis 2020 & 2033
- Table 49: Global Coffee Trade Analysis Industry Revenue Million Forecast, by Import Market Analysis (Value & Volume) 2020 & 2033
- Table 50: Global Coffee Trade Analysis Industry Revenue Million Forecast, by Export Market Analysis (Value & Volume) 2020 & 2033
- Table 51: Global Coffee Trade Analysis Industry Revenue Million Forecast, by Price Trend Analysis 2020 & 2033
- Table 52: Global Coffee Trade Analysis Industry Revenue Million Forecast, by Country 2020 & 2033
- Table 53: South Africa Coffee Trade Analysis Industry Revenue (Million) Forecast, by Application 2020 & 2033
Frequently Asked Questions
1. What is the projected Compound Annual Growth Rate (CAGR) of the Coffee Trade Analysis Industry?
The projected CAGR is approximately 2.50%.
2. Which companies are prominent players in the Coffee Trade Analysis Industry?
Key companies in the market include JDE Peet's , Starbucks , Keurig Dr Pepper , Nestlé , Jacobs Douwe Egberts.
3. What are the main segments of the Coffee Trade Analysis Industry?
The market segments include Production Analysis, Consumption Analysis, Import Market Analysis (Value & Volume), Export Market Analysis (Value & Volume), Price Trend Analysis.
4. Can you provide details about the market size?
The market size is estimated to be USD XXX Million as of 2022.
5. What are some drivers contributing to market growth?
Rising Consumption of Cashew Nuts in the Country; Favorable Government Initiatives.
6. What are the notable trends driving market growth?
United States Dominates the Global Imports.
7. Are there any restraints impacting market growth?
Hazardous Climatic Condition Hinders Cashew Production; Stringent Regulations Related to Food Quality Standards.
8. Can you provide examples of recent developments in the market?
January 2023: Coffee exported from India was up by nearly 2% to 400,000 tons in 2022, with the rise in instant coffee exports and re-exports in the country. The export of instant coffee increased by 16.73% to 35,810 tons in 2022 from 29,819 tons in the previous year.
9. What pricing options are available for accessing the report?
Pricing options include single-user, multi-user, and enterprise licenses priced at USD 4750, USD 5250, and USD 8750 respectively.
10. Is the market size provided in terms of value or volume?
The market size is provided in terms of value, measured in Million.
11. Are there any specific market keywords associated with the report?
Yes, the market keyword associated with the report is "Coffee Trade Analysis Industry," which aids in identifying and referencing the specific market segment covered.
12. How do I determine which pricing option suits my needs best?
The pricing options vary based on user requirements and access needs. Individual users may opt for single-user licenses, while businesses requiring broader access may choose multi-user or enterprise licenses for cost-effective access to the report.
13. Are there any additional resources or data provided in the Coffee Trade Analysis Industry report?
While the report offers comprehensive insights, it's advisable to review the specific contents or supplementary materials provided to ascertain if additional resources or data are available.
14. How can I stay updated on further developments or reports in the Coffee Trade Analysis Industry?
To stay informed about further developments, trends, and reports in the Coffee Trade Analysis Industry, consider subscribing to industry newsletters, following relevant companies and organizations, or regularly checking reputable industry news sources and publications.
Methodology
Step 1 - Identification of Relevant Samples Size from Population Database


Step 2 - Approaches for Defining Global Market Size (Value, Volume* & Price*)

Note*: In applicable scenarios
Step 3 - Data Sources
Primary Research
- Web Analytics
- Survey Reports
- Research Institute
- Latest Research Reports
- Opinion Leaders
Secondary Research
- Annual Reports
- White Paper
- Latest Press Release
- Industry Association
- Paid Database
- Investor Presentations

Step 4 - Data Triangulation
Involves using different sources of information in order to increase the validity of a study
These sources are likely to be stakeholders in a program - participants, other researchers, program staff, other community members, and so on.
Then we put all data in single framework & apply various statistical tools to find out the dynamic on the market.
During the analysis stage, feedback from the stakeholder groups would be compared to determine areas of agreement as well as areas of divergence