

Key Insights
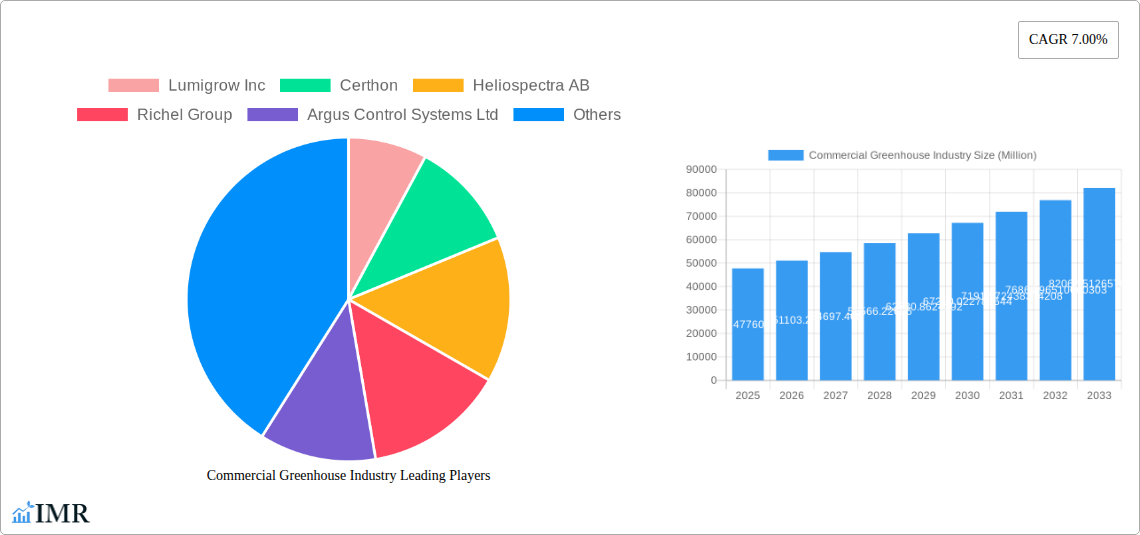
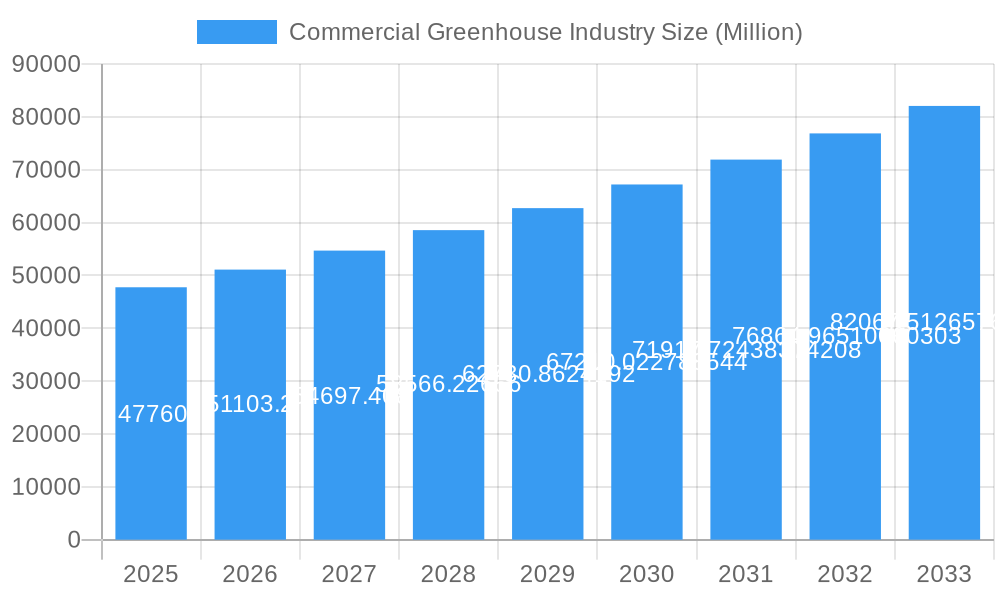
The Commercial Greenhouse Industry is poised for robust growth, with a projected market size of USD 47.76 billion in 2025 and a compound annual growth rate (CAGR) of 7.00% anticipated through 2033. This expansion is primarily fueled by the escalating global demand for fresh, high-quality produce year-round, coupled with the increasing adoption of controlled environment agriculture (CEA) to overcome challenges posed by climate change and limited arable land. Technological advancements in greenhouse design, automation, and climate control systems are further enhancing efficiency and yield, making commercial greenhouses a more attractive investment. The industry is witnessing a significant trend towards sustainable farming practices, with a growing emphasis on water conservation, reduced pesticide usage, and energy-efficient solutions. This shift is driven by both regulatory pressures and consumer preference for environmentally responsible food production.
Commercial Greenhouse Industry Market Size (In Billion)
The market dynamics are further shaped by key drivers such as the burgeoning population, a rising middle class with increased disposable income and a greater willingness to spend on premium produce, and the need for enhanced food security in various regions. Innovations in LED lighting, advanced hydroponic and aeroponic systems, and sophisticated sensor technologies are optimizing growing conditions, leading to higher productivity and improved crop quality. While the market enjoys strong growth potential, certain restraints exist, including high initial investment costs for setting up advanced greenhouse facilities and the need for skilled labor to manage complex systems. However, the increasing availability of financing options and government incentives for agricultural technology are mitigating these challenges. The competitive landscape features prominent players like Lumigrow Inc., Certhon, and Heliospectra AB, who are actively innovating and expanding their product portfolios to cater to diverse market needs.
Commercial Greenhouse Industry Company Market Share
Comprehensive Report: Commercial Greenhouse Industry Market Outlook (2019–2033)
This in-depth report offers a complete analysis of the global commercial greenhouse industry, providing critical insights for stakeholders. Leveraging detailed market dynamics, growth trends, and regional analysis, this study forecasts significant expansion. The report covers production, consumption, import/export markets, and pricing trends from 2019 to 2033, with a base and estimated year of 2025.
Commercial Greenhouse Industry Market Dynamics & Structure
The commercial greenhouse industry is characterized by a moderately concentrated market, driven by continuous technological innovation in areas like climate control, LED lighting, and automation. Regulatory frameworks, particularly those concerning sustainable agriculture and food safety, play a significant role in shaping market entry and operational standards. Competitive product substitutes include traditional open-field farming, but the benefits of controlled environments for yield optimization and resource efficiency are increasingly evident. End-user demographics are shifting, with growing demand from large-scale commercial farms, urban agriculture initiatives, and specialized horticultural operations. Mergers and acquisitions (M&A) trends indicate consolidation, with larger players acquiring smaller, innovative companies to expand their technological capabilities and market reach.
- Market Concentration: Moderate, with key players holding significant market share.
- Technological Innovation Drivers: Automation, IoT integration, advanced lighting (LEDs), climate control systems, and water management technologies.
- Regulatory Frameworks: Food safety standards, environmental regulations, subsidies for sustainable farming practices.
- Competitive Product Substitutes: Open-field agriculture, vertical farms (indoor).
- End-User Demographics: Large commercial growers, horticultural businesses, research institutions, urban farms.
- M&A Trends: Strategic acquisitions for technology and market access, estimated deal volume of xx in the historical period.
Commercial Greenhouse Industry Growth Trends & Insights
The global commercial greenhouse industry is poised for substantial growth, driven by an escalating demand for high-quality, year-round produce and an increasing focus on food security. The market size is projected to experience a robust Compound Annual Growth Rate (CAGR) of approximately 7.5% over the forecast period (2025–2033), reaching an estimated value of $xx billion by 2033. Adoption rates for advanced greenhouse technologies are rapidly accelerating, propelled by the need for enhanced crop yields, reduced water consumption, and minimized pesticide usage. Technological disruptions, such as the integration of artificial intelligence (AI) for predictive analytics and autonomous growing systems, are revolutionizing operational efficiency. Consumer behavior shifts, including a preference for locally sourced and sustainably grown produce, further fuel the demand for controlled environment agriculture. The penetration of smart greenhouse solutions is expected to climb significantly as growers recognize the economic and environmental benefits.
- Market Size Evolution: Projecting to reach $xx billion by 2033.
- CAGR: Estimated at 7.5% for the forecast period 2025–2033.
- Adoption Rates: Increasing for smart technologies, automation, and sustainable solutions.
- Technological Disruptions: AI-driven analytics, robotics, advanced sensor technologies.
- Consumer Behavior Shifts: Demand for local, fresh, and sustainably produced food.
- Market Penetration: Growing, particularly in developed and emerging economies.
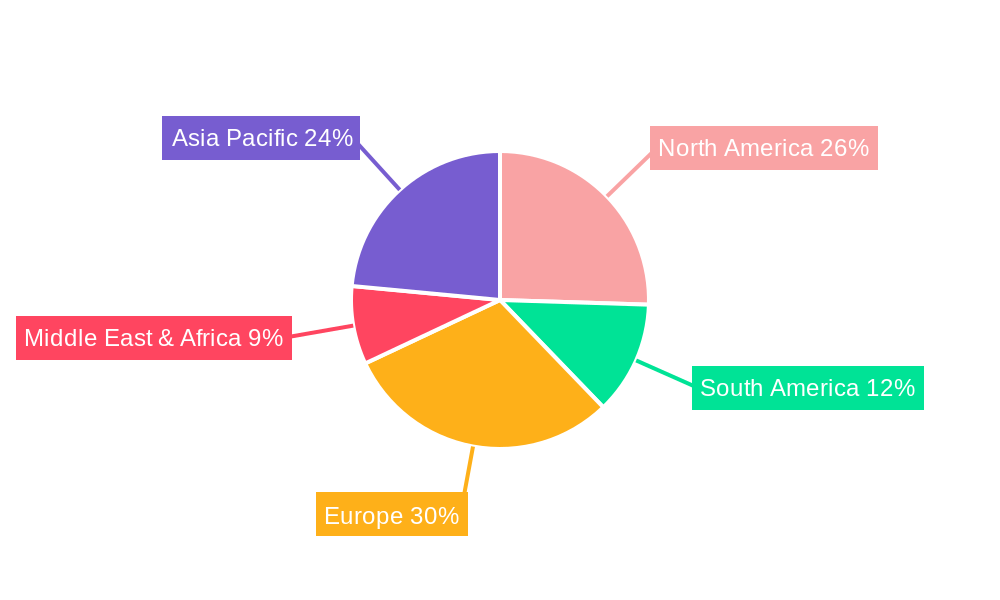
Dominant Regions, Countries, or Segments in Commercial Greenhouse Industry
The North America region is emerging as a dominant force in the commercial greenhouse industry, primarily driven by its robust Consumption Analysis, significant Import Market Analysis (Value & Volume), and increasing focus on technological advancements. The United States and Canada, in particular, are witnessing a surge in high-tech greenhouse operations due to favorable government initiatives supporting sustainable agriculture and innovation.
- Production Analysis: While Europe has historically led in production volume, North America is rapidly catching up with larger, more technologically advanced facilities. Asia is also a significant and growing producer, particularly in countries like China and Japan.
- Consumption Analysis: North America and Europe lead in consumption, fueled by a strong demand for fresh, high-quality produce year-round and a growing consumer preference for locally sourced food. The increasing adoption of controlled environment agriculture in urban centers also contributes significantly.
- Import Market Analysis (Value & Volume): Developed nations with high disposable incomes and limited arable land, such as those in Northern Europe and North America, exhibit strong import volumes for specialized greenhouse-grown produce. Countries in the Middle East and parts of Asia are also significant importers due to climatic challenges and growing populations. The estimated import market value for 2025 is $xx billion.
- Export Market Analysis (Value & Volume): European countries with established horticultural expertise and advanced technology, such as the Netherlands and Spain, are major exporters of greenhouse produce and greenhouse technology. North America is also increasing its export capabilities, particularly in high-value crops. The estimated export market value for 2025 is $xx billion.
- Price Trend Analysis: Prices for greenhouse-grown produce are generally higher than open-field produce due to the controlled environment and higher production costs. However, price trends are influenced by crop type, seasonality, energy costs, and the level of technological sophistication. Innovations in energy efficiency and automation are contributing to stabilizing or gradually decreasing operational costs.
Commercial Greenhouse Industry Product Landscape
The product landscape within the commercial greenhouse industry is rapidly evolving with a strong emphasis on advanced technologies that enhance efficiency and sustainability. Innovations in smart greenhouse systems, incorporating IoT sensors for real-time monitoring of temperature, humidity, CO2 levels, and nutrient delivery, are becoming standard. High-efficiency LED grow lights, offering customizable light spectra for optimized plant growth and energy savings, are a key development. Advanced climate control systems, automated irrigation and fertigation solutions, and robotic harvesting technologies are also transforming operations. These product advancements aim to maximize yield, improve crop quality, reduce resource consumption, and minimize labor requirements, offering a distinct competitive advantage to growers.
Key Drivers, Barriers & Challenges in Commercial Greenhouse Industry
Key Drivers:
- Growing demand for fresh, safe, and locally sourced produce: Driven by consumer awareness and health consciousness.
- Technological advancements: Automation, AI, IoT, and advanced lighting solutions are improving efficiency and yields.
- Climate change and resource scarcity: Greenhouses offer a solution for predictable yields despite unpredictable weather and water conservation.
- Government support and initiatives: Subsidies and policies encouraging sustainable agriculture and local food production.
Barriers & Challenges:
- High initial investment costs: Setting up advanced greenhouse facilities can be capital-intensive.
- Energy consumption and costs: Heating, cooling, and lighting can represent significant operational expenses.
- Skilled labor shortage: Operating and maintaining sophisticated greenhouse systems requires specialized expertise.
- Regulatory hurdles and compliance: Meeting stringent food safety and environmental standards.
- Supply chain disruptions: Global events can impact the availability of materials and equipment.
Emerging Opportunities in Commercial Greenhouse Industry
Emerging opportunities lie in the expansion of vertical farming within urban centers, leveraging controlled environments for hyper-local food production. The development of specialized greenhouses for niche crops, such as medicinal plants and high-value fruits, presents significant untapped market potential. Furthermore, the integration of renewable energy sources to power greenhouse operations offers a sustainable growth avenue. There is also a growing demand for consulting and integrated solutions providers that can offer end-to-end services for greenhouse design, construction, and operation.
Growth Accelerators in the Commercial Greenhouse Industry Industry
Key catalysts driving long-term growth include continuous breakthroughs in AI and robotics for fully autonomous operations, leading to reduced labor dependency and enhanced precision. Strategic partnerships between technology providers, growers, and research institutions are fostering innovation and accelerating the adoption of cutting-edge solutions. Furthermore, market expansion into emerging economies with increasing food demand and developing agricultural sectors presents substantial opportunities for growth. The development of more energy-efficient technologies and the integration of smart grid solutions will also play a crucial role in cost reduction and sustainability.
Key Players Shaping the Commercial Greenhouse Industry Market
- Lumigrow Inc
- Certhon
- Heliospectra AB
- Richel Group
- Argus Control Systems Ltd
- Agra Tech Inc
- Rough Brothers Inc
- Logiqs BV
- International Greenhouse Company
- Gibraltar Industries (Nexus Corporation)
Notable Milestones in Commercial Greenhouse Industry Sector
- September 2023: Richel Group has been in a three-year, exclusive strategic partnership to increase its efficiency in designing, manufacturing, and building high-tech greenhouses in challenging climates and distant regions, including the Middle East and Asia.
- June 2023: Certhon and Living Greens Farm announced a strategic partnership to develop further and globally expand Living Greens Farm’s disruptive aeroponic growing technology. Certhon would bring its technological expertise and global network to this partnership to create and help market the aeroponics technology outside North America.
- February 2023: Heliospectra AB (publ) expanded its product portfolio and MITRA platform with MITRA Flex, the market’s first wirelessly controlled flexible far-red light. The new solutions offer customers three spectra in one without losing power, making it perfect for customizable and application-based growing, such as end-of-day or end-of-production light treatments with far-red, or to ensure a healthy crop year-round in low light seasons.
In-Depth Commercial Greenhouse Industry Market Outlook
The future of the commercial greenhouse industry is exceptionally promising, driven by a confluence of technological innovation, evolving consumer demands, and the imperative for sustainable food production. Growth accelerators such as the widespread adoption of AI-powered precision agriculture, advanced automation, and the integration of renewable energy will significantly boost efficiency and reduce operational costs. Strategic collaborations between industry leaders and the expansion into new geographical markets, particularly those facing food security challenges, will further fuel market growth. The industry is poised for a transformative period, offering substantial opportunities for stakeholders who can adapt to and capitalize on these dynamic shifts.
Commercial Greenhouse Industry Segmentation
- 1. Production Analysis
- 2. Consumption Analysis
- 3. Import Market Analysis (Value & Volume)
- 4. Export Market Analysis (Value & Volume)
- 5. Price Trend Analysis
Commercial Greenhouse Industry Segmentation By Geography
-
1. North America
- 1.1. United States
- 1.2. Canada
- 1.3. Mexico
-
2. South America
- 2.1. Brazil
- 2.2. Argentina
- 2.3. Rest of South America
-
3. Europe
- 3.1. United Kingdom
- 3.2. Germany
- 3.3. France
- 3.4. Italy
- 3.5. Spain
- 3.6. Russia
- 3.7. Benelux
- 3.8. Nordics
- 3.9. Rest of Europe
-
4. Middle East & Africa
- 4.1. Turkey
- 4.2. Israel
- 4.3. GCC
- 4.4. North Africa
- 4.5. South Africa
- 4.6. Rest of Middle East & Africa
-
5. Asia Pacific
- 5.1. China
- 5.2. India
- 5.3. Japan
- 5.4. South Korea
- 5.5. ASEAN
- 5.6. Oceania
- 5.7. Rest of Asia Pacific
Commercial Greenhouse Industry Regional Market Share
Geographic Coverage of Commercial Greenhouse Industry
Commercial Greenhouse Industry REPORT HIGHLIGHTS
| Aspects | Details |
|---|---|
| Study Period | 2020-2034 |
| Base Year | 2025 |
| Estimated Year | 2026 |
| Forecast Period | 2026-2034 |
| Historical Period | 2020-2025 |
| Growth Rate | CAGR of 7.00% from 2020-2034 |
| Segmentation |
|
Table of Contents
- 1. Introduction
- 1.1. Research Scope
- 1.2. Market Segmentation
- 1.3. Research Objective
- 1.4. Definitions and Assumptions
- 2. Executive Summary
- 2.1. Market Snapshot
- 3. Market Dynamics
- 3.1. Market Drivers
- 3.2. Market Restrains
- 3.3. Market Trends
- 3.4. Market Opportunities
- 4. Market Factor Analysis
- 4.1. Porters Five Forces
- 4.1.1. Bargaining Power of Suppliers
- 4.1.2. Bargaining Power of Buyers
- 4.1.3. Threat of New Entrants
- 4.1.4. Threat of Substitutes
- 4.1.5. Competitive Rivalry
- 4.2. PESTEL analysis
- 4.3. BCG Analysis
- 4.3.1. Stars (High Growth, High Market Share)
- 4.3.2. Cash Cows (Low Growth, High Market Share)
- 4.3.3. Question Mark (High Growth, Low Market Share)
- 4.3.4. Dogs (Low Growth, Low Market Share)
- 4.4. Ansoff Matrix Analysis
- 4.5. Supply Chain Analysis
- 4.6. Regulatory Landscape
- 4.7. Current Market Potential and Opportunity Assessment (TAM–SAM–SOM Framework)
- 4.8. IMR Analyst Note
- 4.1. Porters Five Forces
- 5. Market Analysis, Insights and Forecast 2021-2033
- 5.1. Market Analysis, Insights and Forecast - by Production Analysis
- 5.2. Market Analysis, Insights and Forecast - by Consumption Analysis
- 5.3. Market Analysis, Insights and Forecast - by Import Market Analysis (Value & Volume)
- 5.4. Market Analysis, Insights and Forecast - by Export Market Analysis (Value & Volume)
- 5.5. Market Analysis, Insights and Forecast - by Price Trend Analysis
- 5.6. Market Analysis, Insights and Forecast - by Region
- 5.6.1. North America
- 5.6.2. South America
- 5.6.3. Europe
- 5.6.4. Middle East & Africa
- 5.6.5. Asia Pacific
- 6. Global Commercial Greenhouse Industry Analysis, Insights and Forecast, 2021-2033
- 6.1. Market Analysis, Insights and Forecast - by Production Analysis
- 6.2. Market Analysis, Insights and Forecast - by Consumption Analysis
- 6.3. Market Analysis, Insights and Forecast - by Import Market Analysis (Value & Volume)
- 6.4. Market Analysis, Insights and Forecast - by Export Market Analysis (Value & Volume)
- 6.5. Market Analysis, Insights and Forecast - by Price Trend Analysis
- 7. North America Commercial Greenhouse Industry Analysis, Insights and Forecast, 2020-2032
- 7.1. Market Analysis, Insights and Forecast - by Production Analysis
- 7.2. Market Analysis, Insights and Forecast - by Consumption Analysis
- 7.3. Market Analysis, Insights and Forecast - by Import Market Analysis (Value & Volume)
- 7.4. Market Analysis, Insights and Forecast - by Export Market Analysis (Value & Volume)
- 7.5. Market Analysis, Insights and Forecast - by Price Trend Analysis
- 8. South America Commercial Greenhouse Industry Analysis, Insights and Forecast, 2020-2032
- 8.1. Market Analysis, Insights and Forecast - by Production Analysis
- 8.2. Market Analysis, Insights and Forecast - by Consumption Analysis
- 8.3. Market Analysis, Insights and Forecast - by Import Market Analysis (Value & Volume)
- 8.4. Market Analysis, Insights and Forecast - by Export Market Analysis (Value & Volume)
- 8.5. Market Analysis, Insights and Forecast - by Price Trend Analysis
- 9. Europe Commercial Greenhouse Industry Analysis, Insights and Forecast, 2020-2032
- 9.1. Market Analysis, Insights and Forecast - by Production Analysis
- 9.2. Market Analysis, Insights and Forecast - by Consumption Analysis
- 9.3. Market Analysis, Insights and Forecast - by Import Market Analysis (Value & Volume)
- 9.4. Market Analysis, Insights and Forecast - by Export Market Analysis (Value & Volume)
- 9.5. Market Analysis, Insights and Forecast - by Price Trend Analysis
- 10. Middle East & Africa Commercial Greenhouse Industry Analysis, Insights and Forecast, 2020-2032
- 10.1. Market Analysis, Insights and Forecast - by Production Analysis
- 10.2. Market Analysis, Insights and Forecast - by Consumption Analysis
- 10.3. Market Analysis, Insights and Forecast - by Import Market Analysis (Value & Volume)
- 10.4. Market Analysis, Insights and Forecast - by Export Market Analysis (Value & Volume)
- 10.5. Market Analysis, Insights and Forecast - by Price Trend Analysis
- 11. Asia Pacific Commercial Greenhouse Industry Analysis, Insights and Forecast, 2020-2032
- 11.1. Market Analysis, Insights and Forecast - by Production Analysis
- 11.2. Market Analysis, Insights and Forecast - by Consumption Analysis
- 11.3. Market Analysis, Insights and Forecast - by Import Market Analysis (Value & Volume)
- 11.4. Market Analysis, Insights and Forecast - by Export Market Analysis (Value & Volume)
- 11.5. Market Analysis, Insights and Forecast - by Price Trend Analysis
- 12. Competitive Analysis
- 12.1. Company Profiles
- 12.1.1 Lumigrow Inc
- 12.1.1.1. Company Overview
- 12.1.1.2. Products
- 12.1.1.3. Company Financials
- 12.1.1.4. SWOT Analysis
- 12.1.2 Certhon
- 12.1.2.1. Company Overview
- 12.1.2.2. Products
- 12.1.2.3. Company Financials
- 12.1.2.4. SWOT Analysis
- 12.1.3 Heliospectra AB
- 12.1.3.1. Company Overview
- 12.1.3.2. Products
- 12.1.3.3. Company Financials
- 12.1.3.4. SWOT Analysis
- 12.1.4 Richel Group
- 12.1.4.1. Company Overview
- 12.1.4.2. Products
- 12.1.4.3. Company Financials
- 12.1.4.4. SWOT Analysis
- 12.1.5 Argus Control Systems Ltd
- 12.1.5.1. Company Overview
- 12.1.5.2. Products
- 12.1.5.3. Company Financials
- 12.1.5.4. SWOT Analysis
- 12.1.6 Agra Tech Inc *List Not Exhaustive
- 12.1.6.1. Company Overview
- 12.1.6.2. Products
- 12.1.6.3. Company Financials
- 12.1.6.4. SWOT Analysis
- 12.1.7 Rough Brothers Inc
- 12.1.7.1. Company Overview
- 12.1.7.2. Products
- 12.1.7.3. Company Financials
- 12.1.7.4. SWOT Analysis
- 12.1.8 Logiqs BV
- 12.1.8.1. Company Overview
- 12.1.8.2. Products
- 12.1.8.3. Company Financials
- 12.1.8.4. SWOT Analysis
- 12.1.9 International Greenhouse Company
- 12.1.9.1. Company Overview
- 12.1.9.2. Products
- 12.1.9.3. Company Financials
- 12.1.9.4. SWOT Analysis
- 12.1.10 Gibraltar Industries (Nexus Corporation)
- 12.1.10.1. Company Overview
- 12.1.10.2. Products
- 12.1.10.3. Company Financials
- 12.1.10.4. SWOT Analysis
- 12.1.1 Lumigrow Inc
- 12.2. Market Entropy
- 12.2.1 Company's Key Areas Served
- 12.2.2 Recent Developments
- 12.3. Company Market Share Analysis 2025
- 12.3.1 Top 5 Companies Market Share Analysis
- 12.3.2 Top 3 Companies Market Share Analysis
- 12.4. List of Potential Customers
- 13. Research Methodology
List of Figures
- Figure 1: Global Commercial Greenhouse Industry Revenue Breakdown (Million, %) by Region 2025 & 2033
- Figure 2: Global Commercial Greenhouse Industry Volume Breakdown (Kiloton, %) by Region 2025 & 2033
- Figure 3: North America Commercial Greenhouse Industry Revenue (Million), by Production Analysis 2025 & 2033
- Figure 4: North America Commercial Greenhouse Industry Volume (Kiloton), by Production Analysis 2025 & 2033
- Figure 5: North America Commercial Greenhouse Industry Revenue Share (%), by Production Analysis 2025 & 2033
- Figure 6: North America Commercial Greenhouse Industry Volume Share (%), by Production Analysis 2025 & 2033
- Figure 7: North America Commercial Greenhouse Industry Revenue (Million), by Consumption Analysis 2025 & 2033
- Figure 8: North America Commercial Greenhouse Industry Volume (Kiloton), by Consumption Analysis 2025 & 2033
- Figure 9: North America Commercial Greenhouse Industry Revenue Share (%), by Consumption Analysis 2025 & 2033
- Figure 10: North America Commercial Greenhouse Industry Volume Share (%), by Consumption Analysis 2025 & 2033
- Figure 11: North America Commercial Greenhouse Industry Revenue (Million), by Import Market Analysis (Value & Volume) 2025 & 2033
- Figure 12: North America Commercial Greenhouse Industry Volume (Kiloton), by Import Market Analysis (Value & Volume) 2025 & 2033
- Figure 13: North America Commercial Greenhouse Industry Revenue Share (%), by Import Market Analysis (Value & Volume) 2025 & 2033
- Figure 14: North America Commercial Greenhouse Industry Volume Share (%), by Import Market Analysis (Value & Volume) 2025 & 2033
- Figure 15: North America Commercial Greenhouse Industry Revenue (Million), by Export Market Analysis (Value & Volume) 2025 & 2033
- Figure 16: North America Commercial Greenhouse Industry Volume (Kiloton), by Export Market Analysis (Value & Volume) 2025 & 2033
- Figure 17: North America Commercial Greenhouse Industry Revenue Share (%), by Export Market Analysis (Value & Volume) 2025 & 2033
- Figure 18: North America Commercial Greenhouse Industry Volume Share (%), by Export Market Analysis (Value & Volume) 2025 & 2033
- Figure 19: North America Commercial Greenhouse Industry Revenue (Million), by Price Trend Analysis 2025 & 2033
- Figure 20: North America Commercial Greenhouse Industry Volume (Kiloton), by Price Trend Analysis 2025 & 2033
- Figure 21: North America Commercial Greenhouse Industry Revenue Share (%), by Price Trend Analysis 2025 & 2033
- Figure 22: North America Commercial Greenhouse Industry Volume Share (%), by Price Trend Analysis 2025 & 2033
- Figure 23: North America Commercial Greenhouse Industry Revenue (Million), by Country 2025 & 2033
- Figure 24: North America Commercial Greenhouse Industry Volume (Kiloton), by Country 2025 & 2033
- Figure 25: North America Commercial Greenhouse Industry Revenue Share (%), by Country 2025 & 2033
- Figure 26: North America Commercial Greenhouse Industry Volume Share (%), by Country 2025 & 2033
- Figure 27: South America Commercial Greenhouse Industry Revenue (Million), by Production Analysis 2025 & 2033
- Figure 28: South America Commercial Greenhouse Industry Volume (Kiloton), by Production Analysis 2025 & 2033
- Figure 29: South America Commercial Greenhouse Industry Revenue Share (%), by Production Analysis 2025 & 2033
- Figure 30: South America Commercial Greenhouse Industry Volume Share (%), by Production Analysis 2025 & 2033
- Figure 31: South America Commercial Greenhouse Industry Revenue (Million), by Consumption Analysis 2025 & 2033
- Figure 32: South America Commercial Greenhouse Industry Volume (Kiloton), by Consumption Analysis 2025 & 2033
- Figure 33: South America Commercial Greenhouse Industry Revenue Share (%), by Consumption Analysis 2025 & 2033
- Figure 34: South America Commercial Greenhouse Industry Volume Share (%), by Consumption Analysis 2025 & 2033
- Figure 35: South America Commercial Greenhouse Industry Revenue (Million), by Import Market Analysis (Value & Volume) 2025 & 2033
- Figure 36: South America Commercial Greenhouse Industry Volume (Kiloton), by Import Market Analysis (Value & Volume) 2025 & 2033
- Figure 37: South America Commercial Greenhouse Industry Revenue Share (%), by Import Market Analysis (Value & Volume) 2025 & 2033
- Figure 38: South America Commercial Greenhouse Industry Volume Share (%), by Import Market Analysis (Value & Volume) 2025 & 2033
- Figure 39: South America Commercial Greenhouse Industry Revenue (Million), by Export Market Analysis (Value & Volume) 2025 & 2033
- Figure 40: South America Commercial Greenhouse Industry Volume (Kiloton), by Export Market Analysis (Value & Volume) 2025 & 2033
- Figure 41: South America Commercial Greenhouse Industry Revenue Share (%), by Export Market Analysis (Value & Volume) 2025 & 2033
- Figure 42: South America Commercial Greenhouse Industry Volume Share (%), by Export Market Analysis (Value & Volume) 2025 & 2033
- Figure 43: South America Commercial Greenhouse Industry Revenue (Million), by Price Trend Analysis 2025 & 2033
- Figure 44: South America Commercial Greenhouse Industry Volume (Kiloton), by Price Trend Analysis 2025 & 2033
- Figure 45: South America Commercial Greenhouse Industry Revenue Share (%), by Price Trend Analysis 2025 & 2033
- Figure 46: South America Commercial Greenhouse Industry Volume Share (%), by Price Trend Analysis 2025 & 2033
- Figure 47: South America Commercial Greenhouse Industry Revenue (Million), by Country 2025 & 2033
- Figure 48: South America Commercial Greenhouse Industry Volume (Kiloton), by Country 2025 & 2033
- Figure 49: South America Commercial Greenhouse Industry Revenue Share (%), by Country 2025 & 2033
- Figure 50: South America Commercial Greenhouse Industry Volume Share (%), by Country 2025 & 2033
- Figure 51: Europe Commercial Greenhouse Industry Revenue (Million), by Production Analysis 2025 & 2033
- Figure 52: Europe Commercial Greenhouse Industry Volume (Kiloton), by Production Analysis 2025 & 2033
- Figure 53: Europe Commercial Greenhouse Industry Revenue Share (%), by Production Analysis 2025 & 2033
- Figure 54: Europe Commercial Greenhouse Industry Volume Share (%), by Production Analysis 2025 & 2033
- Figure 55: Europe Commercial Greenhouse Industry Revenue (Million), by Consumption Analysis 2025 & 2033
- Figure 56: Europe Commercial Greenhouse Industry Volume (Kiloton), by Consumption Analysis 2025 & 2033
- Figure 57: Europe Commercial Greenhouse Industry Revenue Share (%), by Consumption Analysis 2025 & 2033
- Figure 58: Europe Commercial Greenhouse Industry Volume Share (%), by Consumption Analysis 2025 & 2033
- Figure 59: Europe Commercial Greenhouse Industry Revenue (Million), by Import Market Analysis (Value & Volume) 2025 & 2033
- Figure 60: Europe Commercial Greenhouse Industry Volume (Kiloton), by Import Market Analysis (Value & Volume) 2025 & 2033
- Figure 61: Europe Commercial Greenhouse Industry Revenue Share (%), by Import Market Analysis (Value & Volume) 2025 & 2033
- Figure 62: Europe Commercial Greenhouse Industry Volume Share (%), by Import Market Analysis (Value & Volume) 2025 & 2033
- Figure 63: Europe Commercial Greenhouse Industry Revenue (Million), by Export Market Analysis (Value & Volume) 2025 & 2033
- Figure 64: Europe Commercial Greenhouse Industry Volume (Kiloton), by Export Market Analysis (Value & Volume) 2025 & 2033
- Figure 65: Europe Commercial Greenhouse Industry Revenue Share (%), by Export Market Analysis (Value & Volume) 2025 & 2033
- Figure 66: Europe Commercial Greenhouse Industry Volume Share (%), by Export Market Analysis (Value & Volume) 2025 & 2033
- Figure 67: Europe Commercial Greenhouse Industry Revenue (Million), by Price Trend Analysis 2025 & 2033
- Figure 68: Europe Commercial Greenhouse Industry Volume (Kiloton), by Price Trend Analysis 2025 & 2033
- Figure 69: Europe Commercial Greenhouse Industry Revenue Share (%), by Price Trend Analysis 2025 & 2033
- Figure 70: Europe Commercial Greenhouse Industry Volume Share (%), by Price Trend Analysis 2025 & 2033
- Figure 71: Europe Commercial Greenhouse Industry Revenue (Million), by Country 2025 & 2033
- Figure 72: Europe Commercial Greenhouse Industry Volume (Kiloton), by Country 2025 & 2033
- Figure 73: Europe Commercial Greenhouse Industry Revenue Share (%), by Country 2025 & 2033
- Figure 74: Europe Commercial Greenhouse Industry Volume Share (%), by Country 2025 & 2033
- Figure 75: Middle East & Africa Commercial Greenhouse Industry Revenue (Million), by Production Analysis 2025 & 2033
- Figure 76: Middle East & Africa Commercial Greenhouse Industry Volume (Kiloton), by Production Analysis 2025 & 2033
- Figure 77: Middle East & Africa Commercial Greenhouse Industry Revenue Share (%), by Production Analysis 2025 & 2033
- Figure 78: Middle East & Africa Commercial Greenhouse Industry Volume Share (%), by Production Analysis 2025 & 2033
- Figure 79: Middle East & Africa Commercial Greenhouse Industry Revenue (Million), by Consumption Analysis 2025 & 2033
- Figure 80: Middle East & Africa Commercial Greenhouse Industry Volume (Kiloton), by Consumption Analysis 2025 & 2033
- Figure 81: Middle East & Africa Commercial Greenhouse Industry Revenue Share (%), by Consumption Analysis 2025 & 2033
- Figure 82: Middle East & Africa Commercial Greenhouse Industry Volume Share (%), by Consumption Analysis 2025 & 2033
- Figure 83: Middle East & Africa Commercial Greenhouse Industry Revenue (Million), by Import Market Analysis (Value & Volume) 2025 & 2033
- Figure 84: Middle East & Africa Commercial Greenhouse Industry Volume (Kiloton), by Import Market Analysis (Value & Volume) 2025 & 2033
- Figure 85: Middle East & Africa Commercial Greenhouse Industry Revenue Share (%), by Import Market Analysis (Value & Volume) 2025 & 2033
- Figure 86: Middle East & Africa Commercial Greenhouse Industry Volume Share (%), by Import Market Analysis (Value & Volume) 2025 & 2033
- Figure 87: Middle East & Africa Commercial Greenhouse Industry Revenue (Million), by Export Market Analysis (Value & Volume) 2025 & 2033
- Figure 88: Middle East & Africa Commercial Greenhouse Industry Volume (Kiloton), by Export Market Analysis (Value & Volume) 2025 & 2033
- Figure 89: Middle East & Africa Commercial Greenhouse Industry Revenue Share (%), by Export Market Analysis (Value & Volume) 2025 & 2033
- Figure 90: Middle East & Africa Commercial Greenhouse Industry Volume Share (%), by Export Market Analysis (Value & Volume) 2025 & 2033
- Figure 91: Middle East & Africa Commercial Greenhouse Industry Revenue (Million), by Price Trend Analysis 2025 & 2033
- Figure 92: Middle East & Africa Commercial Greenhouse Industry Volume (Kiloton), by Price Trend Analysis 2025 & 2033
- Figure 93: Middle East & Africa Commercial Greenhouse Industry Revenue Share (%), by Price Trend Analysis 2025 & 2033
- Figure 94: Middle East & Africa Commercial Greenhouse Industry Volume Share (%), by Price Trend Analysis 2025 & 2033
- Figure 95: Middle East & Africa Commercial Greenhouse Industry Revenue (Million), by Country 2025 & 2033
- Figure 96: Middle East & Africa Commercial Greenhouse Industry Volume (Kiloton), by Country 2025 & 2033
- Figure 97: Middle East & Africa Commercial Greenhouse Industry Revenue Share (%), by Country 2025 & 2033
- Figure 98: Middle East & Africa Commercial Greenhouse Industry Volume Share (%), by Country 2025 & 2033
- Figure 99: Asia Pacific Commercial Greenhouse Industry Revenue (Million), by Production Analysis 2025 & 2033
- Figure 100: Asia Pacific Commercial Greenhouse Industry Volume (Kiloton), by Production Analysis 2025 & 2033
- Figure 101: Asia Pacific Commercial Greenhouse Industry Revenue Share (%), by Production Analysis 2025 & 2033
- Figure 102: Asia Pacific Commercial Greenhouse Industry Volume Share (%), by Production Analysis 2025 & 2033
- Figure 103: Asia Pacific Commercial Greenhouse Industry Revenue (Million), by Consumption Analysis 2025 & 2033
- Figure 104: Asia Pacific Commercial Greenhouse Industry Volume (Kiloton), by Consumption Analysis 2025 & 2033
- Figure 105: Asia Pacific Commercial Greenhouse Industry Revenue Share (%), by Consumption Analysis 2025 & 2033
- Figure 106: Asia Pacific Commercial Greenhouse Industry Volume Share (%), by Consumption Analysis 2025 & 2033
- Figure 107: Asia Pacific Commercial Greenhouse Industry Revenue (Million), by Import Market Analysis (Value & Volume) 2025 & 2033
- Figure 108: Asia Pacific Commercial Greenhouse Industry Volume (Kiloton), by Import Market Analysis (Value & Volume) 2025 & 2033
- Figure 109: Asia Pacific Commercial Greenhouse Industry Revenue Share (%), by Import Market Analysis (Value & Volume) 2025 & 2033
- Figure 110: Asia Pacific Commercial Greenhouse Industry Volume Share (%), by Import Market Analysis (Value & Volume) 2025 & 2033
- Figure 111: Asia Pacific Commercial Greenhouse Industry Revenue (Million), by Export Market Analysis (Value & Volume) 2025 & 2033
- Figure 112: Asia Pacific Commercial Greenhouse Industry Volume (Kiloton), by Export Market Analysis (Value & Volume) 2025 & 2033
- Figure 113: Asia Pacific Commercial Greenhouse Industry Revenue Share (%), by Export Market Analysis (Value & Volume) 2025 & 2033
- Figure 114: Asia Pacific Commercial Greenhouse Industry Volume Share (%), by Export Market Analysis (Value & Volume) 2025 & 2033
- Figure 115: Asia Pacific Commercial Greenhouse Industry Revenue (Million), by Price Trend Analysis 2025 & 2033
- Figure 116: Asia Pacific Commercial Greenhouse Industry Volume (Kiloton), by Price Trend Analysis 2025 & 2033
- Figure 117: Asia Pacific Commercial Greenhouse Industry Revenue Share (%), by Price Trend Analysis 2025 & 2033
- Figure 118: Asia Pacific Commercial Greenhouse Industry Volume Share (%), by Price Trend Analysis 2025 & 2033
- Figure 119: Asia Pacific Commercial Greenhouse Industry Revenue (Million), by Country 2025 & 2033
- Figure 120: Asia Pacific Commercial Greenhouse Industry Volume (Kiloton), by Country 2025 & 2033
- Figure 121: Asia Pacific Commercial Greenhouse Industry Revenue Share (%), by Country 2025 & 2033
- Figure 122: Asia Pacific Commercial Greenhouse Industry Volume Share (%), by Country 2025 & 2033
List of Tables
- Table 1: Global Commercial Greenhouse Industry Revenue Million Forecast, by Production Analysis 2020 & 2033
- Table 2: Global Commercial Greenhouse Industry Volume Kiloton Forecast, by Production Analysis 2020 & 2033
- Table 3: Global Commercial Greenhouse Industry Revenue Million Forecast, by Consumption Analysis 2020 & 2033
- Table 4: Global Commercial Greenhouse Industry Volume Kiloton Forecast, by Consumption Analysis 2020 & 2033
- Table 5: Global Commercial Greenhouse Industry Revenue Million Forecast, by Import Market Analysis (Value & Volume) 2020 & 2033
- Table 6: Global Commercial Greenhouse Industry Volume Kiloton Forecast, by Import Market Analysis (Value & Volume) 2020 & 2033
- Table 7: Global Commercial Greenhouse Industry Revenue Million Forecast, by Export Market Analysis (Value & Volume) 2020 & 2033
- Table 8: Global Commercial Greenhouse Industry Volume Kiloton Forecast, by Export Market Analysis (Value & Volume) 2020 & 2033
- Table 9: Global Commercial Greenhouse Industry Revenue Million Forecast, by Price Trend Analysis 2020 & 2033
- Table 10: Global Commercial Greenhouse Industry Volume Kiloton Forecast, by Price Trend Analysis 2020 & 2033
- Table 11: Global Commercial Greenhouse Industry Revenue Million Forecast, by Region 2020 & 2033
- Table 12: Global Commercial Greenhouse Industry Volume Kiloton Forecast, by Region 2020 & 2033
- Table 13: Global Commercial Greenhouse Industry Revenue Million Forecast, by Production Analysis 2020 & 2033
- Table 14: Global Commercial Greenhouse Industry Volume Kiloton Forecast, by Production Analysis 2020 & 2033
- Table 15: Global Commercial Greenhouse Industry Revenue Million Forecast, by Consumption Analysis 2020 & 2033
- Table 16: Global Commercial Greenhouse Industry Volume Kiloton Forecast, by Consumption Analysis 2020 & 2033
- Table 17: Global Commercial Greenhouse Industry Revenue Million Forecast, by Import Market Analysis (Value & Volume) 2020 & 2033
- Table 18: Global Commercial Greenhouse Industry Volume Kiloton Forecast, by Import Market Analysis (Value & Volume) 2020 & 2033
- Table 19: Global Commercial Greenhouse Industry Revenue Million Forecast, by Export Market Analysis (Value & Volume) 2020 & 2033
- Table 20: Global Commercial Greenhouse Industry Volume Kiloton Forecast, by Export Market Analysis (Value & Volume) 2020 & 2033
- Table 21: Global Commercial Greenhouse Industry Revenue Million Forecast, by Price Trend Analysis 2020 & 2033
- Table 22: Global Commercial Greenhouse Industry Volume Kiloton Forecast, by Price Trend Analysis 2020 & 2033
- Table 23: Global Commercial Greenhouse Industry Revenue Million Forecast, by Country 2020 & 2033
- Table 24: Global Commercial Greenhouse Industry Volume Kiloton Forecast, by Country 2020 & 2033
- Table 25: United States Commercial Greenhouse Industry Revenue (Million) Forecast, by Application 2020 & 2033
- Table 26: United States Commercial Greenhouse Industry Volume (Kiloton) Forecast, by Application 2020 & 2033
- Table 27: Canada Commercial Greenhouse Industry Revenue (Million) Forecast, by Application 2020 & 2033
- Table 28: Canada Commercial Greenhouse Industry Volume (Kiloton) Forecast, by Application 2020 & 2033
- Table 29: Mexico Commercial Greenhouse Industry Revenue (Million) Forecast, by Application 2020 & 2033
- Table 30: Mexico Commercial Greenhouse Industry Volume (Kiloton) Forecast, by Application 2020 & 2033
- Table 31: Global Commercial Greenhouse Industry Revenue Million Forecast, by Production Analysis 2020 & 2033
- Table 32: Global Commercial Greenhouse Industry Volume Kiloton Forecast, by Production Analysis 2020 & 2033
- Table 33: Global Commercial Greenhouse Industry Revenue Million Forecast, by Consumption Analysis 2020 & 2033
- Table 34: Global Commercial Greenhouse Industry Volume Kiloton Forecast, by Consumption Analysis 2020 & 2033
- Table 35: Global Commercial Greenhouse Industry Revenue Million Forecast, by Import Market Analysis (Value & Volume) 2020 & 2033
- Table 36: Global Commercial Greenhouse Industry Volume Kiloton Forecast, by Import Market Analysis (Value & Volume) 2020 & 2033
- Table 37: Global Commercial Greenhouse Industry Revenue Million Forecast, by Export Market Analysis (Value & Volume) 2020 & 2033
- Table 38: Global Commercial Greenhouse Industry Volume Kiloton Forecast, by Export Market Analysis (Value & Volume) 2020 & 2033
- Table 39: Global Commercial Greenhouse Industry Revenue Million Forecast, by Price Trend Analysis 2020 & 2033
- Table 40: Global Commercial Greenhouse Industry Volume Kiloton Forecast, by Price Trend Analysis 2020 & 2033
- Table 41: Global Commercial Greenhouse Industry Revenue Million Forecast, by Country 2020 & 2033
- Table 42: Global Commercial Greenhouse Industry Volume Kiloton Forecast, by Country 2020 & 2033
- Table 43: Brazil Commercial Greenhouse Industry Revenue (Million) Forecast, by Application 2020 & 2033
- Table 44: Brazil Commercial Greenhouse Industry Volume (Kiloton) Forecast, by Application 2020 & 2033
- Table 45: Argentina Commercial Greenhouse Industry Revenue (Million) Forecast, by Application 2020 & 2033
- Table 46: Argentina Commercial Greenhouse Industry Volume (Kiloton) Forecast, by Application 2020 & 2033
- Table 47: Rest of South America Commercial Greenhouse Industry Revenue (Million) Forecast, by Application 2020 & 2033
- Table 48: Rest of South America Commercial Greenhouse Industry Volume (Kiloton) Forecast, by Application 2020 & 2033
- Table 49: Global Commercial Greenhouse Industry Revenue Million Forecast, by Production Analysis 2020 & 2033
- Table 50: Global Commercial Greenhouse Industry Volume Kiloton Forecast, by Production Analysis 2020 & 2033
- Table 51: Global Commercial Greenhouse Industry Revenue Million Forecast, by Consumption Analysis 2020 & 2033
- Table 52: Global Commercial Greenhouse Industry Volume Kiloton Forecast, by Consumption Analysis 2020 & 2033
- Table 53: Global Commercial Greenhouse Industry Revenue Million Forecast, by Import Market Analysis (Value & Volume) 2020 & 2033
- Table 54: Global Commercial Greenhouse Industry Volume Kiloton Forecast, by Import Market Analysis (Value & Volume) 2020 & 2033
- Table 55: Global Commercial Greenhouse Industry Revenue Million Forecast, by Export Market Analysis (Value & Volume) 2020 & 2033
- Table 56: Global Commercial Greenhouse Industry Volume Kiloton Forecast, by Export Market Analysis (Value & Volume) 2020 & 2033
- Table 57: Global Commercial Greenhouse Industry Revenue Million Forecast, by Price Trend Analysis 2020 & 2033
- Table 58: Global Commercial Greenhouse Industry Volume Kiloton Forecast, by Price Trend Analysis 2020 & 2033
- Table 59: Global Commercial Greenhouse Industry Revenue Million Forecast, by Country 2020 & 2033
- Table 60: Global Commercial Greenhouse Industry Volume Kiloton Forecast, by Country 2020 & 2033
- Table 61: United Kingdom Commercial Greenhouse Industry Revenue (Million) Forecast, by Application 2020 & 2033
- Table 62: United Kingdom Commercial Greenhouse Industry Volume (Kiloton) Forecast, by Application 2020 & 2033
- Table 63: Germany Commercial Greenhouse Industry Revenue (Million) Forecast, by Application 2020 & 2033
- Table 64: Germany Commercial Greenhouse Industry Volume (Kiloton) Forecast, by Application 2020 & 2033
- Table 65: France Commercial Greenhouse Industry Revenue (Million) Forecast, by Application 2020 & 2033
- Table 66: France Commercial Greenhouse Industry Volume (Kiloton) Forecast, by Application 2020 & 2033
- Table 67: Italy Commercial Greenhouse Industry Revenue (Million) Forecast, by Application 2020 & 2033
- Table 68: Italy Commercial Greenhouse Industry Volume (Kiloton) Forecast, by Application 2020 & 2033
- Table 69: Spain Commercial Greenhouse Industry Revenue (Million) Forecast, by Application 2020 & 2033
- Table 70: Spain Commercial Greenhouse Industry Volume (Kiloton) Forecast, by Application 2020 & 2033
- Table 71: Russia Commercial Greenhouse Industry Revenue (Million) Forecast, by Application 2020 & 2033
- Table 72: Russia Commercial Greenhouse Industry Volume (Kiloton) Forecast, by Application 2020 & 2033
- Table 73: Benelux Commercial Greenhouse Industry Revenue (Million) Forecast, by Application 2020 & 2033
- Table 74: Benelux Commercial Greenhouse Industry Volume (Kiloton) Forecast, by Application 2020 & 2033
- Table 75: Nordics Commercial Greenhouse Industry Revenue (Million) Forecast, by Application 2020 & 2033
- Table 76: Nordics Commercial Greenhouse Industry Volume (Kiloton) Forecast, by Application 2020 & 2033
- Table 77: Rest of Europe Commercial Greenhouse Industry Revenue (Million) Forecast, by Application 2020 & 2033
- Table 78: Rest of Europe Commercial Greenhouse Industry Volume (Kiloton) Forecast, by Application 2020 & 2033
- Table 79: Global Commercial Greenhouse Industry Revenue Million Forecast, by Production Analysis 2020 & 2033
- Table 80: Global Commercial Greenhouse Industry Volume Kiloton Forecast, by Production Analysis 2020 & 2033
- Table 81: Global Commercial Greenhouse Industry Revenue Million Forecast, by Consumption Analysis 2020 & 2033
- Table 82: Global Commercial Greenhouse Industry Volume Kiloton Forecast, by Consumption Analysis 2020 & 2033
- Table 83: Global Commercial Greenhouse Industry Revenue Million Forecast, by Import Market Analysis (Value & Volume) 2020 & 2033
- Table 84: Global Commercial Greenhouse Industry Volume Kiloton Forecast, by Import Market Analysis (Value & Volume) 2020 & 2033
- Table 85: Global Commercial Greenhouse Industry Revenue Million Forecast, by Export Market Analysis (Value & Volume) 2020 & 2033
- Table 86: Global Commercial Greenhouse Industry Volume Kiloton Forecast, by Export Market Analysis (Value & Volume) 2020 & 2033
- Table 87: Global Commercial Greenhouse Industry Revenue Million Forecast, by Price Trend Analysis 2020 & 2033
- Table 88: Global Commercial Greenhouse Industry Volume Kiloton Forecast, by Price Trend Analysis 2020 & 2033
- Table 89: Global Commercial Greenhouse Industry Revenue Million Forecast, by Country 2020 & 2033
- Table 90: Global Commercial Greenhouse Industry Volume Kiloton Forecast, by Country 2020 & 2033
- Table 91: Turkey Commercial Greenhouse Industry Revenue (Million) Forecast, by Application 2020 & 2033
- Table 92: Turkey Commercial Greenhouse Industry Volume (Kiloton) Forecast, by Application 2020 & 2033
- Table 93: Israel Commercial Greenhouse Industry Revenue (Million) Forecast, by Application 2020 & 2033
- Table 94: Israel Commercial Greenhouse Industry Volume (Kiloton) Forecast, by Application 2020 & 2033
- Table 95: GCC Commercial Greenhouse Industry Revenue (Million) Forecast, by Application 2020 & 2033
- Table 96: GCC Commercial Greenhouse Industry Volume (Kiloton) Forecast, by Application 2020 & 2033
- Table 97: North Africa Commercial Greenhouse Industry Revenue (Million) Forecast, by Application 2020 & 2033
- Table 98: North Africa Commercial Greenhouse Industry Volume (Kiloton) Forecast, by Application 2020 & 2033
- Table 99: South Africa Commercial Greenhouse Industry Revenue (Million) Forecast, by Application 2020 & 2033
- Table 100: South Africa Commercial Greenhouse Industry Volume (Kiloton) Forecast, by Application 2020 & 2033
- Table 101: Rest of Middle East & Africa Commercial Greenhouse Industry Revenue (Million) Forecast, by Application 2020 & 2033
- Table 102: Rest of Middle East & Africa Commercial Greenhouse Industry Volume (Kiloton) Forecast, by Application 2020 & 2033
- Table 103: Global Commercial Greenhouse Industry Revenue Million Forecast, by Production Analysis 2020 & 2033
- Table 104: Global Commercial Greenhouse Industry Volume Kiloton Forecast, by Production Analysis 2020 & 2033
- Table 105: Global Commercial Greenhouse Industry Revenue Million Forecast, by Consumption Analysis 2020 & 2033
- Table 106: Global Commercial Greenhouse Industry Volume Kiloton Forecast, by Consumption Analysis 2020 & 2033
- Table 107: Global Commercial Greenhouse Industry Revenue Million Forecast, by Import Market Analysis (Value & Volume) 2020 & 2033
- Table 108: Global Commercial Greenhouse Industry Volume Kiloton Forecast, by Import Market Analysis (Value & Volume) 2020 & 2033
- Table 109: Global Commercial Greenhouse Industry Revenue Million Forecast, by Export Market Analysis (Value & Volume) 2020 & 2033
- Table 110: Global Commercial Greenhouse Industry Volume Kiloton Forecast, by Export Market Analysis (Value & Volume) 2020 & 2033
- Table 111: Global Commercial Greenhouse Industry Revenue Million Forecast, by Price Trend Analysis 2020 & 2033
- Table 112: Global Commercial Greenhouse Industry Volume Kiloton Forecast, by Price Trend Analysis 2020 & 2033
- Table 113: Global Commercial Greenhouse Industry Revenue Million Forecast, by Country 2020 & 2033
- Table 114: Global Commercial Greenhouse Industry Volume Kiloton Forecast, by Country 2020 & 2033
- Table 115: China Commercial Greenhouse Industry Revenue (Million) Forecast, by Application 2020 & 2033
- Table 116: China Commercial Greenhouse Industry Volume (Kiloton) Forecast, by Application 2020 & 2033
- Table 117: India Commercial Greenhouse Industry Revenue (Million) Forecast, by Application 2020 & 2033
- Table 118: India Commercial Greenhouse Industry Volume (Kiloton) Forecast, by Application 2020 & 2033
- Table 119: Japan Commercial Greenhouse Industry Revenue (Million) Forecast, by Application 2020 & 2033
- Table 120: Japan Commercial Greenhouse Industry Volume (Kiloton) Forecast, by Application 2020 & 2033
- Table 121: South Korea Commercial Greenhouse Industry Revenue (Million) Forecast, by Application 2020 & 2033
- Table 122: South Korea Commercial Greenhouse Industry Volume (Kiloton) Forecast, by Application 2020 & 2033
- Table 123: ASEAN Commercial Greenhouse Industry Revenue (Million) Forecast, by Application 2020 & 2033
- Table 124: ASEAN Commercial Greenhouse Industry Volume (Kiloton) Forecast, by Application 2020 & 2033
- Table 125: Oceania Commercial Greenhouse Industry Revenue (Million) Forecast, by Application 2020 & 2033
- Table 126: Oceania Commercial Greenhouse Industry Volume (Kiloton) Forecast, by Application 2020 & 2033
- Table 127: Rest of Asia Pacific Commercial Greenhouse Industry Revenue (Million) Forecast, by Application 2020 & 2033
- Table 128: Rest of Asia Pacific Commercial Greenhouse Industry Volume (Kiloton) Forecast, by Application 2020 & 2033
Frequently Asked Questions
1. What is the projected Compound Annual Growth Rate (CAGR) of the Commercial Greenhouse Industry?
The projected CAGR is approximately 7.00%.
2. Which companies are prominent players in the Commercial Greenhouse Industry?
Key companies in the market include Lumigrow Inc, Certhon, Heliospectra AB, Richel Group, Argus Control Systems Ltd, Agra Tech Inc *List Not Exhaustive, Rough Brothers Inc, Logiqs BV, International Greenhouse Company, Gibraltar Industries (Nexus Corporation).
3. What are the main segments of the Commercial Greenhouse Industry?
The market segments include Production Analysis, Consumption Analysis, Import Market Analysis (Value & Volume), Export Market Analysis (Value & Volume), Price Trend Analysis.
4. Can you provide details about the market size?
The market size is estimated to be USD 47.76 Million as of 2022.
5. What are some drivers contributing to market growth?
Decreasing Per Capita Arable Land; Increased Demand for Food.
6. What are the notable trends driving market growth?
Horticultural Crops Are In High Demand.
7. Are there any restraints impacting market growth?
High Initial Investments; Requirement of Precision Agriculture.
8. Can you provide examples of recent developments in the market?
September 2023: Richel Group has been in a three-year, exclusive strategic partnership to increase its efficiency in designing, manufacturing, and building high-tech greenhouses in challenging climates and distant regions, including the Middle East and Asia.
9. What pricing options are available for accessing the report?
Pricing options include single-user, multi-user, and enterprise licenses priced at USD 4750, USD 5250, and USD 8750 respectively.
10. Is the market size provided in terms of value or volume?
The market size is provided in terms of value, measured in Million and volume, measured in Kiloton.
11. Are there any specific market keywords associated with the report?
Yes, the market keyword associated with the report is "Commercial Greenhouse Industry," which aids in identifying and referencing the specific market segment covered.
12. How do I determine which pricing option suits my needs best?
The pricing options vary based on user requirements and access needs. Individual users may opt for single-user licenses, while businesses requiring broader access may choose multi-user or enterprise licenses for cost-effective access to the report.
13. Are there any additional resources or data provided in the Commercial Greenhouse Industry report?
While the report offers comprehensive insights, it's advisable to review the specific contents or supplementary materials provided to ascertain if additional resources or data are available.
14. How can I stay updated on further developments or reports in the Commercial Greenhouse Industry?
To stay informed about further developments, trends, and reports in the Commercial Greenhouse Industry, consider subscribing to industry newsletters, following relevant companies and organizations, or regularly checking reputable industry news sources and publications.
Methodology
Step 1 - Identification of Relevant Samples Size from Population Database


Step 2 - Approaches for Defining Global Market Size (Value, Volume* & Price*)

Note*: In applicable scenarios
Step 3 - Data Sources
Primary Research
- Web Analytics
- Survey Reports
- Research Institute
- Latest Research Reports
- Opinion Leaders
Secondary Research
- Annual Reports
- White Paper
- Latest Press Release
- Industry Association
- Paid Database
- Investor Presentations

Step 4 - Data Triangulation
Involves using different sources of information in order to increase the validity of a study
These sources are likely to be stakeholders in a program - participants, other researchers, program staff, other community members, and so on.
Then we put all data in single framework & apply various statistical tools to find out the dynamic on the market.
During the analysis stage, feedback from the stakeholder groups would be compared to determine areas of agreement as well as areas of divergence