

Key Insights
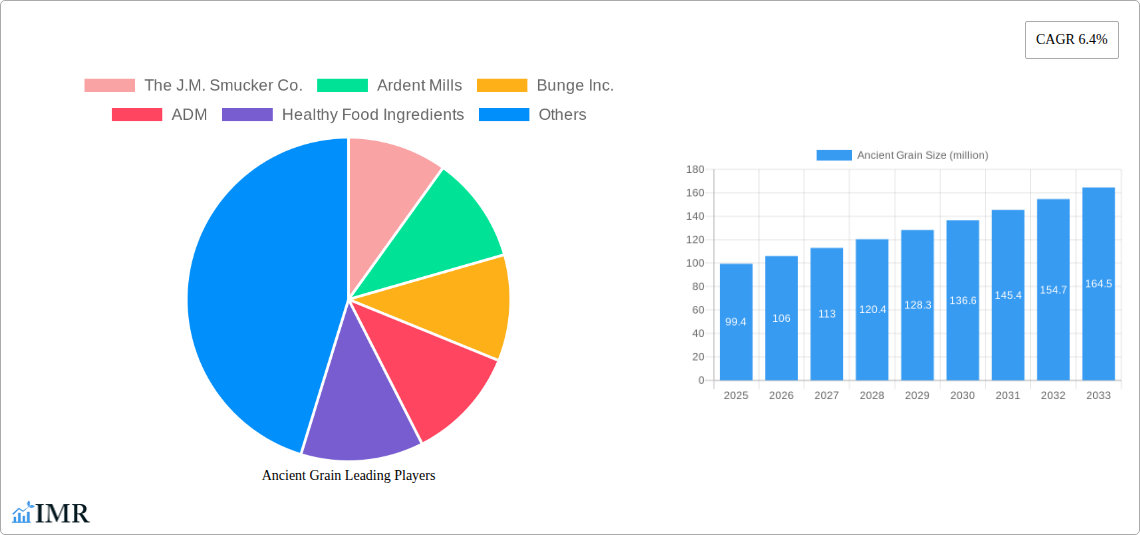
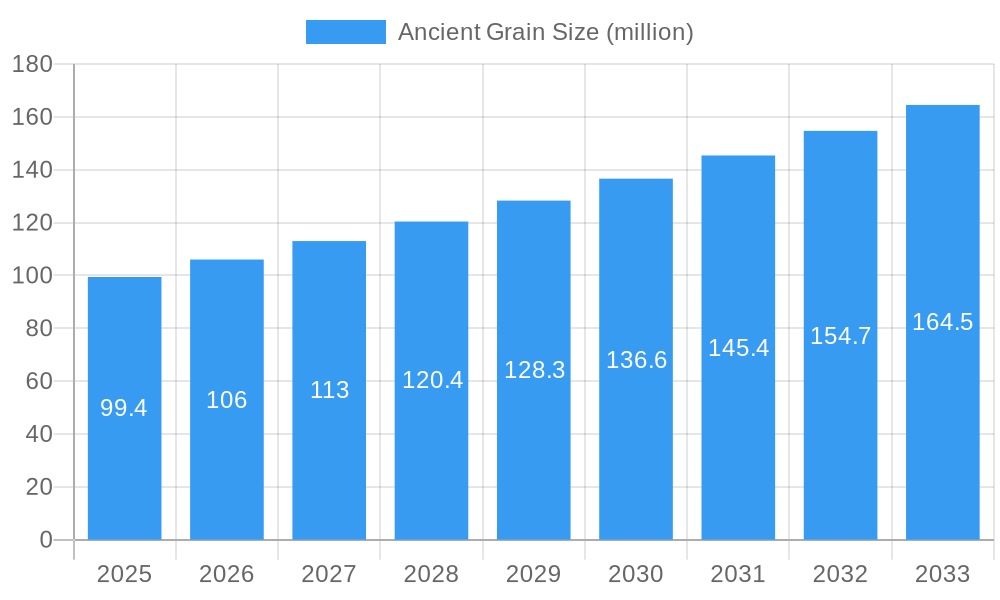
The global ancient grains market is poised for significant expansion, projected to reach $2.9 billion by 2025, with a Compound Annual Growth Rate (CAGR) of 6.67%. This growth is propelled by escalating consumer demand for healthier food options, driven by increased awareness of the nutritional advantages offered by ancient grains such as quinoa, amaranth, and farro. These nutrient-dense alternatives provide superior protein, fiber, and essential nutrients compared to conventional grains, aligning with the rising popularity of gluten-free diets and the demand for functional foods. Innovations in the food and beverage sector are further expanding the market, with ancient grains increasingly integrated into diverse product lines, including baked goods, cereals, and snacks. Leading companies, including The J.M. Smucker Co., Ardent Mills, and Bunge Inc., are investing in R&D and product diversification to capture market share. Enhanced accessibility through conventional and online retail channels also supports market growth.
Ancient Grain Market Size (In Billion)
While challenges such as higher production costs and processing complexities exist, ongoing research aims to improve cultivation efficiency and yield. Strategic market expansion into emerging economies, coupled with key industry collaborations and acquisitions, presents substantial growth prospects. The forecast period, from the base year of 2025 to 2033, indicates a sustained upward trend, primarily fueled by the persistent consumer preference for nutritious and varied food choices.
Ancient Grain Company Market Share
Ancient Grain Market Report: 2019-2033
This comprehensive report provides an in-depth analysis of the ancient grain market, encompassing market dynamics, growth trends, regional dominance, product landscape, key players, and future outlook. The study period spans 2019-2033, with 2025 serving as the base and estimated year. The forecast period is 2025-2033, and the historical period covers 2019-2024. This report is invaluable for industry professionals, investors, and anyone seeking to understand the complexities and opportunities within this rapidly evolving market. The market size is projected to reach xx million by 2033.
Ancient Grain Market Dynamics & Structure
This section analyzes the competitive landscape, technological advancements, regulatory influences, and market trends influencing the ancient grain industry. The market is characterized by a moderately concentrated structure, with key players holding significant market share, but also exhibiting considerable fragmentation among smaller, niche players.
- Market Concentration: The top five players hold an estimated 35% market share in 2025.
- Technological Innovation: Advancements in processing and preservation techniques are driving growth, alongside innovations in product formulation and diversification.
- Regulatory Framework: Varying food safety regulations across regions create both challenges and opportunities for market expansion.
- Competitive Substitutes: Traditional grains and other sources of carbohydrates pose competitive pressure.
- End-User Demographics: Growing consumer awareness of health benefits and dietary diversification fuels market demand, particularly among health-conscious millennials and Gen Z.
- M&A Trends: The past five years have witnessed xx M&A deals, primarily driven by consolidation and expansion efforts among larger players. This trend is expected to continue, increasing market concentration in the coming years.
- Innovation Barriers: High initial investment costs in processing technologies and the need for specialized expertise are key barriers for new entrants.
Ancient Grain Growth Trends & Insights
The ancient grain market has witnessed robust growth over the past five years, driven by increasing consumer demand for healthier food options and a growing awareness of the nutritional benefits of ancient grains. The market size is expected to experience a Compound Annual Growth Rate (CAGR) of xx% from 2025 to 2033. This growth is propelled by several factors including:
- Rising Health Consciousness: Consumers are increasingly seeking nutrient-dense foods, leading to a surge in demand for ancient grains, renowned for their high fiber, protein, and mineral content.
- Dietary Diversification: Consumers are actively seeking to diversify their diets, and ancient grains offer a palatable and nutritious alternative to traditional grains.
- Technological Advancements: Innovations in processing and preservation technologies have enhanced the availability and convenience of ancient grains, boosting market accessibility.
- Product Diversification: The expansion of product offerings, ranging from whole grains to flours, snacks, and ready-to-eat meals, has broadened market appeal.
- Increased Availability: Greater retail distribution channels and online accessibility have significantly improved the availability of ancient grains to consumers.
- Market Penetration: Market penetration in developed regions is relatively high, while emerging markets offer significant growth potential.
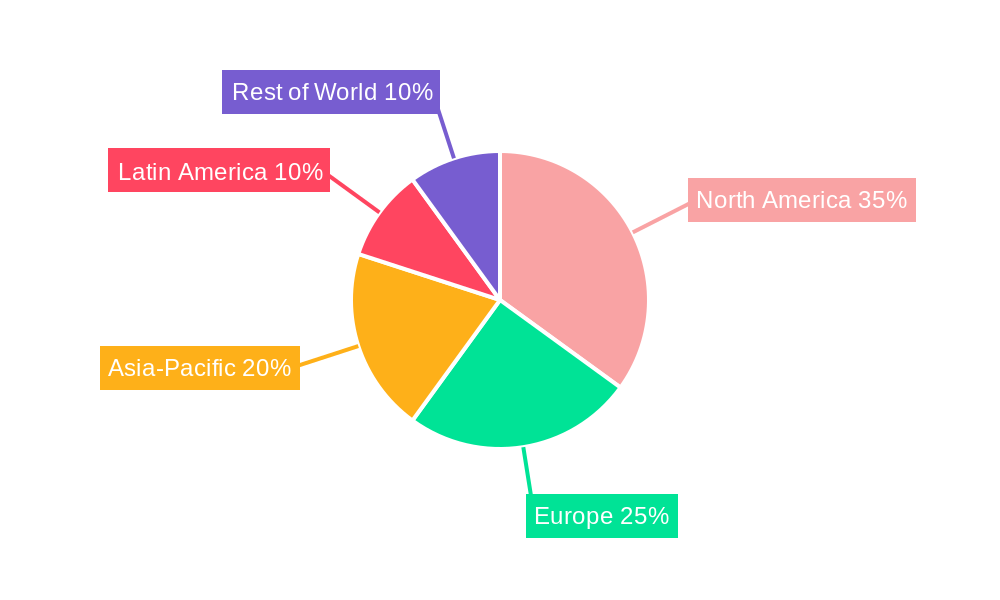
Dominant Regions, Countries, or Segments in Ancient Grain
North America currently dominates the ancient grain market, accounting for xx% of global market share in 2025. This dominance is primarily attributed to high consumer awareness, strong purchasing power, and well-established distribution networks. However, regions like Asia-Pacific are experiencing rapid growth, driven by rising disposable incomes and increasing health consciousness.
- North America: High consumption of ancient grains in baked goods and breakfast cereals; strong retail infrastructure.
- Europe: Growing demand for organic and sustainably produced ancient grains; expanding food service industry.
- Asia-Pacific: Rapid economic growth and increasing health awareness driving market expansion; rising demand for functional foods.
- Latin America: Significant production of certain ancient grains like quinoa; export-oriented economies.
- Rest of the World: Diverse consumption patterns with regional preferences for specific ancient grains.
Ancient Grain Product Landscape
The ancient grain market showcases a diverse product landscape, encompassing various forms such as whole grains, flours, flakes, and ready-to-eat products. Innovations focus on improving taste, texture, and nutritional value, with an increasing emphasis on convenience and ready-to-consume options. Key advancements include the development of gluten-free ancient grain blends and the introduction of fortified products enriched with vitamins and minerals. Unique selling propositions often revolve around health benefits, sustainability claims, and unique flavor profiles.
Key Drivers, Barriers & Challenges in Ancient Grain
Key Drivers:
- Growing demand for healthy and nutritious foods.
- Increasing awareness of the health benefits of ancient grains.
- Rising disposable incomes in emerging economies.
- Government initiatives promoting healthy eating habits.
- Technological advancements in food processing and preservation.
Key Challenges:
- Price volatility of raw materials.
- Limited availability of certain ancient grains.
- Supply chain complexities, especially for niche grains.
- Stricter food safety regulations in some regions.
- Competition from traditional grains and other food products. The impact of these challenges is estimated to reduce market growth by approximately xx% over the forecast period.
Emerging Opportunities in Ancient Grain
- Expansion into untapped markets: Focus on emerging economies with significant growth potential.
- Development of innovative food products: Explore new applications in ready-to-eat meals, snacks, and beverages.
- Increased use of ancient grains in the food service industry: Target restaurants, cafes, and institutional catering.
- Production of organic and sustainably produced ancient grains.
- Leveraging the growing interest in plant-based diets.
Growth Accelerators in the Ancient Grain Industry
Several factors will significantly contribute to the long-term growth of the ancient grain market, including technological advancements in food processing that improve product quality, taste, and shelf life; strategic partnerships among food producers, retailers, and researchers to create innovative products and improve supply chain efficiency; and increased marketing efforts to educate consumers on the health benefits of ancient grains and to raise overall market awareness.
Key Players Shaping the Ancient Grain Market
- The J.M. Smucker Co.
- Ardent Mills
- Bunge Inc.
- ADM
- Healthy Food Ingredients, LLC.
- Factoria Quinoa Zona Franca S.A.S.
- Urbane Grain Inc.
- Nature's Path Foods
- FutureCeuticals Inc.
- Sunnyland Mills
- Manini's, LLC
Notable Milestones in Ancient Grain Sector
- 2020: Increased investment in research and development of ancient grain-based products.
- 2021: Several key players launched new product lines featuring ancient grains.
- 2022: Significant increase in retail shelf space dedicated to ancient grain products.
- 2023: Growing number of partnerships between ancient grain producers and food manufacturers.
- 2024: New regulations impacting the ancient grain industry were implemented in several key markets.
In-Depth Ancient Grain Market Outlook
The ancient grain market is poised for sustained growth, driven by ongoing consumer preference for healthy foods, technological advancements in production and processing, and strategic initiatives by major players. The market's expansion into new geographic regions and the development of innovative product applications will further fuel this growth. Strategic partnerships and a focus on sustainability will be crucial for success in this competitive yet promising market. The projected market value in 2033 presents a substantial opportunity for investors and industry participants alike.
Ancient Grain Segmentation
-
1. Application
- 1.1. Bakery and Confectionery Products
- 1.2. Snacks
- 1.3. Direct Eating
- 1.4. Others
-
2. Type
- 2.1. Gluten Free Ancient Grain
- 2.2. Gluten Containing Ancient Grain
Ancient Grain Segmentation By Geography
-
1. North America
- 1.1. United States
- 1.2. Canada
- 1.3. Mexico
-
2. South America
- 2.1. Brazil
- 2.2. Argentina
- 2.3. Rest of South America
-
3. Europe
- 3.1. United Kingdom
- 3.2. Germany
- 3.3. France
- 3.4. Italy
- 3.5. Spain
- 3.6. Russia
- 3.7. Benelux
- 3.8. Nordics
- 3.9. Rest of Europe
-
4. Middle East & Africa
- 4.1. Turkey
- 4.2. Israel
- 4.3. GCC
- 4.4. North Africa
- 4.5. South Africa
- 4.6. Rest of Middle East & Africa
-
5. Asia Pacific
- 5.1. China
- 5.2. India
- 5.3. Japan
- 5.4. South Korea
- 5.5. ASEAN
- 5.6. Oceania
- 5.7. Rest of Asia Pacific
Ancient Grain Regional Market Share
Geographic Coverage of Ancient Grain
Ancient Grain REPORT HIGHLIGHTS
| Aspects | Details |
|---|---|
| Study Period | 2020-2034 |
| Base Year | 2025 |
| Estimated Year | 2026 |
| Forecast Period | 2026-2034 |
| Historical Period | 2020-2025 |
| Growth Rate | CAGR of 6.67% from 2020-2034 |
| Segmentation |
|
Table of Contents
- 1. Introduction
- 1.1. Research Scope
- 1.2. Market Segmentation
- 1.3. Research Methodology
- 1.4. Definitions and Assumptions
- 2. Executive Summary
- 2.1. Introduction
- 3. Market Dynamics
- 3.1. Introduction
- 3.2. Market Drivers
- 3.3. Market Restrains
- 3.4. Market Trends
- 4. Market Factor Analysis
- 4.1. Porters Five Forces
- 4.2. Supply/Value Chain
- 4.3. PESTEL analysis
- 4.4. Market Entropy
- 4.5. Patent/Trademark Analysis
- 5. Global Ancient Grain Analysis, Insights and Forecast, 2020-2032
- 5.1. Market Analysis, Insights and Forecast - by Application
- 5.1.1. Bakery and Confectionery Products
- 5.1.2. Snacks
- 5.1.3. Direct Eating
- 5.1.4. Others
- 5.2. Market Analysis, Insights and Forecast - by Type
- 5.2.1. Gluten Free Ancient Grain
- 5.2.2. Gluten Containing Ancient Grain
- 5.3. Market Analysis, Insights and Forecast - by Region
- 5.3.1. North America
- 5.3.2. South America
- 5.3.3. Europe
- 5.3.4. Middle East & Africa
- 5.3.5. Asia Pacific
- 5.1. Market Analysis, Insights and Forecast - by Application
- 6. North America Ancient Grain Analysis, Insights and Forecast, 2020-2032
- 6.1. Market Analysis, Insights and Forecast - by Application
- 6.1.1. Bakery and Confectionery Products
- 6.1.2. Snacks
- 6.1.3. Direct Eating
- 6.1.4. Others
- 6.2. Market Analysis, Insights and Forecast - by Type
- 6.2.1. Gluten Free Ancient Grain
- 6.2.2. Gluten Containing Ancient Grain
- 6.1. Market Analysis, Insights and Forecast - by Application
- 7. South America Ancient Grain Analysis, Insights and Forecast, 2020-2032
- 7.1. Market Analysis, Insights and Forecast - by Application
- 7.1.1. Bakery and Confectionery Products
- 7.1.2. Snacks
- 7.1.3. Direct Eating
- 7.1.4. Others
- 7.2. Market Analysis, Insights and Forecast - by Type
- 7.2.1. Gluten Free Ancient Grain
- 7.2.2. Gluten Containing Ancient Grain
- 7.1. Market Analysis, Insights and Forecast - by Application
- 8. Europe Ancient Grain Analysis, Insights and Forecast, 2020-2032
- 8.1. Market Analysis, Insights and Forecast - by Application
- 8.1.1. Bakery and Confectionery Products
- 8.1.2. Snacks
- 8.1.3. Direct Eating
- 8.1.4. Others
- 8.2. Market Analysis, Insights and Forecast - by Type
- 8.2.1. Gluten Free Ancient Grain
- 8.2.2. Gluten Containing Ancient Grain
- 8.1. Market Analysis, Insights and Forecast - by Application
- 9. Middle East & Africa Ancient Grain Analysis, Insights and Forecast, 2020-2032
- 9.1. Market Analysis, Insights and Forecast - by Application
- 9.1.1. Bakery and Confectionery Products
- 9.1.2. Snacks
- 9.1.3. Direct Eating
- 9.1.4. Others
- 9.2. Market Analysis, Insights and Forecast - by Type
- 9.2.1. Gluten Free Ancient Grain
- 9.2.2. Gluten Containing Ancient Grain
- 9.1. Market Analysis, Insights and Forecast - by Application
- 10. Asia Pacific Ancient Grain Analysis, Insights and Forecast, 2020-2032
- 10.1. Market Analysis, Insights and Forecast - by Application
- 10.1.1. Bakery and Confectionery Products
- 10.1.2. Snacks
- 10.1.3. Direct Eating
- 10.1.4. Others
- 10.2. Market Analysis, Insights and Forecast - by Type
- 10.2.1. Gluten Free Ancient Grain
- 10.2.2. Gluten Containing Ancient Grain
- 10.1. Market Analysis, Insights and Forecast - by Application
- 11. Competitive Analysis
- 11.1. Global Market Share Analysis 2025
- 11.2. Company Profiles
- 11.2.1 The J.M. Smucker Co.
- 11.2.1.1. Overview
- 11.2.1.2. Products
- 11.2.1.3. SWOT Analysis
- 11.2.1.4. Recent Developments
- 11.2.1.5. Financials (Based on Availability)
- 11.2.2 Ardent Mills
- 11.2.2.1. Overview
- 11.2.2.2. Products
- 11.2.2.3. SWOT Analysis
- 11.2.2.4. Recent Developments
- 11.2.2.5. Financials (Based on Availability)
- 11.2.3 Bunge Inc.
- 11.2.3.1. Overview
- 11.2.3.2. Products
- 11.2.3.3. SWOT Analysis
- 11.2.3.4. Recent Developments
- 11.2.3.5. Financials (Based on Availability)
- 11.2.4 ADM
- 11.2.4.1. Overview
- 11.2.4.2. Products
- 11.2.4.3. SWOT Analysis
- 11.2.4.4. Recent Developments
- 11.2.4.5. Financials (Based on Availability)
- 11.2.5 Healthy Food Ingredients
- 11.2.5.1. Overview
- 11.2.5.2. Products
- 11.2.5.3. SWOT Analysis
- 11.2.5.4. Recent Developments
- 11.2.5.5. Financials (Based on Availability)
- 11.2.6 LLC.
- 11.2.6.1. Overview
- 11.2.6.2. Products
- 11.2.6.3. SWOT Analysis
- 11.2.6.4. Recent Developments
- 11.2.6.5. Financials (Based on Availability)
- 11.2.7 Factoria Quinoa Zona Franca S.A.S.
- 11.2.7.1. Overview
- 11.2.7.2. Products
- 11.2.7.3. SWOT Analysis
- 11.2.7.4. Recent Developments
- 11.2.7.5. Financials (Based on Availability)
- 11.2.8 Urbane Grain Inc.
- 11.2.8.1. Overview
- 11.2.8.2. Products
- 11.2.8.3. SWOT Analysis
- 11.2.8.4. Recent Developments
- 11.2.8.5. Financials (Based on Availability)
- 11.2.9 Nature's Path Foods
- 11.2.9.1. Overview
- 11.2.9.2. Products
- 11.2.9.3. SWOT Analysis
- 11.2.9.4. Recent Developments
- 11.2.9.5. Financials (Based on Availability)
- 11.2.10 FutureCeuticals Inc.
- 11.2.10.1. Overview
- 11.2.10.2. Products
- 11.2.10.3. SWOT Analysis
- 11.2.10.4. Recent Developments
- 11.2.10.5. Financials (Based on Availability)
- 11.2.11 Sunnyland Mills
- 11.2.11.1. Overview
- 11.2.11.2. Products
- 11.2.11.3. SWOT Analysis
- 11.2.11.4. Recent Developments
- 11.2.11.5. Financials (Based on Availability)
- 11.2.12 Manini's
- 11.2.12.1. Overview
- 11.2.12.2. Products
- 11.2.12.3. SWOT Analysis
- 11.2.12.4. Recent Developments
- 11.2.12.5. Financials (Based on Availability)
- 11.2.13 LLC
- 11.2.13.1. Overview
- 11.2.13.2. Products
- 11.2.13.3. SWOT Analysis
- 11.2.13.4. Recent Developments
- 11.2.13.5. Financials (Based on Availability)
- 11.2.1 The J.M. Smucker Co.
List of Figures
- Figure 1: Global Ancient Grain Revenue Breakdown (billion, %) by Region 2025 & 2033
- Figure 2: North America Ancient Grain Revenue (billion), by Application 2025 & 2033
- Figure 3: North America Ancient Grain Revenue Share (%), by Application 2025 & 2033
- Figure 4: North America Ancient Grain Revenue (billion), by Type 2025 & 2033
- Figure 5: North America Ancient Grain Revenue Share (%), by Type 2025 & 2033
- Figure 6: North America Ancient Grain Revenue (billion), by Country 2025 & 2033
- Figure 7: North America Ancient Grain Revenue Share (%), by Country 2025 & 2033
- Figure 8: South America Ancient Grain Revenue (billion), by Application 2025 & 2033
- Figure 9: South America Ancient Grain Revenue Share (%), by Application 2025 & 2033
- Figure 10: South America Ancient Grain Revenue (billion), by Type 2025 & 2033
- Figure 11: South America Ancient Grain Revenue Share (%), by Type 2025 & 2033
- Figure 12: South America Ancient Grain Revenue (billion), by Country 2025 & 2033
- Figure 13: South America Ancient Grain Revenue Share (%), by Country 2025 & 2033
- Figure 14: Europe Ancient Grain Revenue (billion), by Application 2025 & 2033
- Figure 15: Europe Ancient Grain Revenue Share (%), by Application 2025 & 2033
- Figure 16: Europe Ancient Grain Revenue (billion), by Type 2025 & 2033
- Figure 17: Europe Ancient Grain Revenue Share (%), by Type 2025 & 2033
- Figure 18: Europe Ancient Grain Revenue (billion), by Country 2025 & 2033
- Figure 19: Europe Ancient Grain Revenue Share (%), by Country 2025 & 2033
- Figure 20: Middle East & Africa Ancient Grain Revenue (billion), by Application 2025 & 2033
- Figure 21: Middle East & Africa Ancient Grain Revenue Share (%), by Application 2025 & 2033
- Figure 22: Middle East & Africa Ancient Grain Revenue (billion), by Type 2025 & 2033
- Figure 23: Middle East & Africa Ancient Grain Revenue Share (%), by Type 2025 & 2033
- Figure 24: Middle East & Africa Ancient Grain Revenue (billion), by Country 2025 & 2033
- Figure 25: Middle East & Africa Ancient Grain Revenue Share (%), by Country 2025 & 2033
- Figure 26: Asia Pacific Ancient Grain Revenue (billion), by Application 2025 & 2033
- Figure 27: Asia Pacific Ancient Grain Revenue Share (%), by Application 2025 & 2033
- Figure 28: Asia Pacific Ancient Grain Revenue (billion), by Type 2025 & 2033
- Figure 29: Asia Pacific Ancient Grain Revenue Share (%), by Type 2025 & 2033
- Figure 30: Asia Pacific Ancient Grain Revenue (billion), by Country 2025 & 2033
- Figure 31: Asia Pacific Ancient Grain Revenue Share (%), by Country 2025 & 2033
List of Tables
- Table 1: Global Ancient Grain Revenue billion Forecast, by Application 2020 & 2033
- Table 2: Global Ancient Grain Revenue billion Forecast, by Type 2020 & 2033
- Table 3: Global Ancient Grain Revenue billion Forecast, by Region 2020 & 2033
- Table 4: Global Ancient Grain Revenue billion Forecast, by Application 2020 & 2033
- Table 5: Global Ancient Grain Revenue billion Forecast, by Type 2020 & 2033
- Table 6: Global Ancient Grain Revenue billion Forecast, by Country 2020 & 2033
- Table 7: United States Ancient Grain Revenue (billion) Forecast, by Application 2020 & 2033
- Table 8: Canada Ancient Grain Revenue (billion) Forecast, by Application 2020 & 2033
- Table 9: Mexico Ancient Grain Revenue (billion) Forecast, by Application 2020 & 2033
- Table 10: Global Ancient Grain Revenue billion Forecast, by Application 2020 & 2033
- Table 11: Global Ancient Grain Revenue billion Forecast, by Type 2020 & 2033
- Table 12: Global Ancient Grain Revenue billion Forecast, by Country 2020 & 2033
- Table 13: Brazil Ancient Grain Revenue (billion) Forecast, by Application 2020 & 2033
- Table 14: Argentina Ancient Grain Revenue (billion) Forecast, by Application 2020 & 2033
- Table 15: Rest of South America Ancient Grain Revenue (billion) Forecast, by Application 2020 & 2033
- Table 16: Global Ancient Grain Revenue billion Forecast, by Application 2020 & 2033
- Table 17: Global Ancient Grain Revenue billion Forecast, by Type 2020 & 2033
- Table 18: Global Ancient Grain Revenue billion Forecast, by Country 2020 & 2033
- Table 19: United Kingdom Ancient Grain Revenue (billion) Forecast, by Application 2020 & 2033
- Table 20: Germany Ancient Grain Revenue (billion) Forecast, by Application 2020 & 2033
- Table 21: France Ancient Grain Revenue (billion) Forecast, by Application 2020 & 2033
- Table 22: Italy Ancient Grain Revenue (billion) Forecast, by Application 2020 & 2033
- Table 23: Spain Ancient Grain Revenue (billion) Forecast, by Application 2020 & 2033
- Table 24: Russia Ancient Grain Revenue (billion) Forecast, by Application 2020 & 2033
- Table 25: Benelux Ancient Grain Revenue (billion) Forecast, by Application 2020 & 2033
- Table 26: Nordics Ancient Grain Revenue (billion) Forecast, by Application 2020 & 2033
- Table 27: Rest of Europe Ancient Grain Revenue (billion) Forecast, by Application 2020 & 2033
- Table 28: Global Ancient Grain Revenue billion Forecast, by Application 2020 & 2033
- Table 29: Global Ancient Grain Revenue billion Forecast, by Type 2020 & 2033
- Table 30: Global Ancient Grain Revenue billion Forecast, by Country 2020 & 2033
- Table 31: Turkey Ancient Grain Revenue (billion) Forecast, by Application 2020 & 2033
- Table 32: Israel Ancient Grain Revenue (billion) Forecast, by Application 2020 & 2033
- Table 33: GCC Ancient Grain Revenue (billion) Forecast, by Application 2020 & 2033
- Table 34: North Africa Ancient Grain Revenue (billion) Forecast, by Application 2020 & 2033
- Table 35: South Africa Ancient Grain Revenue (billion) Forecast, by Application 2020 & 2033
- Table 36: Rest of Middle East & Africa Ancient Grain Revenue (billion) Forecast, by Application 2020 & 2033
- Table 37: Global Ancient Grain Revenue billion Forecast, by Application 2020 & 2033
- Table 38: Global Ancient Grain Revenue billion Forecast, by Type 2020 & 2033
- Table 39: Global Ancient Grain Revenue billion Forecast, by Country 2020 & 2033
- Table 40: China Ancient Grain Revenue (billion) Forecast, by Application 2020 & 2033
- Table 41: India Ancient Grain Revenue (billion) Forecast, by Application 2020 & 2033
- Table 42: Japan Ancient Grain Revenue (billion) Forecast, by Application 2020 & 2033
- Table 43: South Korea Ancient Grain Revenue (billion) Forecast, by Application 2020 & 2033
- Table 44: ASEAN Ancient Grain Revenue (billion) Forecast, by Application 2020 & 2033
- Table 45: Oceania Ancient Grain Revenue (billion) Forecast, by Application 2020 & 2033
- Table 46: Rest of Asia Pacific Ancient Grain Revenue (billion) Forecast, by Application 2020 & 2033
Frequently Asked Questions
1. What is the projected Compound Annual Growth Rate (CAGR) of the Ancient Grain?
The projected CAGR is approximately 6.67%.
2. Which companies are prominent players in the Ancient Grain?
Key companies in the market include The J.M. Smucker Co., Ardent Mills, Bunge Inc., ADM, Healthy Food Ingredients, LLC., Factoria Quinoa Zona Franca S.A.S., Urbane Grain Inc., Nature's Path Foods, FutureCeuticals Inc., Sunnyland Mills, Manini's, LLC.
3. What are the main segments of the Ancient Grain?
The market segments include Application, Type.
4. Can you provide details about the market size?
The market size is estimated to be USD 2.9 billion as of 2022.
5. What are some drivers contributing to market growth?
N/A
6. What are the notable trends driving market growth?
N/A
7. Are there any restraints impacting market growth?
N/A
8. Can you provide examples of recent developments in the market?
N/A
9. What pricing options are available for accessing the report?
Pricing options include single-user, multi-user, and enterprise licenses priced at USD 5900.00, USD 8850.00, and USD 11800.00 respectively.
10. Is the market size provided in terms of value or volume?
The market size is provided in terms of value, measured in billion.
11. Are there any specific market keywords associated with the report?
Yes, the market keyword associated with the report is "Ancient Grain," which aids in identifying and referencing the specific market segment covered.
12. How do I determine which pricing option suits my needs best?
The pricing options vary based on user requirements and access needs. Individual users may opt for single-user licenses, while businesses requiring broader access may choose multi-user or enterprise licenses for cost-effective access to the report.
13. Are there any additional resources or data provided in the Ancient Grain report?
While the report offers comprehensive insights, it's advisable to review the specific contents or supplementary materials provided to ascertain if additional resources or data are available.
14. How can I stay updated on further developments or reports in the Ancient Grain?
To stay informed about further developments, trends, and reports in the Ancient Grain, consider subscribing to industry newsletters, following relevant companies and organizations, or regularly checking reputable industry news sources and publications.
Methodology
Step 1 - Identification of Relevant Samples Size from Population Database


Step 2 - Approaches for Defining Global Market Size (Value, Volume* & Price*)

Note*: In applicable scenarios
Step 3 - Data Sources
Primary Research
- Web Analytics
- Survey Reports
- Research Institute
- Latest Research Reports
- Opinion Leaders
Secondary Research
- Annual Reports
- White Paper
- Latest Press Release
- Industry Association
- Paid Database
- Investor Presentations

Step 4 - Data Triangulation
Involves using different sources of information in order to increase the validity of a study
These sources are likely to be stakeholders in a program - participants, other researchers, program staff, other community members, and so on.
Then we put all data in single framework & apply various statistical tools to find out the dynamic on the market.
During the analysis stage, feedback from the stakeholder groups would be compared to determine areas of agreement as well as areas of divergence