

Key Insights
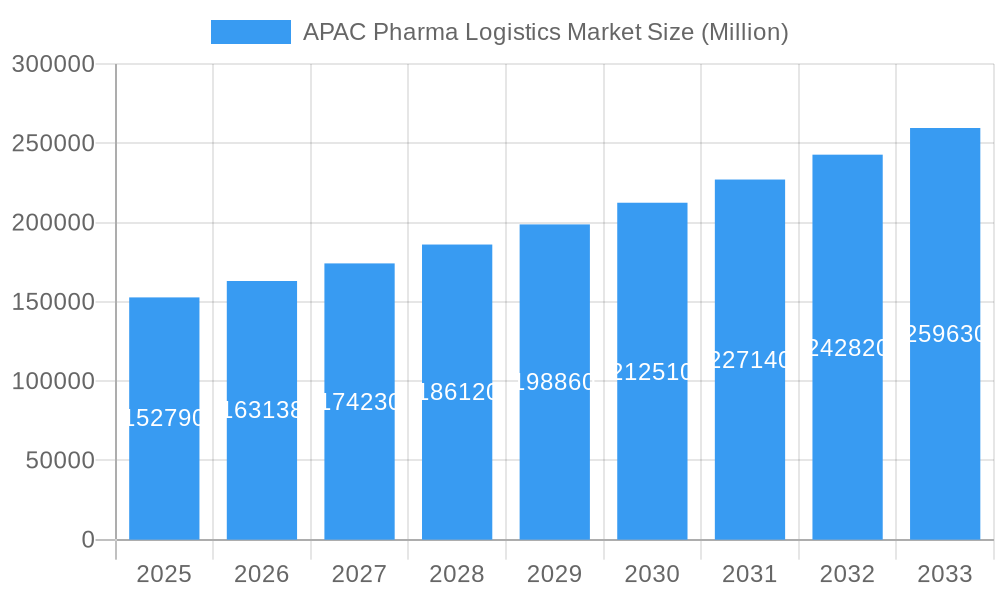
The Asia-Pacific (APAC) pharma logistics market, valued at $152.79 billion in 2025, is projected to experience robust growth, driven by a compound annual growth rate (CAGR) of 6.68% from 2025 to 2033. This expansion is fueled by several key factors. Firstly, the rising prevalence of chronic diseases and an aging population across the region are increasing demand for pharmaceutical products, necessitating efficient and reliable logistics solutions. Secondly, the burgeoning pharmaceutical manufacturing sector in countries like India and China is contributing to higher transportation volumes. Thirdly, the growing adoption of advanced technologies, such as cold chain monitoring and temperature-controlled containers, enhances the safety and efficacy of temperature-sensitive pharmaceuticals, further driving market growth. Stringent regulatory frameworks ensuring drug safety and efficacy also contribute to the market's expansion. However, challenges remain, including infrastructure limitations in some regions, particularly in rural areas, and the complexities of navigating diverse regulatory landscapes across the APAC countries.
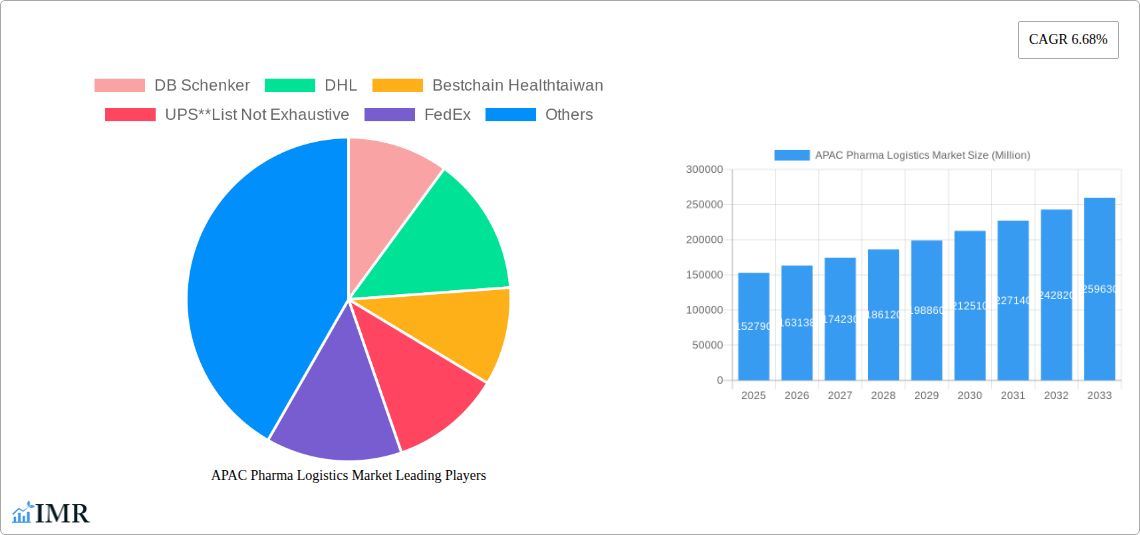
APAC Pharma Logistics Market Market Size (In Billion)
The market segmentation reveals significant opportunities. Branded drugs currently hold a larger market share than generic drugs, reflecting consumer preference and higher pricing. Cold chain transport dominates the mode of operation segment, highlighting the critical need for maintaining pharmaceutical integrity. Biopharma applications are a major driver, given the increasing demand for biologics and specialized therapies. Air transport is likely the preferred mode for time-sensitive deliveries, while road and rail offer cost-effective options for larger, less time-sensitive shipments. Key players like DHL, UPS, FedEx, and DB Schenker are strategically positioned to capitalize on this growth, leveraging their global networks and expertise in temperature-sensitive logistics. However, the emergence of specialized pharma logistics providers focused on niche areas presents both opportunities and competitive challenges. Future market growth hinges on overcoming infrastructural limitations, technological advancements, and regulatory harmonization across the region.
APAC Pharma Logistics Market Company Market Share
APAC Pharma Logistics Market: A Comprehensive Report (2019-2033)
This in-depth report provides a comprehensive analysis of the Asia-Pacific (APAC) pharma logistics market, encompassing market dynamics, growth trends, regional dominance, product landscape, key players, and future outlook. The study period covers 2019-2033, with 2025 as the base and estimated year. This report is invaluable for industry professionals, investors, and strategists seeking to understand and capitalize on opportunities within this rapidly evolving sector. The market is segmented by product (generic and branded drugs), mode of operation (cold chain and non-cold chain transport), application (biopharma, chemical pharma, specialized pharma), and mode of transport (air, rail, road, sea).
APAC Pharma Logistics Market Dynamics & Structure
The APAC pharma logistics market is characterized by a moderately consolidated structure with a few major players holding significant market share, alongside numerous smaller, regional operators. Market concentration is influenced by factors like technological capabilities, regulatory compliance, and strategic partnerships. Technological innovation, particularly in cold chain logistics and track-and-trace solutions, is a key driver, while stringent regulatory frameworks and evolving consumer expectations shape market dynamics. The market also faces competitive pressure from substitute products and services, demanding continuous adaptation. Mergers and acquisitions (M&A) activity remains significant, with larger players acquiring smaller companies to expand their market presence and service capabilities.
- Market Concentration: xx% market share held by top 5 players (2024).
- M&A Activity: xx deals in the last 5 years (2019-2024), averaging xx million USD per deal.
- Technological Innovation: Focus on automation, AI, and IoT solutions for enhanced efficiency and traceability.
- Regulatory Landscape: Stringent regulations regarding temperature control, data security, and product integrity across different APAC nations.
- Innovation Barriers: High upfront investment costs, lack of skilled labor, and complex regulatory approvals.
APAC Pharma Logistics Market Growth Trends & Insights
The APAC pharma logistics market exhibits robust growth, driven by factors such as increasing healthcare expenditure, rising demand for pharmaceutical products, and growing adoption of advanced logistics technologies. The market size is projected to reach xx million units by 2025, demonstrating a CAGR of xx% during the historical period (2019-2024) and an anticipated xx% CAGR during the forecast period (2025-2033). This growth is fueled by technological disruptions such as the implementation of blockchain technology for enhanced supply chain transparency and the increasing adoption of automated warehousing systems. Consumer behavior shifts towards greater demand for personalized medicine and specialized pharmaceuticals also influence market growth. Market penetration rates for cold chain logistics are expected to increase significantly, reflecting the growing demand for temperature-sensitive pharmaceutical products.
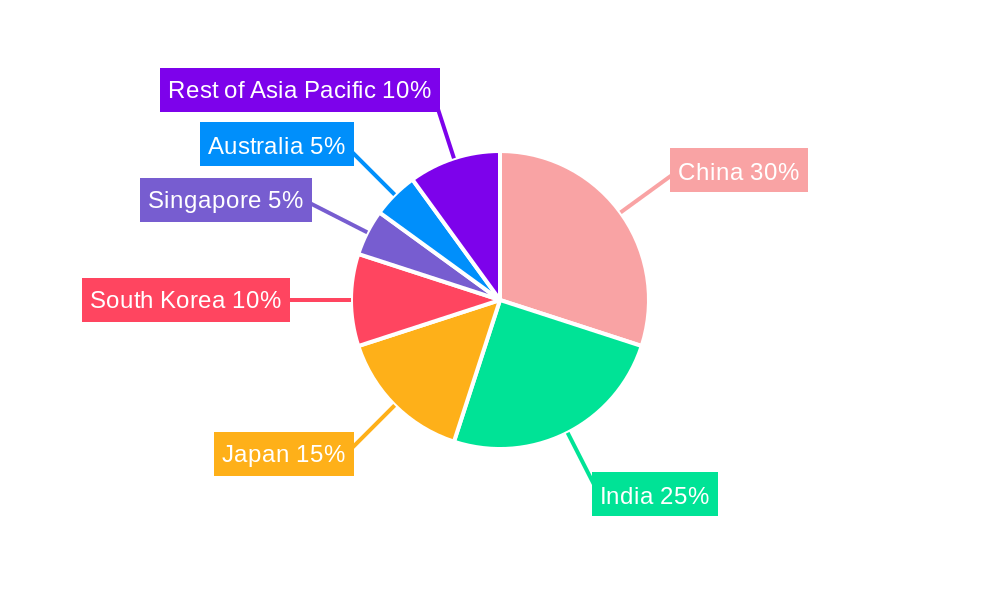
Dominant Regions, Countries, or Segments in APAC Pharma Logistics Market
China and India are currently the dominant markets in the APAC pharma logistics sector, contributing a significant share of the overall market volume due to their large populations, expanding healthcare infrastructure, and burgeoning pharmaceutical industries. Within the segment breakdown, the cold chain transport segment is experiencing the fastest growth due to the increasing demand for temperature-sensitive biologics and vaccines. The Branded Drugs segment commands a larger market share compared to the Generic Drugs segment due to higher pricing and increased focus on specialized logistics requirements.
- Key Drivers in China & India: Rapid economic growth, expanding healthcare infrastructure, government initiatives promoting pharmaceutical manufacturing, and favorable regulatory environments.
- Cold Chain Transport Growth: Driven by the increased demand for temperature-sensitive pharmaceuticals (biologics and vaccines) and stringent regulatory requirements for their safe transportation.
- Branded Drugs Dominance: Higher profitability and specialized logistics needs contribute to the larger market share compared to Generic Drugs.
- Air Freight: The preferred mode of transport for time-sensitive and high-value pharmaceutical shipments.
APAC Pharma Logistics Market Product Landscape
The APAC pharma logistics market is witnessing innovation in temperature-controlled containers, sophisticated tracking and monitoring systems, and integrated logistics platforms. These advancements improve supply chain visibility, enhance product safety, and ensure regulatory compliance. Real-time tracking and monitoring, along with predictive analytics, are key selling points, enabling proactive management of potential risks and delays. The focus on end-to-end solutions that integrate multiple logistical aspects is gaining traction, improving efficiency and reducing costs.
Key Drivers, Barriers & Challenges in APAP Pharma Logistics Market
Key Drivers: Increasing healthcare spending, growing demand for pharmaceuticals, technological advancements in cold chain logistics and tracking systems, and government initiatives promoting pharmaceutical manufacturing and logistics infrastructure development.
Key Barriers & Challenges: Stringent regulatory requirements, infrastructure limitations in certain regions, rising fuel costs, potential for supply chain disruptions (e.g., pandemics), skilled labor shortages, and intense competition amongst logistics providers. These challenges can impact delivery timelines and increase operational costs. Specifically, supply chain disruptions can lead to xx% delays in pharmaceutical deliveries.
Emerging Opportunities in APAC Pharma Logistics Market
Untapped markets in smaller APAC countries present significant opportunities. The increasing adoption of digital technologies, such as AI and blockchain, offers potential for increased efficiency, cost optimization, and enhanced security. Demand for specialized services, such as handling of personalized medicines and advanced therapies, will generate new market avenues. Furthermore, the growing focus on sustainable and environmentally friendly logistics solutions will open new opportunities for innovative providers.
Growth Accelerators in the APAC Pharma Logistics Market Industry
Technological advancements in automation, AI-driven route optimization, and advanced cold chain solutions are key growth accelerators. Strategic partnerships between pharmaceutical companies and logistics providers, leading to integrated and streamlined supply chains, will fuel growth. Expanding into new markets, particularly across Southeast Asia and smaller economies, will significantly enhance market reach.
Key Players Shaping the APAC Pharma Logistics Market Market
- DB Schenker
- DHL
- Bestchain Healthtaiwan
- UPS
- FedEx
- CEVA Logistics
- Genco
- Kuehne + Nagel
- Mainfreight Ltd
- Bio Pharma Logistics
- Kerry Logistics
- Thermotraffic
- DSV Panalpina
- Arich Enterprise Co Ltd
Notable Milestones in APAC Pharma Logistics Market Sector
- December 2022: DHL Supply Chain announced a EUR 10 million (USD 10,515,247.11) investment to expand its Northern Taiwan operations, focusing on the LSHC and semiconductor industries. This signifies a commitment to expanding capacity in a key market.
- August 2022: Nippon Express launched a new Healthcare Branch in Shanghai, strengthening its presence in the Chinese pharmaceutical market. This indicates a strategic focus on the growing healthcare sector in China.
In-Depth APAC Pharma Logistics Market Outlook
The APAC pharma logistics market is poised for substantial growth over the next decade, driven by robust economic expansion, rising healthcare expenditures, and technological advancements. Strategic partnerships, investments in infrastructure, and expansion into emerging markets will continue to shape the competitive landscape. Companies focusing on innovation in cold chain technologies, digital solutions, and sustainable practices are well-positioned to capture significant market share and drive long-term growth within this dynamic sector.
APAC Pharma Logistics Market Segmentation
-
1. Product
- 1.1. Generic Drugs
- 1.2. Branded Drugs
-
2. Mode of Operation
- 2.1. Cold Chain Transport
- 2.2. Non-Cold Chain Transport
-
3. Application
- 3.1. Bio Pharma
- 3.2. Chemical Pharma
- 3.3. Specialized Pharma
-
4. Mode of Transport
- 4.1. Air
- 4.2. Rail
- 4.3. Road
- 4.4. Sea
-
5. Geography
- 5.1. China
- 5.2. India
- 5.3. Japan
- 5.4. South Korea
- 5.5. Singapore
- 5.6. Australia
- 5.7. Rest of Asia Pacific
APAC Pharma Logistics Market Segmentation By Geography
- 1. China
- 2. India
- 3. Japan
- 4. South Korea
- 5. Singapore
- 6. Australia
- 7. Rest of Asia Pacific
APAC Pharma Logistics Market Regional Market Share
Geographic Coverage of APAC Pharma Logistics Market
APAC Pharma Logistics Market REPORT HIGHLIGHTS
| Aspects | Details |
|---|---|
| Study Period | 2020-2034 |
| Base Year | 2025 |
| Estimated Year | 2026 |
| Forecast Period | 2026-2034 |
| Historical Period | 2020-2025 |
| Growth Rate | CAGR of 6.68% from 2020-2034 |
| Segmentation |
|
Table of Contents
- 1. Introduction
- 1.1. Research Scope
- 1.2. Market Segmentation
- 1.3. Research Objective
- 1.4. Definitions and Assumptions
- 2. Executive Summary
- 2.1. Market Snapshot
- 3. Market Dynamics
- 3.1. Market Drivers
- 3.2. Market Restrains
- 3.3. Market Trends
- 3.4. Market Opportunities
- 4. Market Factor Analysis
- 4.1. Porters Five Forces
- 4.1.1. Bargaining Power of Suppliers
- 4.1.2. Bargaining Power of Buyers
- 4.1.3. Threat of New Entrants
- 4.1.4. Threat of Substitutes
- 4.1.5. Competitive Rivalry
- 4.2. PESTEL analysis
- 4.3. BCG Analysis
- 4.3.1. Stars (High Growth, High Market Share)
- 4.3.2. Cash Cows (Low Growth, High Market Share)
- 4.3.3. Question Mark (High Growth, Low Market Share)
- 4.3.4. Dogs (Low Growth, Low Market Share)
- 4.4. Ansoff Matrix Analysis
- 4.5. Supply Chain Analysis
- 4.6. Regulatory Landscape
- 4.7. Current Market Potential and Opportunity Assessment (TAM–SAM–SOM Framework)
- 4.8. IMR Analyst Note
- 4.1. Porters Five Forces
- 5. Market Analysis, Insights and Forecast 2021-2033
- 5.1. Market Analysis, Insights and Forecast - by Product
- 5.1.1. Generic Drugs
- 5.1.2. Branded Drugs
- 5.2. Market Analysis, Insights and Forecast - by Mode of Operation
- 5.2.1. Cold Chain Transport
- 5.2.2. Non-Cold Chain Transport
- 5.3. Market Analysis, Insights and Forecast - by Application
- 5.3.1. Bio Pharma
- 5.3.2. Chemical Pharma
- 5.3.3. Specialized Pharma
- 5.4. Market Analysis, Insights and Forecast - by Mode of Transport
- 5.4.1. Air
- 5.4.2. Rail
- 5.4.3. Road
- 5.4.4. Sea
- 5.5. Market Analysis, Insights and Forecast - by Geography
- 5.5.1. China
- 5.5.2. India
- 5.5.3. Japan
- 5.5.4. South Korea
- 5.5.5. Singapore
- 5.5.6. Australia
- 5.5.7. Rest of Asia Pacific
- 5.6. Market Analysis, Insights and Forecast - by Region
- 5.6.1. China
- 5.6.2. India
- 5.6.3. Japan
- 5.6.4. South Korea
- 5.6.5. Singapore
- 5.6.6. Australia
- 5.6.7. Rest of Asia Pacific
- 5.1. Market Analysis, Insights and Forecast - by Product
- 6. Global APAC Pharma Logistics Market Analysis, Insights and Forecast, 2021-2033
- 6.1. Market Analysis, Insights and Forecast - by Product
- 6.1.1. Generic Drugs
- 6.1.2. Branded Drugs
- 6.2. Market Analysis, Insights and Forecast - by Mode of Operation
- 6.2.1. Cold Chain Transport
- 6.2.2. Non-Cold Chain Transport
- 6.3. Market Analysis, Insights and Forecast - by Application
- 6.3.1. Bio Pharma
- 6.3.2. Chemical Pharma
- 6.3.3. Specialized Pharma
- 6.4. Market Analysis, Insights and Forecast - by Mode of Transport
- 6.4.1. Air
- 6.4.2. Rail
- 6.4.3. Road
- 6.4.4. Sea
- 6.5. Market Analysis, Insights and Forecast - by Geography
- 6.5.1. China
- 6.5.2. India
- 6.5.3. Japan
- 6.5.4. South Korea
- 6.5.5. Singapore
- 6.5.6. Australia
- 6.5.7. Rest of Asia Pacific
- 6.1. Market Analysis, Insights and Forecast - by Product
- 7. China APAC Pharma Logistics Market Analysis, Insights and Forecast, 2020-2032
- 7.1. Market Analysis, Insights and Forecast - by Product
- 7.1.1. Generic Drugs
- 7.1.2. Branded Drugs
- 7.2. Market Analysis, Insights and Forecast - by Mode of Operation
- 7.2.1. Cold Chain Transport
- 7.2.2. Non-Cold Chain Transport
- 7.3. Market Analysis, Insights and Forecast - by Application
- 7.3.1. Bio Pharma
- 7.3.2. Chemical Pharma
- 7.3.3. Specialized Pharma
- 7.4. Market Analysis, Insights and Forecast - by Mode of Transport
- 7.4.1. Air
- 7.4.2. Rail
- 7.4.3. Road
- 7.4.4. Sea
- 7.5. Market Analysis, Insights and Forecast - by Geography
- 7.5.1. China
- 7.5.2. India
- 7.5.3. Japan
- 7.5.4. South Korea
- 7.5.5. Singapore
- 7.5.6. Australia
- 7.5.7. Rest of Asia Pacific
- 7.1. Market Analysis, Insights and Forecast - by Product
- 8. India APAC Pharma Logistics Market Analysis, Insights and Forecast, 2020-2032
- 8.1. Market Analysis, Insights and Forecast - by Product
- 8.1.1. Generic Drugs
- 8.1.2. Branded Drugs
- 8.2. Market Analysis, Insights and Forecast - by Mode of Operation
- 8.2.1. Cold Chain Transport
- 8.2.2. Non-Cold Chain Transport
- 8.3. Market Analysis, Insights and Forecast - by Application
- 8.3.1. Bio Pharma
- 8.3.2. Chemical Pharma
- 8.3.3. Specialized Pharma
- 8.4. Market Analysis, Insights and Forecast - by Mode of Transport
- 8.4.1. Air
- 8.4.2. Rail
- 8.4.3. Road
- 8.4.4. Sea
- 8.5. Market Analysis, Insights and Forecast - by Geography
- 8.5.1. China
- 8.5.2. India
- 8.5.3. Japan
- 8.5.4. South Korea
- 8.5.5. Singapore
- 8.5.6. Australia
- 8.5.7. Rest of Asia Pacific
- 8.1. Market Analysis, Insights and Forecast - by Product
- 9. Japan APAC Pharma Logistics Market Analysis, Insights and Forecast, 2020-2032
- 9.1. Market Analysis, Insights and Forecast - by Product
- 9.1.1. Generic Drugs
- 9.1.2. Branded Drugs
- 9.2. Market Analysis, Insights and Forecast - by Mode of Operation
- 9.2.1. Cold Chain Transport
- 9.2.2. Non-Cold Chain Transport
- 9.3. Market Analysis, Insights and Forecast - by Application
- 9.3.1. Bio Pharma
- 9.3.2. Chemical Pharma
- 9.3.3. Specialized Pharma
- 9.4. Market Analysis, Insights and Forecast - by Mode of Transport
- 9.4.1. Air
- 9.4.2. Rail
- 9.4.3. Road
- 9.4.4. Sea
- 9.5. Market Analysis, Insights and Forecast - by Geography
- 9.5.1. China
- 9.5.2. India
- 9.5.3. Japan
- 9.5.4. South Korea
- 9.5.5. Singapore
- 9.5.6. Australia
- 9.5.7. Rest of Asia Pacific
- 9.1. Market Analysis, Insights and Forecast - by Product
- 10. South Korea APAC Pharma Logistics Market Analysis, Insights and Forecast, 2020-2032
- 10.1. Market Analysis, Insights and Forecast - by Product
- 10.1.1. Generic Drugs
- 10.1.2. Branded Drugs
- 10.2. Market Analysis, Insights and Forecast - by Mode of Operation
- 10.2.1. Cold Chain Transport
- 10.2.2. Non-Cold Chain Transport
- 10.3. Market Analysis, Insights and Forecast - by Application
- 10.3.1. Bio Pharma
- 10.3.2. Chemical Pharma
- 10.3.3. Specialized Pharma
- 10.4. Market Analysis, Insights and Forecast - by Mode of Transport
- 10.4.1. Air
- 10.4.2. Rail
- 10.4.3. Road
- 10.4.4. Sea
- 10.5. Market Analysis, Insights and Forecast - by Geography
- 10.5.1. China
- 10.5.2. India
- 10.5.3. Japan
- 10.5.4. South Korea
- 10.5.5. Singapore
- 10.5.6. Australia
- 10.5.7. Rest of Asia Pacific
- 10.1. Market Analysis, Insights and Forecast - by Product
- 11. Singapore APAC Pharma Logistics Market Analysis, Insights and Forecast, 2020-2032
- 11.1. Market Analysis, Insights and Forecast - by Product
- 11.1.1. Generic Drugs
- 11.1.2. Branded Drugs
- 11.2. Market Analysis, Insights and Forecast - by Mode of Operation
- 11.2.1. Cold Chain Transport
- 11.2.2. Non-Cold Chain Transport
- 11.3. Market Analysis, Insights and Forecast - by Application
- 11.3.1. Bio Pharma
- 11.3.2. Chemical Pharma
- 11.3.3. Specialized Pharma
- 11.4. Market Analysis, Insights and Forecast - by Mode of Transport
- 11.4.1. Air
- 11.4.2. Rail
- 11.4.3. Road
- 11.4.4. Sea
- 11.5. Market Analysis, Insights and Forecast - by Geography
- 11.5.1. China
- 11.5.2. India
- 11.5.3. Japan
- 11.5.4. South Korea
- 11.5.5. Singapore
- 11.5.6. Australia
- 11.5.7. Rest of Asia Pacific
- 11.1. Market Analysis, Insights and Forecast - by Product
- 12. Australia APAC Pharma Logistics Market Analysis, Insights and Forecast, 2020-2032
- 12.1. Market Analysis, Insights and Forecast - by Product
- 12.1.1. Generic Drugs
- 12.1.2. Branded Drugs
- 12.2. Market Analysis, Insights and Forecast - by Mode of Operation
- 12.2.1. Cold Chain Transport
- 12.2.2. Non-Cold Chain Transport
- 12.3. Market Analysis, Insights and Forecast - by Application
- 12.3.1. Bio Pharma
- 12.3.2. Chemical Pharma
- 12.3.3. Specialized Pharma
- 12.4. Market Analysis, Insights and Forecast - by Mode of Transport
- 12.4.1. Air
- 12.4.2. Rail
- 12.4.3. Road
- 12.4.4. Sea
- 12.5. Market Analysis, Insights and Forecast - by Geography
- 12.5.1. China
- 12.5.2. India
- 12.5.3. Japan
- 12.5.4. South Korea
- 12.5.5. Singapore
- 12.5.6. Australia
- 12.5.7. Rest of Asia Pacific
- 12.1. Market Analysis, Insights and Forecast - by Product
- 13. Rest of Asia Pacific APAC Pharma Logistics Market Analysis, Insights and Forecast, 2020-2032
- 13.1. Market Analysis, Insights and Forecast - by Product
- 13.1.1. Generic Drugs
- 13.1.2. Branded Drugs
- 13.2. Market Analysis, Insights and Forecast - by Mode of Operation
- 13.2.1. Cold Chain Transport
- 13.2.2. Non-Cold Chain Transport
- 13.3. Market Analysis, Insights and Forecast - by Application
- 13.3.1. Bio Pharma
- 13.3.2. Chemical Pharma
- 13.3.3. Specialized Pharma
- 13.4. Market Analysis, Insights and Forecast - by Mode of Transport
- 13.4.1. Air
- 13.4.2. Rail
- 13.4.3. Road
- 13.4.4. Sea
- 13.5. Market Analysis, Insights and Forecast - by Geography
- 13.5.1. China
- 13.5.2. India
- 13.5.3. Japan
- 13.5.4. South Korea
- 13.5.5. Singapore
- 13.5.6. Australia
- 13.5.7. Rest of Asia Pacific
- 13.1. Market Analysis, Insights and Forecast - by Product
- 14. Competitive Analysis
- 14.1. Company Profiles
- 14.1.1 DB Schenker
- 14.1.1.1. Company Overview
- 14.1.1.2. Products
- 14.1.1.3. Company Financials
- 14.1.1.4. SWOT Analysis
- 14.1.2 DHL
- 14.1.2.1. Company Overview
- 14.1.2.2. Products
- 14.1.2.3. Company Financials
- 14.1.2.4. SWOT Analysis
- 14.1.3 Bestchain Healthtaiwan
- 14.1.3.1. Company Overview
- 14.1.3.2. Products
- 14.1.3.3. Company Financials
- 14.1.3.4. SWOT Analysis
- 14.1.4 UPS**List Not Exhaustive
- 14.1.4.1. Company Overview
- 14.1.4.2. Products
- 14.1.4.3. Company Financials
- 14.1.4.4. SWOT Analysis
- 14.1.5 FedEx
- 14.1.5.1. Company Overview
- 14.1.5.2. Products
- 14.1.5.3. Company Financials
- 14.1.5.4. SWOT Analysis
- 14.1.6 CEVA Logistics
- 14.1.6.1. Company Overview
- 14.1.6.2. Products
- 14.1.6.3. Company Financials
- 14.1.6.4. SWOT Analysis
- 14.1.7 Genco
- 14.1.7.1. Company Overview
- 14.1.7.2. Products
- 14.1.7.3. Company Financials
- 14.1.7.4. SWOT Analysis
- 14.1.8 Kuehne + Nagel
- 14.1.8.1. Company Overview
- 14.1.8.2. Products
- 14.1.8.3. Company Financials
- 14.1.8.4. SWOT Analysis
- 14.1.9 Mainfreight Ltd
- 14.1.9.1. Company Overview
- 14.1.9.2. Products
- 14.1.9.3. Company Financials
- 14.1.9.4. SWOT Analysis
- 14.1.10 Bio Pharma Logistics
- 14.1.10.1. Company Overview
- 14.1.10.2. Products
- 14.1.10.3. Company Financials
- 14.1.10.4. SWOT Analysis
- 14.1.11 Kerry Logistics
- 14.1.11.1. Company Overview
- 14.1.11.2. Products
- 14.1.11.3. Company Financials
- 14.1.11.4. SWOT Analysis
- 14.1.12 Thermotraffic
- 14.1.12.1. Company Overview
- 14.1.12.2. Products
- 14.1.12.3. Company Financials
- 14.1.12.4. SWOT Analysis
- 14.1.13 DSV Panalpina
- 14.1.13.1. Company Overview
- 14.1.13.2. Products
- 14.1.13.3. Company Financials
- 14.1.13.4. SWOT Analysis
- 14.1.14 Arich Enterprise Co Ltd
- 14.1.14.1. Company Overview
- 14.1.14.2. Products
- 14.1.14.3. Company Financials
- 14.1.14.4. SWOT Analysis
- 14.1.1 DB Schenker
- 14.2. Market Entropy
- 14.2.1 Company's Key Areas Served
- 14.2.2 Recent Developments
- 14.3. Company Market Share Analysis 2025
- 14.3.1 Top 5 Companies Market Share Analysis
- 14.3.2 Top 3 Companies Market Share Analysis
- 14.4. List of Potential Customers
- 15. Research Methodology
List of Figures
- Figure 1: Global APAC Pharma Logistics Market Revenue Breakdown (Million, %) by Region 2025 & 2033
- Figure 2: China APAC Pharma Logistics Market Revenue (Million), by Product 2025 & 2033
- Figure 3: China APAC Pharma Logistics Market Revenue Share (%), by Product 2025 & 2033
- Figure 4: China APAC Pharma Logistics Market Revenue (Million), by Mode of Operation 2025 & 2033
- Figure 5: China APAC Pharma Logistics Market Revenue Share (%), by Mode of Operation 2025 & 2033
- Figure 6: China APAC Pharma Logistics Market Revenue (Million), by Application 2025 & 2033
- Figure 7: China APAC Pharma Logistics Market Revenue Share (%), by Application 2025 & 2033
- Figure 8: China APAC Pharma Logistics Market Revenue (Million), by Mode of Transport 2025 & 2033
- Figure 9: China APAC Pharma Logistics Market Revenue Share (%), by Mode of Transport 2025 & 2033
- Figure 10: China APAC Pharma Logistics Market Revenue (Million), by Geography 2025 & 2033
- Figure 11: China APAC Pharma Logistics Market Revenue Share (%), by Geography 2025 & 2033
- Figure 12: China APAC Pharma Logistics Market Revenue (Million), by Country 2025 & 2033
- Figure 13: China APAC Pharma Logistics Market Revenue Share (%), by Country 2025 & 2033
- Figure 14: India APAC Pharma Logistics Market Revenue (Million), by Product 2025 & 2033
- Figure 15: India APAC Pharma Logistics Market Revenue Share (%), by Product 2025 & 2033
- Figure 16: India APAC Pharma Logistics Market Revenue (Million), by Mode of Operation 2025 & 2033
- Figure 17: India APAC Pharma Logistics Market Revenue Share (%), by Mode of Operation 2025 & 2033
- Figure 18: India APAC Pharma Logistics Market Revenue (Million), by Application 2025 & 2033
- Figure 19: India APAC Pharma Logistics Market Revenue Share (%), by Application 2025 & 2033
- Figure 20: India APAC Pharma Logistics Market Revenue (Million), by Mode of Transport 2025 & 2033
- Figure 21: India APAC Pharma Logistics Market Revenue Share (%), by Mode of Transport 2025 & 2033
- Figure 22: India APAC Pharma Logistics Market Revenue (Million), by Geography 2025 & 2033
- Figure 23: India APAC Pharma Logistics Market Revenue Share (%), by Geography 2025 & 2033
- Figure 24: India APAC Pharma Logistics Market Revenue (Million), by Country 2025 & 2033
- Figure 25: India APAC Pharma Logistics Market Revenue Share (%), by Country 2025 & 2033
- Figure 26: Japan APAC Pharma Logistics Market Revenue (Million), by Product 2025 & 2033
- Figure 27: Japan APAC Pharma Logistics Market Revenue Share (%), by Product 2025 & 2033
- Figure 28: Japan APAC Pharma Logistics Market Revenue (Million), by Mode of Operation 2025 & 2033
- Figure 29: Japan APAC Pharma Logistics Market Revenue Share (%), by Mode of Operation 2025 & 2033
- Figure 30: Japan APAC Pharma Logistics Market Revenue (Million), by Application 2025 & 2033
- Figure 31: Japan APAC Pharma Logistics Market Revenue Share (%), by Application 2025 & 2033
- Figure 32: Japan APAC Pharma Logistics Market Revenue (Million), by Mode of Transport 2025 & 2033
- Figure 33: Japan APAC Pharma Logistics Market Revenue Share (%), by Mode of Transport 2025 & 2033
- Figure 34: Japan APAC Pharma Logistics Market Revenue (Million), by Geography 2025 & 2033
- Figure 35: Japan APAC Pharma Logistics Market Revenue Share (%), by Geography 2025 & 2033
- Figure 36: Japan APAC Pharma Logistics Market Revenue (Million), by Country 2025 & 2033
- Figure 37: Japan APAC Pharma Logistics Market Revenue Share (%), by Country 2025 & 2033
- Figure 38: South Korea APAC Pharma Logistics Market Revenue (Million), by Product 2025 & 2033
- Figure 39: South Korea APAC Pharma Logistics Market Revenue Share (%), by Product 2025 & 2033
- Figure 40: South Korea APAC Pharma Logistics Market Revenue (Million), by Mode of Operation 2025 & 2033
- Figure 41: South Korea APAC Pharma Logistics Market Revenue Share (%), by Mode of Operation 2025 & 2033
- Figure 42: South Korea APAC Pharma Logistics Market Revenue (Million), by Application 2025 & 2033
- Figure 43: South Korea APAC Pharma Logistics Market Revenue Share (%), by Application 2025 & 2033
- Figure 44: South Korea APAC Pharma Logistics Market Revenue (Million), by Mode of Transport 2025 & 2033
- Figure 45: South Korea APAC Pharma Logistics Market Revenue Share (%), by Mode of Transport 2025 & 2033
- Figure 46: South Korea APAC Pharma Logistics Market Revenue (Million), by Geography 2025 & 2033
- Figure 47: South Korea APAC Pharma Logistics Market Revenue Share (%), by Geography 2025 & 2033
- Figure 48: South Korea APAC Pharma Logistics Market Revenue (Million), by Country 2025 & 2033
- Figure 49: South Korea APAC Pharma Logistics Market Revenue Share (%), by Country 2025 & 2033
- Figure 50: Singapore APAC Pharma Logistics Market Revenue (Million), by Product 2025 & 2033
- Figure 51: Singapore APAC Pharma Logistics Market Revenue Share (%), by Product 2025 & 2033
- Figure 52: Singapore APAC Pharma Logistics Market Revenue (Million), by Mode of Operation 2025 & 2033
- Figure 53: Singapore APAC Pharma Logistics Market Revenue Share (%), by Mode of Operation 2025 & 2033
- Figure 54: Singapore APAC Pharma Logistics Market Revenue (Million), by Application 2025 & 2033
- Figure 55: Singapore APAC Pharma Logistics Market Revenue Share (%), by Application 2025 & 2033
- Figure 56: Singapore APAC Pharma Logistics Market Revenue (Million), by Mode of Transport 2025 & 2033
- Figure 57: Singapore APAC Pharma Logistics Market Revenue Share (%), by Mode of Transport 2025 & 2033
- Figure 58: Singapore APAC Pharma Logistics Market Revenue (Million), by Geography 2025 & 2033
- Figure 59: Singapore APAC Pharma Logistics Market Revenue Share (%), by Geography 2025 & 2033
- Figure 60: Singapore APAC Pharma Logistics Market Revenue (Million), by Country 2025 & 2033
- Figure 61: Singapore APAC Pharma Logistics Market Revenue Share (%), by Country 2025 & 2033
- Figure 62: Australia APAC Pharma Logistics Market Revenue (Million), by Product 2025 & 2033
- Figure 63: Australia APAC Pharma Logistics Market Revenue Share (%), by Product 2025 & 2033
- Figure 64: Australia APAC Pharma Logistics Market Revenue (Million), by Mode of Operation 2025 & 2033
- Figure 65: Australia APAC Pharma Logistics Market Revenue Share (%), by Mode of Operation 2025 & 2033
- Figure 66: Australia APAC Pharma Logistics Market Revenue (Million), by Application 2025 & 2033
- Figure 67: Australia APAC Pharma Logistics Market Revenue Share (%), by Application 2025 & 2033
- Figure 68: Australia APAC Pharma Logistics Market Revenue (Million), by Mode of Transport 2025 & 2033
- Figure 69: Australia APAC Pharma Logistics Market Revenue Share (%), by Mode of Transport 2025 & 2033
- Figure 70: Australia APAC Pharma Logistics Market Revenue (Million), by Geography 2025 & 2033
- Figure 71: Australia APAC Pharma Logistics Market Revenue Share (%), by Geography 2025 & 2033
- Figure 72: Australia APAC Pharma Logistics Market Revenue (Million), by Country 2025 & 2033
- Figure 73: Australia APAC Pharma Logistics Market Revenue Share (%), by Country 2025 & 2033
- Figure 74: Rest of Asia Pacific APAC Pharma Logistics Market Revenue (Million), by Product 2025 & 2033
- Figure 75: Rest of Asia Pacific APAC Pharma Logistics Market Revenue Share (%), by Product 2025 & 2033
- Figure 76: Rest of Asia Pacific APAC Pharma Logistics Market Revenue (Million), by Mode of Operation 2025 & 2033
- Figure 77: Rest of Asia Pacific APAC Pharma Logistics Market Revenue Share (%), by Mode of Operation 2025 & 2033
- Figure 78: Rest of Asia Pacific APAC Pharma Logistics Market Revenue (Million), by Application 2025 & 2033
- Figure 79: Rest of Asia Pacific APAC Pharma Logistics Market Revenue Share (%), by Application 2025 & 2033
- Figure 80: Rest of Asia Pacific APAC Pharma Logistics Market Revenue (Million), by Mode of Transport 2025 & 2033
- Figure 81: Rest of Asia Pacific APAC Pharma Logistics Market Revenue Share (%), by Mode of Transport 2025 & 2033
- Figure 82: Rest of Asia Pacific APAC Pharma Logistics Market Revenue (Million), by Geography 2025 & 2033
- Figure 83: Rest of Asia Pacific APAC Pharma Logistics Market Revenue Share (%), by Geography 2025 & 2033
- Figure 84: Rest of Asia Pacific APAC Pharma Logistics Market Revenue (Million), by Country 2025 & 2033
- Figure 85: Rest of Asia Pacific APAC Pharma Logistics Market Revenue Share (%), by Country 2025 & 2033
List of Tables
- Table 1: Global APAC Pharma Logistics Market Revenue Million Forecast, by Product 2020 & 2033
- Table 2: Global APAC Pharma Logistics Market Revenue Million Forecast, by Mode of Operation 2020 & 2033
- Table 3: Global APAC Pharma Logistics Market Revenue Million Forecast, by Application 2020 & 2033
- Table 4: Global APAC Pharma Logistics Market Revenue Million Forecast, by Mode of Transport 2020 & 2033
- Table 5: Global APAC Pharma Logistics Market Revenue Million Forecast, by Geography 2020 & 2033
- Table 6: Global APAC Pharma Logistics Market Revenue Million Forecast, by Region 2020 & 2033
- Table 7: Global APAC Pharma Logistics Market Revenue Million Forecast, by Product 2020 & 2033
- Table 8: Global APAC Pharma Logistics Market Revenue Million Forecast, by Mode of Operation 2020 & 2033
- Table 9: Global APAC Pharma Logistics Market Revenue Million Forecast, by Application 2020 & 2033
- Table 10: Global APAC Pharma Logistics Market Revenue Million Forecast, by Mode of Transport 2020 & 2033
- Table 11: Global APAC Pharma Logistics Market Revenue Million Forecast, by Geography 2020 & 2033
- Table 12: Global APAC Pharma Logistics Market Revenue Million Forecast, by Country 2020 & 2033
- Table 13: Global APAC Pharma Logistics Market Revenue Million Forecast, by Product 2020 & 2033
- Table 14: Global APAC Pharma Logistics Market Revenue Million Forecast, by Mode of Operation 2020 & 2033
- Table 15: Global APAC Pharma Logistics Market Revenue Million Forecast, by Application 2020 & 2033
- Table 16: Global APAC Pharma Logistics Market Revenue Million Forecast, by Mode of Transport 2020 & 2033
- Table 17: Global APAC Pharma Logistics Market Revenue Million Forecast, by Geography 2020 & 2033
- Table 18: Global APAC Pharma Logistics Market Revenue Million Forecast, by Country 2020 & 2033
- Table 19: Global APAC Pharma Logistics Market Revenue Million Forecast, by Product 2020 & 2033
- Table 20: Global APAC Pharma Logistics Market Revenue Million Forecast, by Mode of Operation 2020 & 2033
- Table 21: Global APAC Pharma Logistics Market Revenue Million Forecast, by Application 2020 & 2033
- Table 22: Global APAC Pharma Logistics Market Revenue Million Forecast, by Mode of Transport 2020 & 2033
- Table 23: Global APAC Pharma Logistics Market Revenue Million Forecast, by Geography 2020 & 2033
- Table 24: Global APAC Pharma Logistics Market Revenue Million Forecast, by Country 2020 & 2033
- Table 25: Global APAC Pharma Logistics Market Revenue Million Forecast, by Product 2020 & 2033
- Table 26: Global APAC Pharma Logistics Market Revenue Million Forecast, by Mode of Operation 2020 & 2033
- Table 27: Global APAC Pharma Logistics Market Revenue Million Forecast, by Application 2020 & 2033
- Table 28: Global APAC Pharma Logistics Market Revenue Million Forecast, by Mode of Transport 2020 & 2033
- Table 29: Global APAC Pharma Logistics Market Revenue Million Forecast, by Geography 2020 & 2033
- Table 30: Global APAC Pharma Logistics Market Revenue Million Forecast, by Country 2020 & 2033
- Table 31: Global APAC Pharma Logistics Market Revenue Million Forecast, by Product 2020 & 2033
- Table 32: Global APAC Pharma Logistics Market Revenue Million Forecast, by Mode of Operation 2020 & 2033
- Table 33: Global APAC Pharma Logistics Market Revenue Million Forecast, by Application 2020 & 2033
- Table 34: Global APAC Pharma Logistics Market Revenue Million Forecast, by Mode of Transport 2020 & 2033
- Table 35: Global APAC Pharma Logistics Market Revenue Million Forecast, by Geography 2020 & 2033
- Table 36: Global APAC Pharma Logistics Market Revenue Million Forecast, by Country 2020 & 2033
- Table 37: Global APAC Pharma Logistics Market Revenue Million Forecast, by Product 2020 & 2033
- Table 38: Global APAC Pharma Logistics Market Revenue Million Forecast, by Mode of Operation 2020 & 2033
- Table 39: Global APAC Pharma Logistics Market Revenue Million Forecast, by Application 2020 & 2033
- Table 40: Global APAC Pharma Logistics Market Revenue Million Forecast, by Mode of Transport 2020 & 2033
- Table 41: Global APAC Pharma Logistics Market Revenue Million Forecast, by Geography 2020 & 2033
- Table 42: Global APAC Pharma Logistics Market Revenue Million Forecast, by Country 2020 & 2033
- Table 43: Global APAC Pharma Logistics Market Revenue Million Forecast, by Product 2020 & 2033
- Table 44: Global APAC Pharma Logistics Market Revenue Million Forecast, by Mode of Operation 2020 & 2033
- Table 45: Global APAC Pharma Logistics Market Revenue Million Forecast, by Application 2020 & 2033
- Table 46: Global APAC Pharma Logistics Market Revenue Million Forecast, by Mode of Transport 2020 & 2033
- Table 47: Global APAC Pharma Logistics Market Revenue Million Forecast, by Geography 2020 & 2033
- Table 48: Global APAC Pharma Logistics Market Revenue Million Forecast, by Country 2020 & 2033
Frequently Asked Questions
1. What is the projected Compound Annual Growth Rate (CAGR) of the APAC Pharma Logistics Market?
The projected CAGR is approximately 6.68%.
2. Which companies are prominent players in the APAC Pharma Logistics Market?
Key companies in the market include DB Schenker, DHL, Bestchain Healthtaiwan, UPS**List Not Exhaustive, FedEx, CEVA Logistics, Genco, Kuehne + Nagel, Mainfreight Ltd, Bio Pharma Logistics, Kerry Logistics, Thermotraffic, DSV Panalpina, Arich Enterprise Co Ltd.
3. What are the main segments of the APAC Pharma Logistics Market?
The market segments include Product, Mode of Operation, Application, Mode of Transport, Geography.
4. Can you provide details about the market size?
The market size is estimated to be USD 152.79 Million as of 2022.
5. What are some drivers contributing to market growth?
Growing Events in E-commerce Sector; Increasing Demand for Qualified Event Logistics Services.
6. What are the notable trends driving market growth?
Cold chain Logistics is driving the market.
7. Are there any restraints impacting market growth?
High Labour Cost; High Pricing.
8. Can you provide examples of recent developments in the market?
December 2022: DHL Supply Chain has disclosed its Northern Taiwan plant growth plans for five years. The investment of EUR 10 million (USD 10515247.1083) would expand DHL Supply Chain's market reach and meet the logistics needs of the LSHC and semiconductor industries. The newly inaugurated Taoyuan Distribution Center-Jian Guo, DHL Supply Chain's second location in Taoyuan, is a part of the development.
9. What pricing options are available for accessing the report?
Pricing options include single-user, multi-user, and enterprise licenses priced at USD 4750, USD 5250, and USD 8750 respectively.
10. Is the market size provided in terms of value or volume?
The market size is provided in terms of value, measured in Million.
11. Are there any specific market keywords associated with the report?
Yes, the market keyword associated with the report is "APAC Pharma Logistics Market," which aids in identifying and referencing the specific market segment covered.
12. How do I determine which pricing option suits my needs best?
The pricing options vary based on user requirements and access needs. Individual users may opt for single-user licenses, while businesses requiring broader access may choose multi-user or enterprise licenses for cost-effective access to the report.
13. Are there any additional resources or data provided in the APAC Pharma Logistics Market report?
While the report offers comprehensive insights, it's advisable to review the specific contents or supplementary materials provided to ascertain if additional resources or data are available.
14. How can I stay updated on further developments or reports in the APAC Pharma Logistics Market?
To stay informed about further developments, trends, and reports in the APAC Pharma Logistics Market, consider subscribing to industry newsletters, following relevant companies and organizations, or regularly checking reputable industry news sources and publications.
Methodology
Step 1 - Identification of Relevant Samples Size from Population Database


Step 2 - Approaches for Defining Global Market Size (Value, Volume* & Price*)

Note*: In applicable scenarios
Step 3 - Data Sources
Primary Research
- Web Analytics
- Survey Reports
- Research Institute
- Latest Research Reports
- Opinion Leaders
Secondary Research
- Annual Reports
- White Paper
- Latest Press Release
- Industry Association
- Paid Database
- Investor Presentations

Step 4 - Data Triangulation
Involves using different sources of information in order to increase the validity of a study
These sources are likely to be stakeholders in a program - participants, other researchers, program staff, other community members, and so on.
Then we put all data in single framework & apply various statistical tools to find out the dynamic on the market.
During the analysis stage, feedback from the stakeholder groups would be compared to determine areas of agreement as well as areas of divergence