

Key Insights
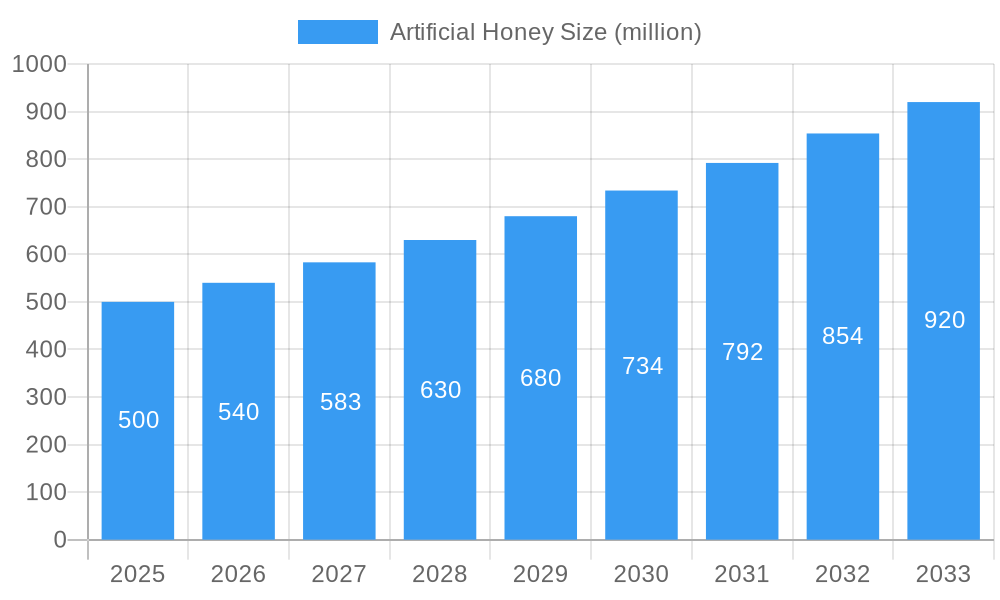
The artificial honey market is poised for significant expansion, fueled by escalating consumer demand for economical sweeteners and the growing adoption of vegan and vegetarian lifestyles. The projected market size for 2025 is estimated at $20.43 billion, exhibiting a Compound Annual Growth Rate (CAGR) of 6.66% for the forecast period. This growth is largely attributed to the increasing prevalence of diabetes and related health concerns, driving consumers toward low-sugar alternatives. Furthermore, the expanding food processing and beverage sectors are consistently generating demand for cost-effective sweetening agents. Emerging trends highlight a preference for artificial honey products with enhanced taste and texture, closely emulating natural honey.
Artificial Honey Market Size (In Billion)
Despite positive growth trajectories, the market confronts challenges including consumer apprehension regarding the potential health implications of artificial sweeteners and a rising preference for natural products, particularly in regions championing organic and natural foods. To mitigate these concerns, manufacturers are prioritizing ingredient transparency, emphasizing product health advantages over traditional honey, and promoting sustainable production practices. Key market participants are actively engaged in research and development to refine product offerings and address evolving consumer needs. Strategic investments in distribution channel expansion and brand building are crucial for market share acquisition. Further granular segment analysis would provide deeper insights into specific growth avenues, such as product types and application sectors.
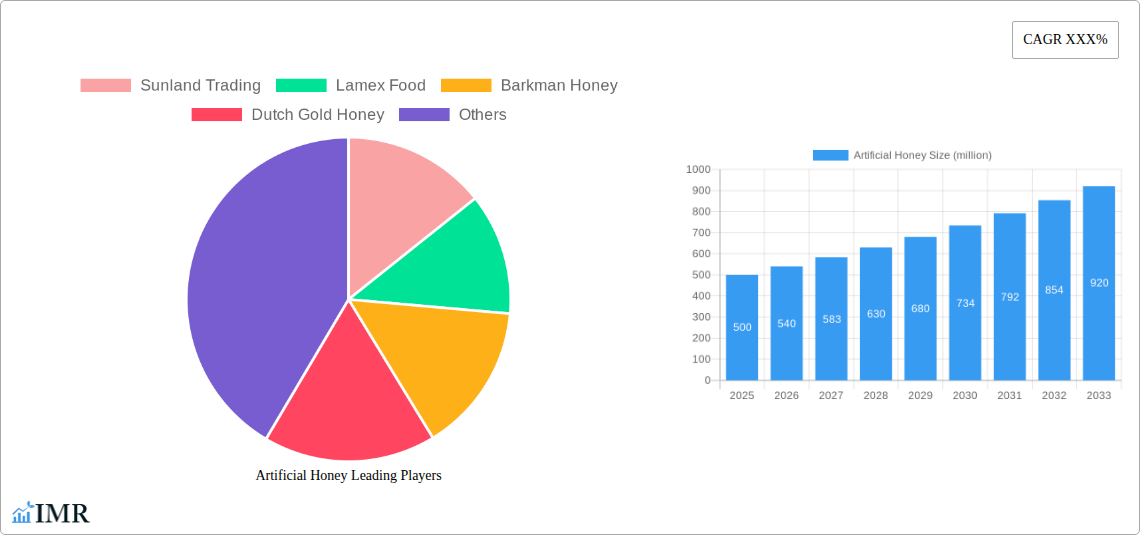
Artificial Honey Company Market Share
Artificial Honey Market Report: 2019-2033
This comprehensive report provides a detailed analysis of the artificial honey market, encompassing market dynamics, growth trends, regional performance, product landscape, and key players. The study period covers 2019-2033, with 2025 as the base and estimated year. The forecast period is 2025-2033, and the historical period is 2019-2024. This report is crucial for industry professionals, investors, and stakeholders seeking to understand and capitalize on the opportunities within this rapidly evolving market. The parent market is the sweetener market (valued at $xx million in 2024), and the child market is the artificial food ingredient market (valued at $xx million in 2024).
Artificial Honey Market Dynamics & Structure
The artificial honey market is characterized by moderate concentration, with key players like Sunland Trading, Lamex Food, Barkman Honey, and Dutch Gold Honey holding significant market share. Technological innovation, primarily in formulation and production processes, is a major driver. Regulatory frameworks concerning food additives and labeling significantly influence market dynamics. High-fructose corn syrup and other sweeteners act as competitive substitutes. End-user demographics show increasing demand from food processing industries and consumers seeking cost-effective alternatives. M&A activity remains relatively low, with only xx deals recorded between 2019 and 2024, totaling an estimated $xx million in value.
- Market Concentration: Moderately concentrated, with top 4 players holding approximately xx% market share.
- Technological Innovation: Focus on improving taste, texture, and cost-effectiveness.
- Regulatory Framework: Stringent regulations regarding labeling and additives.
- Competitive Substitutes: High-fructose corn syrup, other sugar alternatives.
- End-User Demographics: Growing demand from food manufacturers and health-conscious consumers.
- M&A Activity: Low activity, with xx deals totaling $xx million (2019-2024).
Artificial Honey Growth Trends & Insights
The global artificial honey market exhibited a CAGR of xx% during the historical period (2019-2024), reaching a market size of $xx million in 2024. Adoption rates have been steadily increasing, driven by factors such as cost-effectiveness and consistent product quality compared to natural honey. Technological advancements in production methods and ingredient sourcing have contributed to this growth. Consumer behavior shifts, particularly towards convenient and affordable food options, further fuel market expansion. The forecast period (2025-2033) projects continued growth, with a projected CAGR of xx%, reaching a market value of $xx million by 2033. Market penetration is expected to increase to xx% by 2033. Increased consumer awareness of natural honey price fluctuations is also a contributing factor.
Dominant Regions, Countries, or Segments in Artificial Honey
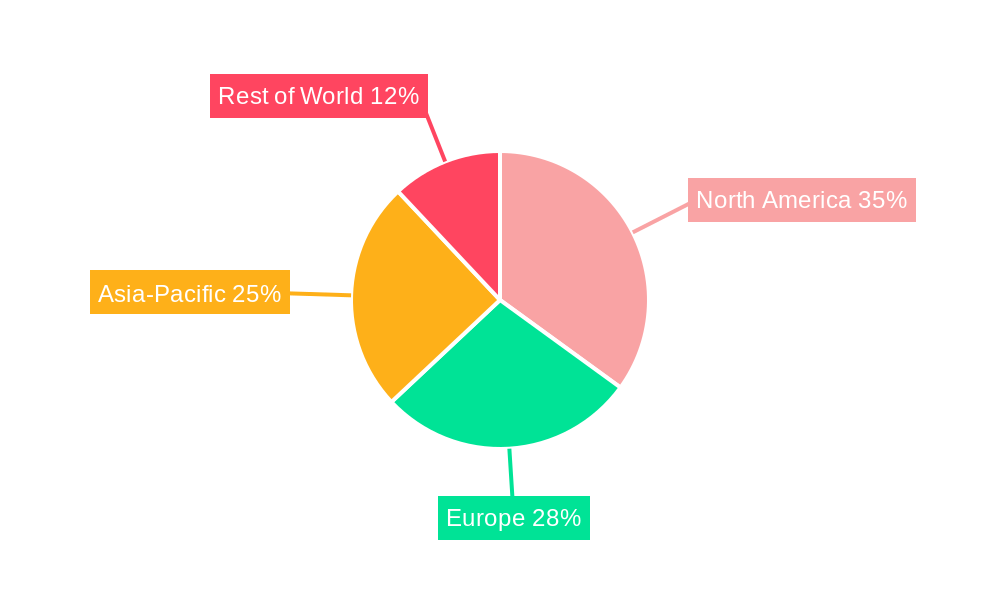
North America currently holds the largest market share in the artificial honey market, driven by high demand from food processing industries and a larger consumer base. This dominance is attributable to well-established food processing infrastructure, robust regulatory frameworks (despite the stringencies), and high disposable incomes. Europe holds the second largest market share, although growth is slightly slower due to stringent regulations and consumer preference for natural honey. Asia-Pacific is witnessing significant growth due to rising consumer disposable incomes and increasing food processing activities in emerging economies.
- North America: High demand, established infrastructure, and high disposable incomes.
- Europe: Moderate growth, influenced by stringent regulations and consumer preferences.
- Asia-Pacific: Rapid growth driven by rising disposable incomes and industrial expansion.
Artificial Honey Product Landscape
Artificial honey products primarily focus on replicating the taste, texture, and sweetness of natural honey at a lower cost. Innovations include improved formulations minimizing undesirable aftertastes and mimicking specific honey varieties. Applications span diverse food categories, including baked goods, confectionery, and beverages. Key performance indicators include sweetness level, viscosity, and cost-effectiveness. Unique selling propositions often center on consistent quality, predictable supply, and affordability compared to natural honey. Technological advancements are focused on enhancing taste profiles and reducing production costs.
Key Drivers, Barriers & Challenges in Artificial Honey
Key Drivers:
- Cost-effectiveness compared to natural honey.
- Consistent quality and supply.
- Growing demand from the food processing industry.
- Technological advancements in production.
Key Barriers & Challenges:
- Consumer perception and preference for natural honey. Negative perceptions create an adoption barrier, affecting approximately xx% of potential consumers.
- Stringent regulations regarding labeling and additives. These pose significant compliance costs impacting the market by approximately xx%.
- Competition from other sweeteners and sugar substitutes. Competitive pressures reduce market share growth by approximately xx%.
Emerging Opportunities in Artificial Honey
Emerging opportunities lie in developing customized artificial honey variants tailored for specific applications (e.g., low-glycemic index honey for health-conscious consumers). Untapped markets in developing countries offer significant growth potential. Exploring alternative sweeteners and production methods to further reduce costs could significantly impact market penetration. Expanding into niche markets, like artisanal food and specialty products, presents further opportunities.
Growth Accelerators in the Artificial Honey Industry
Technological breakthroughs in production processes, offering enhanced efficiency and lower costs, will significantly accelerate market growth. Strategic partnerships between ingredient suppliers and food manufacturers will facilitate product development and market penetration. Market expansion strategies targeting developing economies, with appropriate marketing campaigns highlighting the cost-effectiveness, will further drive market growth.
Key Players Shaping the Artificial Honey Market
- Sunland Trading
- Lamex Food
- Barkman Honey
- Dutch Gold Honey
Notable Milestones in Artificial Honey Sector
- 2020: Introduction of a new, cost-effective production process by Lamex Food.
- 2022: Sunland Trading launches a new line of organic-certified artificial honey.
- 2023: Barkman Honey secures a major contract with a leading beverage manufacturer.
- 2024: Dutch Gold Honey invests in R&D to improve product taste and texture.
In-Depth Artificial Honey Market Outlook
The artificial honey market shows significant growth potential driven by technological advancements, cost advantages, and expanding demand from diverse food sectors. Strategic partnerships, focused marketing campaigns, and expansion into new markets will be crucial for sustained growth. The market is poised for continued expansion, with significant opportunities for existing players and new entrants alike. The long-term outlook remains positive, with projected sustained growth through 2033 and beyond.
Artificial Honey Segmentation
-
1. Application
- 1.1. Food and Beverage
- 1.2. Medical
- 1.3. Others
-
2. Type
- 2.1. Honey Syrup
- 2.2. Botanical Extracts
Artificial Honey Segmentation By Geography
-
1. North America
- 1.1. United States
- 1.2. Canada
- 1.3. Mexico
-
2. South America
- 2.1. Brazil
- 2.2. Argentina
- 2.3. Rest of South America
-
3. Europe
- 3.1. United Kingdom
- 3.2. Germany
- 3.3. France
- 3.4. Italy
- 3.5. Spain
- 3.6. Russia
- 3.7. Benelux
- 3.8. Nordics
- 3.9. Rest of Europe
-
4. Middle East & Africa
- 4.1. Turkey
- 4.2. Israel
- 4.3. GCC
- 4.4. North Africa
- 4.5. South Africa
- 4.6. Rest of Middle East & Africa
-
5. Asia Pacific
- 5.1. China
- 5.2. India
- 5.3. Japan
- 5.4. South Korea
- 5.5. ASEAN
- 5.6. Oceania
- 5.7. Rest of Asia Pacific
Artificial Honey Regional Market Share
Geographic Coverage of Artificial Honey
Artificial Honey REPORT HIGHLIGHTS
| Aspects | Details |
|---|---|
| Study Period | 2020-2034 |
| Base Year | 2025 |
| Estimated Year | 2026 |
| Forecast Period | 2026-2034 |
| Historical Period | 2020-2025 |
| Growth Rate | CAGR of 6.66% from 2020-2034 |
| Segmentation |
|
Table of Contents
- 1. Introduction
- 1.1. Research Scope
- 1.2. Market Segmentation
- 1.3. Research Methodology
- 1.4. Definitions and Assumptions
- 2. Executive Summary
- 2.1. Introduction
- 3. Market Dynamics
- 3.1. Introduction
- 3.2. Market Drivers
- 3.3. Market Restrains
- 3.4. Market Trends
- 4. Market Factor Analysis
- 4.1. Porters Five Forces
- 4.2. Supply/Value Chain
- 4.3. PESTEL analysis
- 4.4. Market Entropy
- 4.5. Patent/Trademark Analysis
- 5. Global Artificial Honey Analysis, Insights and Forecast, 2020-2032
- 5.1. Market Analysis, Insights and Forecast - by Application
- 5.1.1. Food and Beverage
- 5.1.2. Medical
- 5.1.3. Others
- 5.2. Market Analysis, Insights and Forecast - by Type
- 5.2.1. Honey Syrup
- 5.2.2. Botanical Extracts
- 5.3. Market Analysis, Insights and Forecast - by Region
- 5.3.1. North America
- 5.3.2. South America
- 5.3.3. Europe
- 5.3.4. Middle East & Africa
- 5.3.5. Asia Pacific
- 5.1. Market Analysis, Insights and Forecast - by Application
- 6. North America Artificial Honey Analysis, Insights and Forecast, 2020-2032
- 6.1. Market Analysis, Insights and Forecast - by Application
- 6.1.1. Food and Beverage
- 6.1.2. Medical
- 6.1.3. Others
- 6.2. Market Analysis, Insights and Forecast - by Type
- 6.2.1. Honey Syrup
- 6.2.2. Botanical Extracts
- 6.1. Market Analysis, Insights and Forecast - by Application
- 7. South America Artificial Honey Analysis, Insights and Forecast, 2020-2032
- 7.1. Market Analysis, Insights and Forecast - by Application
- 7.1.1. Food and Beverage
- 7.1.2. Medical
- 7.1.3. Others
- 7.2. Market Analysis, Insights and Forecast - by Type
- 7.2.1. Honey Syrup
- 7.2.2. Botanical Extracts
- 7.1. Market Analysis, Insights and Forecast - by Application
- 8. Europe Artificial Honey Analysis, Insights and Forecast, 2020-2032
- 8.1. Market Analysis, Insights and Forecast - by Application
- 8.1.1. Food and Beverage
- 8.1.2. Medical
- 8.1.3. Others
- 8.2. Market Analysis, Insights and Forecast - by Type
- 8.2.1. Honey Syrup
- 8.2.2. Botanical Extracts
- 8.1. Market Analysis, Insights and Forecast - by Application
- 9. Middle East & Africa Artificial Honey Analysis, Insights and Forecast, 2020-2032
- 9.1. Market Analysis, Insights and Forecast - by Application
- 9.1.1. Food and Beverage
- 9.1.2. Medical
- 9.1.3. Others
- 9.2. Market Analysis, Insights and Forecast - by Type
- 9.2.1. Honey Syrup
- 9.2.2. Botanical Extracts
- 9.1. Market Analysis, Insights and Forecast - by Application
- 10. Asia Pacific Artificial Honey Analysis, Insights and Forecast, 2020-2032
- 10.1. Market Analysis, Insights and Forecast - by Application
- 10.1.1. Food and Beverage
- 10.1.2. Medical
- 10.1.3. Others
- 10.2. Market Analysis, Insights and Forecast - by Type
- 10.2.1. Honey Syrup
- 10.2.2. Botanical Extracts
- 10.1. Market Analysis, Insights and Forecast - by Application
- 11. Competitive Analysis
- 11.1. Global Market Share Analysis 2025
- 11.2. Company Profiles
- 11.2.1 Sunland Trading
- 11.2.1.1. Overview
- 11.2.1.2. Products
- 11.2.1.3. SWOT Analysis
- 11.2.1.4. Recent Developments
- 11.2.1.5. Financials (Based on Availability)
- 11.2.2 Lamex Food
- 11.2.2.1. Overview
- 11.2.2.2. Products
- 11.2.2.3. SWOT Analysis
- 11.2.2.4. Recent Developments
- 11.2.2.5. Financials (Based on Availability)
- 11.2.3 Barkman Honey
- 11.2.3.1. Overview
- 11.2.3.2. Products
- 11.2.3.3. SWOT Analysis
- 11.2.3.4. Recent Developments
- 11.2.3.5. Financials (Based on Availability)
- 11.2.4 Dutch Gold Honey
- 11.2.4.1. Overview
- 11.2.4.2. Products
- 11.2.4.3. SWOT Analysis
- 11.2.4.4. Recent Developments
- 11.2.4.5. Financials (Based on Availability)
- 11.2.1 Sunland Trading
List of Figures
- Figure 1: Global Artificial Honey Revenue Breakdown (billion, %) by Region 2025 & 2033
- Figure 2: North America Artificial Honey Revenue (billion), by Application 2025 & 2033
- Figure 3: North America Artificial Honey Revenue Share (%), by Application 2025 & 2033
- Figure 4: North America Artificial Honey Revenue (billion), by Type 2025 & 2033
- Figure 5: North America Artificial Honey Revenue Share (%), by Type 2025 & 2033
- Figure 6: North America Artificial Honey Revenue (billion), by Country 2025 & 2033
- Figure 7: North America Artificial Honey Revenue Share (%), by Country 2025 & 2033
- Figure 8: South America Artificial Honey Revenue (billion), by Application 2025 & 2033
- Figure 9: South America Artificial Honey Revenue Share (%), by Application 2025 & 2033
- Figure 10: South America Artificial Honey Revenue (billion), by Type 2025 & 2033
- Figure 11: South America Artificial Honey Revenue Share (%), by Type 2025 & 2033
- Figure 12: South America Artificial Honey Revenue (billion), by Country 2025 & 2033
- Figure 13: South America Artificial Honey Revenue Share (%), by Country 2025 & 2033
- Figure 14: Europe Artificial Honey Revenue (billion), by Application 2025 & 2033
- Figure 15: Europe Artificial Honey Revenue Share (%), by Application 2025 & 2033
- Figure 16: Europe Artificial Honey Revenue (billion), by Type 2025 & 2033
- Figure 17: Europe Artificial Honey Revenue Share (%), by Type 2025 & 2033
- Figure 18: Europe Artificial Honey Revenue (billion), by Country 2025 & 2033
- Figure 19: Europe Artificial Honey Revenue Share (%), by Country 2025 & 2033
- Figure 20: Middle East & Africa Artificial Honey Revenue (billion), by Application 2025 & 2033
- Figure 21: Middle East & Africa Artificial Honey Revenue Share (%), by Application 2025 & 2033
- Figure 22: Middle East & Africa Artificial Honey Revenue (billion), by Type 2025 & 2033
- Figure 23: Middle East & Africa Artificial Honey Revenue Share (%), by Type 2025 & 2033
- Figure 24: Middle East & Africa Artificial Honey Revenue (billion), by Country 2025 & 2033
- Figure 25: Middle East & Africa Artificial Honey Revenue Share (%), by Country 2025 & 2033
- Figure 26: Asia Pacific Artificial Honey Revenue (billion), by Application 2025 & 2033
- Figure 27: Asia Pacific Artificial Honey Revenue Share (%), by Application 2025 & 2033
- Figure 28: Asia Pacific Artificial Honey Revenue (billion), by Type 2025 & 2033
- Figure 29: Asia Pacific Artificial Honey Revenue Share (%), by Type 2025 & 2033
- Figure 30: Asia Pacific Artificial Honey Revenue (billion), by Country 2025 & 2033
- Figure 31: Asia Pacific Artificial Honey Revenue Share (%), by Country 2025 & 2033
List of Tables
- Table 1: Global Artificial Honey Revenue billion Forecast, by Application 2020 & 2033
- Table 2: Global Artificial Honey Revenue billion Forecast, by Type 2020 & 2033
- Table 3: Global Artificial Honey Revenue billion Forecast, by Region 2020 & 2033
- Table 4: Global Artificial Honey Revenue billion Forecast, by Application 2020 & 2033
- Table 5: Global Artificial Honey Revenue billion Forecast, by Type 2020 & 2033
- Table 6: Global Artificial Honey Revenue billion Forecast, by Country 2020 & 2033
- Table 7: United States Artificial Honey Revenue (billion) Forecast, by Application 2020 & 2033
- Table 8: Canada Artificial Honey Revenue (billion) Forecast, by Application 2020 & 2033
- Table 9: Mexico Artificial Honey Revenue (billion) Forecast, by Application 2020 & 2033
- Table 10: Global Artificial Honey Revenue billion Forecast, by Application 2020 & 2033
- Table 11: Global Artificial Honey Revenue billion Forecast, by Type 2020 & 2033
- Table 12: Global Artificial Honey Revenue billion Forecast, by Country 2020 & 2033
- Table 13: Brazil Artificial Honey Revenue (billion) Forecast, by Application 2020 & 2033
- Table 14: Argentina Artificial Honey Revenue (billion) Forecast, by Application 2020 & 2033
- Table 15: Rest of South America Artificial Honey Revenue (billion) Forecast, by Application 2020 & 2033
- Table 16: Global Artificial Honey Revenue billion Forecast, by Application 2020 & 2033
- Table 17: Global Artificial Honey Revenue billion Forecast, by Type 2020 & 2033
- Table 18: Global Artificial Honey Revenue billion Forecast, by Country 2020 & 2033
- Table 19: United Kingdom Artificial Honey Revenue (billion) Forecast, by Application 2020 & 2033
- Table 20: Germany Artificial Honey Revenue (billion) Forecast, by Application 2020 & 2033
- Table 21: France Artificial Honey Revenue (billion) Forecast, by Application 2020 & 2033
- Table 22: Italy Artificial Honey Revenue (billion) Forecast, by Application 2020 & 2033
- Table 23: Spain Artificial Honey Revenue (billion) Forecast, by Application 2020 & 2033
- Table 24: Russia Artificial Honey Revenue (billion) Forecast, by Application 2020 & 2033
- Table 25: Benelux Artificial Honey Revenue (billion) Forecast, by Application 2020 & 2033
- Table 26: Nordics Artificial Honey Revenue (billion) Forecast, by Application 2020 & 2033
- Table 27: Rest of Europe Artificial Honey Revenue (billion) Forecast, by Application 2020 & 2033
- Table 28: Global Artificial Honey Revenue billion Forecast, by Application 2020 & 2033
- Table 29: Global Artificial Honey Revenue billion Forecast, by Type 2020 & 2033
- Table 30: Global Artificial Honey Revenue billion Forecast, by Country 2020 & 2033
- Table 31: Turkey Artificial Honey Revenue (billion) Forecast, by Application 2020 & 2033
- Table 32: Israel Artificial Honey Revenue (billion) Forecast, by Application 2020 & 2033
- Table 33: GCC Artificial Honey Revenue (billion) Forecast, by Application 2020 & 2033
- Table 34: North Africa Artificial Honey Revenue (billion) Forecast, by Application 2020 & 2033
- Table 35: South Africa Artificial Honey Revenue (billion) Forecast, by Application 2020 & 2033
- Table 36: Rest of Middle East & Africa Artificial Honey Revenue (billion) Forecast, by Application 2020 & 2033
- Table 37: Global Artificial Honey Revenue billion Forecast, by Application 2020 & 2033
- Table 38: Global Artificial Honey Revenue billion Forecast, by Type 2020 & 2033
- Table 39: Global Artificial Honey Revenue billion Forecast, by Country 2020 & 2033
- Table 40: China Artificial Honey Revenue (billion) Forecast, by Application 2020 & 2033
- Table 41: India Artificial Honey Revenue (billion) Forecast, by Application 2020 & 2033
- Table 42: Japan Artificial Honey Revenue (billion) Forecast, by Application 2020 & 2033
- Table 43: South Korea Artificial Honey Revenue (billion) Forecast, by Application 2020 & 2033
- Table 44: ASEAN Artificial Honey Revenue (billion) Forecast, by Application 2020 & 2033
- Table 45: Oceania Artificial Honey Revenue (billion) Forecast, by Application 2020 & 2033
- Table 46: Rest of Asia Pacific Artificial Honey Revenue (billion) Forecast, by Application 2020 & 2033
Frequently Asked Questions
1. What is the projected Compound Annual Growth Rate (CAGR) of the Artificial Honey?
The projected CAGR is approximately 6.66%.
2. Which companies are prominent players in the Artificial Honey?
Key companies in the market include Sunland Trading, Lamex Food, Barkman Honey, Dutch Gold Honey.
3. What are the main segments of the Artificial Honey?
The market segments include Application, Type.
4. Can you provide details about the market size?
The market size is estimated to be USD 20.43 billion as of 2022.
5. What are some drivers contributing to market growth?
N/A
6. What are the notable trends driving market growth?
N/A
7. Are there any restraints impacting market growth?
N/A
8. Can you provide examples of recent developments in the market?
N/A
9. What pricing options are available for accessing the report?
Pricing options include single-user, multi-user, and enterprise licenses priced at USD 4250.00, USD 6375.00, and USD 8500.00 respectively.
10. Is the market size provided in terms of value or volume?
The market size is provided in terms of value, measured in billion.
11. Are there any specific market keywords associated with the report?
Yes, the market keyword associated with the report is "Artificial Honey," which aids in identifying and referencing the specific market segment covered.
12. How do I determine which pricing option suits my needs best?
The pricing options vary based on user requirements and access needs. Individual users may opt for single-user licenses, while businesses requiring broader access may choose multi-user or enterprise licenses for cost-effective access to the report.
13. Are there any additional resources or data provided in the Artificial Honey report?
While the report offers comprehensive insights, it's advisable to review the specific contents or supplementary materials provided to ascertain if additional resources or data are available.
14. How can I stay updated on further developments or reports in the Artificial Honey?
To stay informed about further developments, trends, and reports in the Artificial Honey, consider subscribing to industry newsletters, following relevant companies and organizations, or regularly checking reputable industry news sources and publications.
Methodology
Step 1 - Identification of Relevant Samples Size from Population Database


Step 2 - Approaches for Defining Global Market Size (Value, Volume* & Price*)

Note*: In applicable scenarios
Step 3 - Data Sources
Primary Research
- Web Analytics
- Survey Reports
- Research Institute
- Latest Research Reports
- Opinion Leaders
Secondary Research
- Annual Reports
- White Paper
- Latest Press Release
- Industry Association
- Paid Database
- Investor Presentations

Step 4 - Data Triangulation
Involves using different sources of information in order to increase the validity of a study
These sources are likely to be stakeholders in a program - participants, other researchers, program staff, other community members, and so on.
Then we put all data in single framework & apply various statistical tools to find out the dynamic on the market.
During the analysis stage, feedback from the stakeholder groups would be compared to determine areas of agreement as well as areas of divergence