

Key Insights
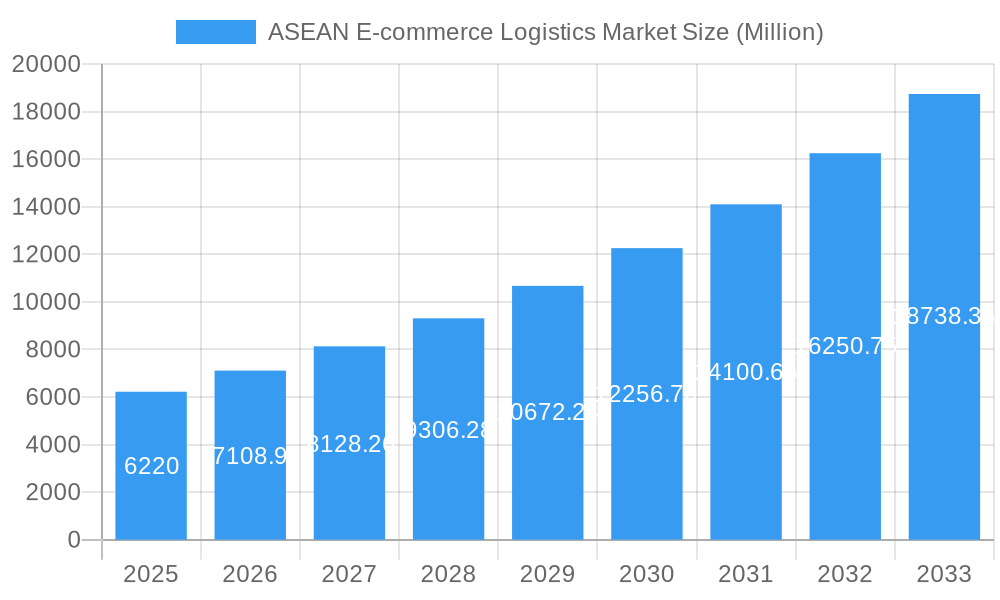
The ASEAN e-commerce logistics market, valued at $6.22 billion in 2025, is experiencing robust growth, projected to expand at a Compound Annual Growth Rate (CAGR) of 14.50% from 2025 to 2033. This surge is driven by several key factors. The rapid adoption of e-commerce across the region, fueled by increasing internet and smartphone penetration, is a primary catalyst. Furthermore, the rising middle class with increased disposable income and a preference for online shopping significantly boosts demand for efficient and reliable logistics services. The diversification of e-commerce products beyond traditional categories like fashion and electronics into areas such as food and groceries further fuels market expansion. Growth is also propelled by investments in technological advancements, such as automated warehousing, improved last-mile delivery solutions (including the rise of delivery networks and micro-fulfillment centers), and advanced data analytics for optimizing supply chains. Competitive pricing strategies among numerous players, including both established international firms and agile local businesses, also contributes to the market’s dynamism.
ASEAN E-commerce Logistics Market Market Size (In Billion)
However, challenges remain. Infrastructure limitations, particularly in less developed areas, hinder seamless delivery operations. Varying regulatory environments across different ASEAN countries can create complexities for logistics providers. Furthermore, the increasing demand for faster and more cost-effective delivery options puts pressure on companies to innovate and improve operational efficiencies while managing escalating fuel and labor costs. The market is segmented by service type (transportation, warehousing, value-added services), business model (B2B, B2C), destination (domestic, international), product type (fashion, electronics, home appliances, etc.), and country. Indonesia, Vietnam, and Thailand are expected to remain major contributors to the market's overall growth given their large populations and burgeoning e-commerce sectors. The dominance of key players like J&T Express, Shopee Express, and Ninja Van indicates a highly competitive landscape demanding continuous adaptation and innovation to maintain a strong market position.
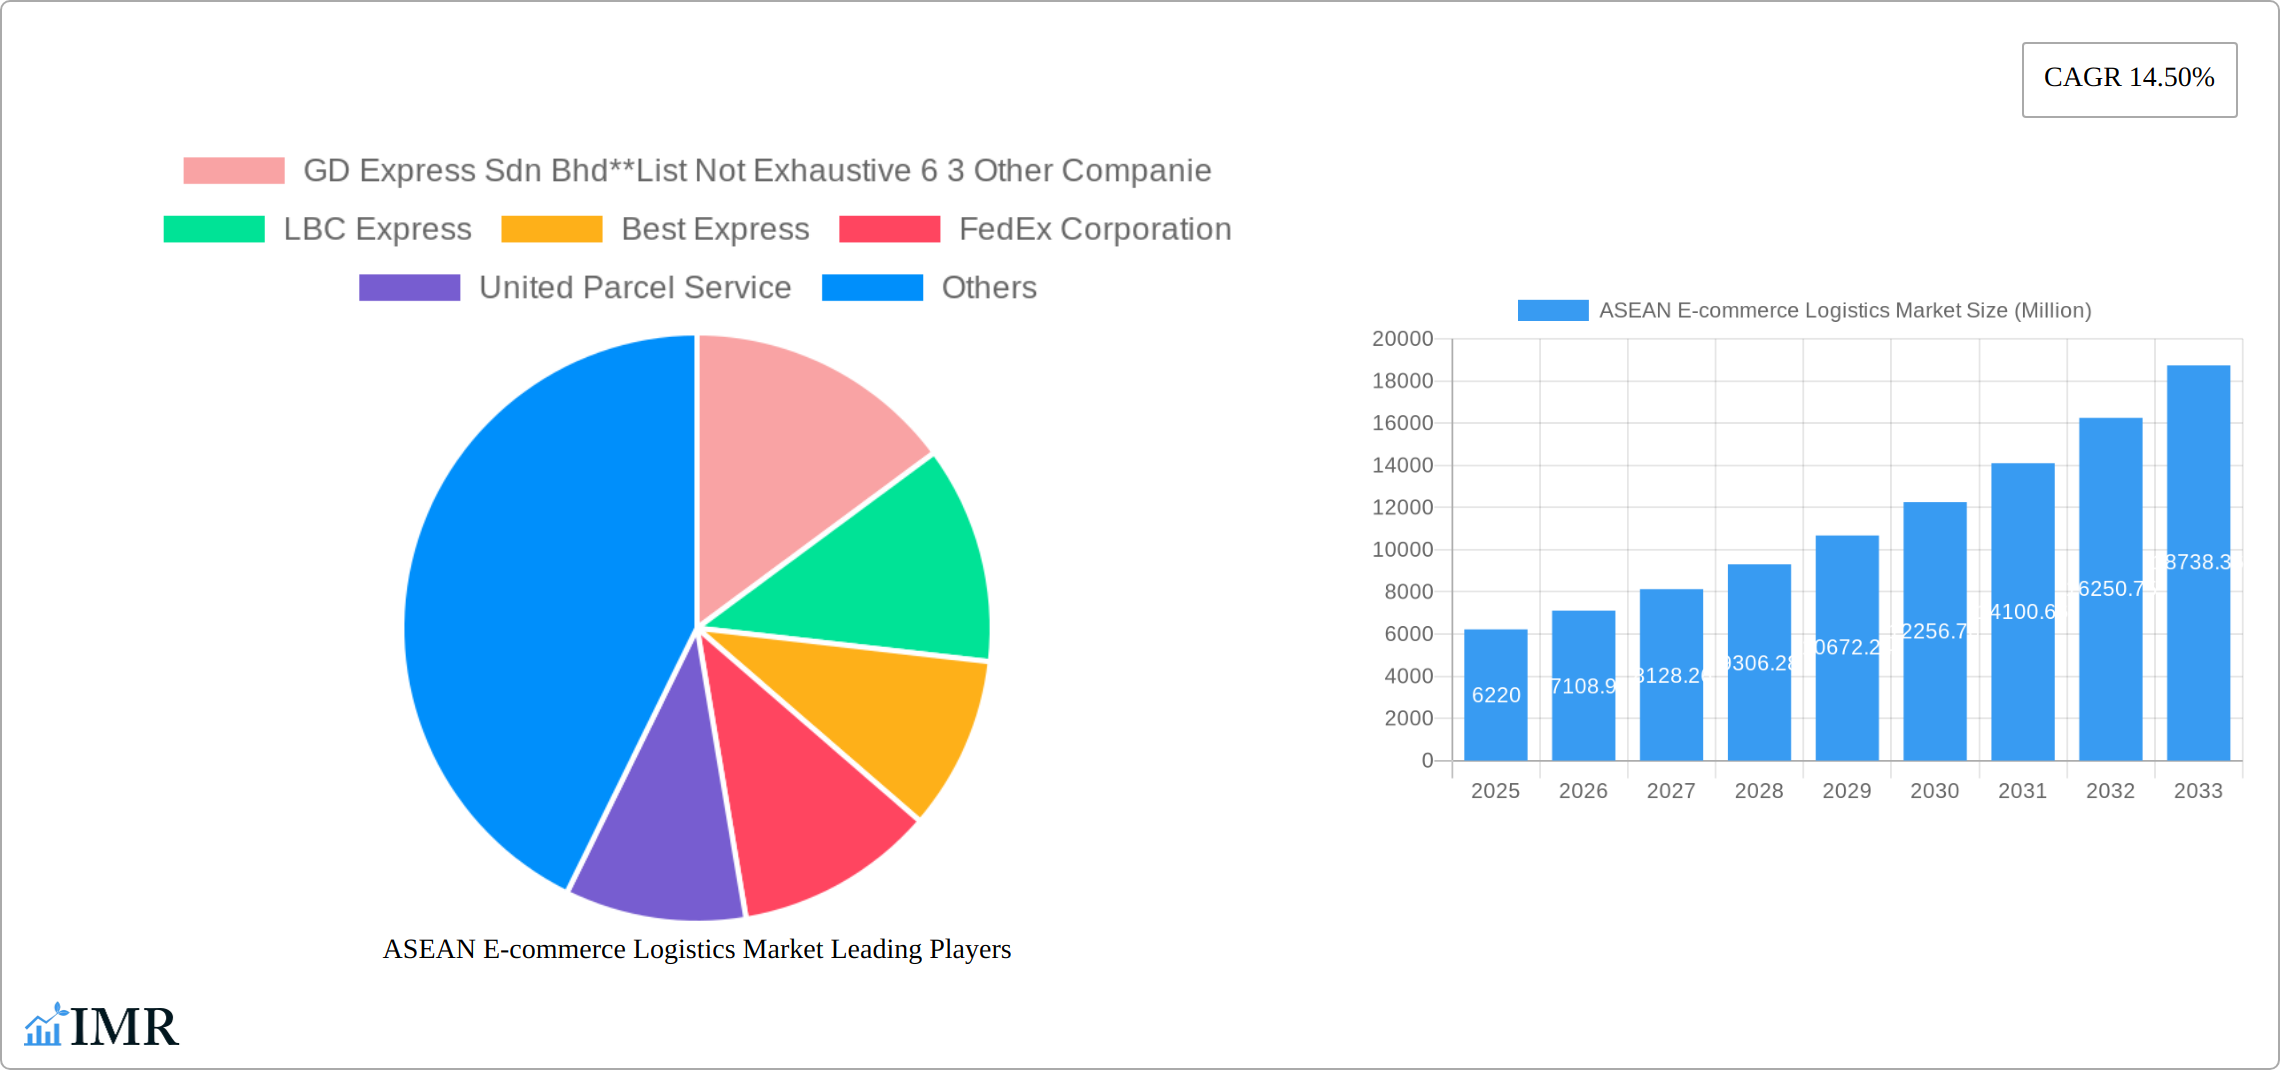
ASEAN E-commerce Logistics Market Company Market Share
ASEAN E-commerce Logistics Market: 2019-2033 Report
This comprehensive report provides a detailed analysis of the ASEAN e-commerce logistics market, offering invaluable insights for businesses and investors navigating this rapidly evolving landscape. Covering the period 2019-2033, with a focus on 2025, this report segments the market by service, business type, destination, product, and country, offering granular data to facilitate informed decision-making. The market is projected to reach xx Million units by 2033, driven by robust e-commerce growth and evolving consumer preferences.
ASEAN E-commerce Logistics Market Dynamics & Structure
The ASEAN e-commerce logistics market is characterized by a dynamic interplay of factors, influencing its growth trajectory and competitive landscape. Market concentration is moderate, with several key players holding significant shares, but also featuring a number of smaller, rapidly growing companies. Technological innovation, particularly in areas such as automation, AI-powered solutions, and last-mile delivery optimization, is a key driver. However, regulatory frameworks and varying infrastructure across the ASEAN region present both opportunities and challenges. The emergence of substitute services, such as drone delivery and alternative transportation modes, is impacting market dynamics. Finally, M&A activity is expected to continue, further shaping the competitive structure.
- Market Concentration: Moderate, with top players holding approximately xx% market share in 2025.
- Technological Innovation: Strong driver, focusing on automation, AI, and last-mile delivery improvements.
- Regulatory Frameworks: Vary significantly across ASEAN countries, creating both opportunities and hurdles.
- Competitive Substitutes: Drone delivery and alternative transportation methods are emerging.
- M&A Activity: Moderate deal volume, with a projected increase in the forecast period.
- End-User Demographics: Growing middle class and increased internet penetration are boosting demand.
ASEAN E-commerce Logistics Market Growth Trends & Insights
The ASEAN e-commerce logistics market has experienced a robust period of expansion from 2019 to 2024, demonstrating a Compound Annual Growth Rate (CAGR) of [Insert Actual CAGR Here]%. This dynamic growth is predominantly propelled by the escalating volume of online shopping activities, with the Business-to-Consumer (B2C) segment leading the charge. The market's estimated size was approximately [Insert Actual Market Size in Units for 2025 Here] Million units in 2025, and it is strategically projected to ascend to [Insert Actual Market Size in Units for 2033 Here] Million units by 2033. This upward trajectory is underpinned by a confluence of potent driving forces, including sustained increases in disposable incomes across the region, widespread proliferation of internet access and smartphone adoption, and a significantly higher propensity for consumers to engage with e-commerce platforms. Furthermore, rapid advancements in logistics technologies, encompassing the deployment of intelligent supply chain management systems and cutting-edge automation, are acting as significant catalysts for market growth. The evolving consumer preference for expedited delivery and enhanced convenience is also playing a pivotal role in shaping the market's future direction.
Dominant Regions, Countries, or Segments in ASEAN E-commerce Logistics Market
Indonesia and Vietnam are currently at the forefront, exhibiting substantial growth potential within the ASEAN e-commerce logistics landscape. This prominence is attributed to their large and youthful populations, a burgeoning middle class with increasing purchasing power, and a rapidly growing adoption rate of e-commerce services. The B2C segment unequivocally dominates the market, driven by the sheer volume of individual online purchases. Within service segments, the domestic logistics operations demonstrate significant volume. In terms of specialized services, transportation remains the largest segment, closely followed by warehousing and inventory management solutions. The fashion and apparel sector, alongside consumer electronics, consistently emerges as the leading product category driving e-commerce logistics demand.
- Leading Countries (by Market Size & Growth Potential): Indonesia, Vietnam, and Thailand stand out as key players.
- Dominant Segment (By Business Model): Business-to-Consumer (B2C) holds the largest market share.
- Dominant Segment (By Service): Transportation services, including last-mile delivery, are the most prominent.
- Dominant Segments (By Product Category): Fashion and Apparel, along with Consumer Electronics, represent the highest volume product categories.
- Key Growth Drivers: The rapid expansion of e-commerce, rising disposable incomes, and continuous infrastructure development are pivotal.
ASEAN E-commerce Logistics Market Product Landscape
The ASEAN e-commerce logistics market is witnessing significant product innovation, with a focus on enhancing efficiency and customer experience. This includes the integration of advanced technologies such as AI and machine learning for route optimization and predictive analytics, as well as the development of specialized solutions for handling fragile or temperature-sensitive goods. Value-added services, such as customized packaging and labeling, are gaining traction, addressing growing customer expectations.
Key Drivers, Barriers & Challenges in ASEAN E-commerce Logistics Market
Key Drivers: Rapid growth of e-commerce, increasing middle class, improving infrastructure, government initiatives to support the digital economy.
Key Challenges: Infrastructure gaps in some countries, varying regulatory environments, competition, cybersecurity concerns, and maintaining efficient last-mile delivery. These challenges can lead to increased costs and delays, impacting the overall customer experience and market efficiency.
Emerging Opportunities in ASEAN E-commerce Logistics Market
Untapped opportunities exist in expanding logistics services to rural areas, further developing cross-border e-commerce infrastructure, and introducing innovative last-mile delivery solutions such as drone delivery or autonomous vehicles. The increasing demand for specialized logistics services for temperature-sensitive goods and high-value products also represents a substantial opportunity.
Growth Accelerators in the ASEAN E-commerce Logistics Market Industry
Strategic alliances and collaborative ventures between prominent e-commerce platforms and specialized logistics providers are proving instrumental in scaling operational capacities and optimizing intricate delivery networks. The integration of advanced technological solutions, such as automated warehousing systems and AI-powered route optimization algorithms, is dramatically enhancing operational efficiencies and reducing delivery times. Furthermore, supportive government initiatives aimed at bolstering infrastructure development and streamlining regulatory frameworks are cultivating a conducive investment climate, thereby fostering sustainable and accelerated market growth.
Key Players Shaping the ASEAN E-commerce Logistics Market Market
- GD Express Sdn Bhd
- LBC Express
- Best Express
- FedEx Corporation
- United Parcel Service
- J&T Express
- PT Global Jet Express (J&T Express)
- Giao Hang Nhanh
- PT Citra Van Titipan Kilat (TIKI)
- PT Jalur Nugraha Ekakurir (JNE Express)
- Deutsche Post DHL Group
- Kerry Express
- Ninja Van
- Flash Express
- Pos Indonesia
- Various other emerging players and specialized logistics providers constitute the competitive landscape.
Notable Milestones in ASEAN E-commerce Logistics Market Sector
- 2020: Increased investment in warehouse automation across several ASEAN countries.
- 2021: Launch of several new cross-border e-commerce logistics platforms.
- 2022: Significant M&A activity within the sector.
- 2023: Expansion of last-mile delivery networks into previously underserved areas.
- 2024: Implementation of new regulations impacting cross-border logistics in several ASEAN countries.
In-Depth ASEAN E-commerce Logistics Market Outlook
The ASEAN e-commerce logistics market is poised for continued robust growth, driven by technological advancements, expanding e-commerce adoption, and supportive government policies. Strategic partnerships and investments in infrastructure development will play a key role in shaping the market's future. Opportunities abound for companies offering innovative solutions, specializing in niche sectors, and expanding into underserved markets. The market's future is bright, promising significant returns for businesses and investors who recognize and capitalize on the emerging opportunities.
ASEAN E-commerce Logistics Market Segmentation
-
1. Service
- 1.1. Transportation
- 1.2. Warehousing and Inventory Management
- 1.3. Value-added Services (Labeling, Packaging, etc.)
-
2. Business
- 2.1. B2B (Business-to-Business)
- 2.2. B2C (Business-to-Consumer)
-
3. Destination
- 3.1. Domestic
- 3.2. International/Cross-border
-
4. Product
- 4.1. Fashion and Apparel
- 4.2. Consumer Electronics
- 4.3. Home Appliances
- 4.4. Furniture
- 4.5. Beauty and Personal Care Products
- 4.6. Other Products (Toys, Food Products, etc.)
ASEAN E-commerce Logistics Market Segmentation By Geography
-
1. North America
- 1.1. United States
- 1.2. Canada
- 1.3. Mexico
-
2. South America
- 2.1. Brazil
- 2.2. Argentina
- 2.3. Rest of South America
-
3. Europe
- 3.1. United Kingdom
- 3.2. Germany
- 3.3. France
- 3.4. Italy
- 3.5. Spain
- 3.6. Russia
- 3.7. Benelux
- 3.8. Nordics
- 3.9. Rest of Europe
-
4. Middle East & Africa
- 4.1. Turkey
- 4.2. Israel
- 4.3. GCC
- 4.4. North Africa
- 4.5. South Africa
- 4.6. Rest of Middle East & Africa
-
5. Asia Pacific
- 5.1. China
- 5.2. India
- 5.3. Japan
- 5.4. South Korea
- 5.5. ASEAN
- 5.6. Oceania
- 5.7. Rest of Asia Pacific
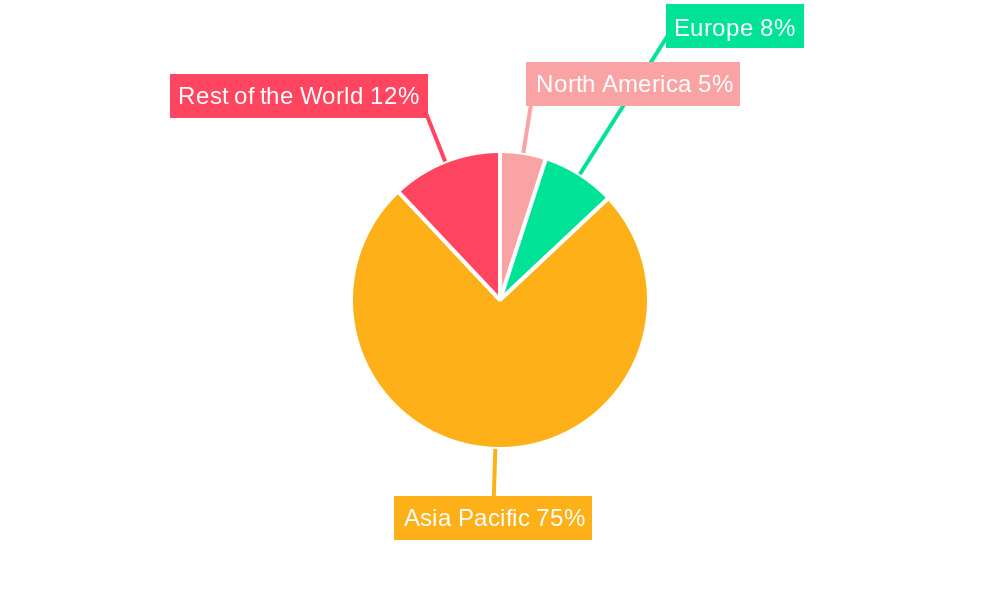
ASEAN E-commerce Logistics Market Regional Market Share
Geographic Coverage of ASEAN E-commerce Logistics Market
ASEAN E-commerce Logistics Market REPORT HIGHLIGHTS
| Aspects | Details |
|---|---|
| Study Period | 2020-2034 |
| Base Year | 2025 |
| Estimated Year | 2026 |
| Forecast Period | 2026-2034 |
| Historical Period | 2020-2025 |
| Growth Rate | CAGR of 14.50% from 2020-2034 |
| Segmentation |
|
Table of Contents
- 1. Introduction
- 1.1. Research Scope
- 1.2. Market Segmentation
- 1.3. Research Objective
- 1.4. Definitions and Assumptions
- 2. Executive Summary
- 2.1. Market Snapshot
- 3. Market Dynamics
- 3.1. Market Drivers
- 3.2. Market Restrains
- 3.3. Market Trends
- 3.4. Market Opportunities
- 4. Market Factor Analysis
- 4.1. Porters Five Forces
- 4.1.1. Bargaining Power of Suppliers
- 4.1.2. Bargaining Power of Buyers
- 4.1.3. Threat of New Entrants
- 4.1.4. Threat of Substitutes
- 4.1.5. Competitive Rivalry
- 4.2. PESTEL analysis
- 4.3. BCG Analysis
- 4.3.1. Stars (High Growth, High Market Share)
- 4.3.2. Cash Cows (Low Growth, High Market Share)
- 4.3.3. Question Mark (High Growth, Low Market Share)
- 4.3.4. Dogs (Low Growth, Low Market Share)
- 4.4. Ansoff Matrix Analysis
- 4.5. Supply Chain Analysis
- 4.6. Regulatory Landscape
- 4.7. Current Market Potential and Opportunity Assessment (TAM–SAM–SOM Framework)
- 4.8. IMR Analyst Note
- 4.1. Porters Five Forces
- 5. Market Analysis, Insights and Forecast 2021-2033
- 5.1. Market Analysis, Insights and Forecast - by Service
- 5.1.1. Transportation
- 5.1.2. Warehousing and Inventory Management
- 5.1.3. Value-added Services (Labeling, Packaging, etc.)
- 5.2. Market Analysis, Insights and Forecast - by Business
- 5.2.1. B2B (Business-to-Business)
- 5.2.2. B2C (Business-to-Consumer)
- 5.3. Market Analysis, Insights and Forecast - by Destination
- 5.3.1. Domestic
- 5.3.2. International/Cross-border
- 5.4. Market Analysis, Insights and Forecast - by Product
- 5.4.1. Fashion and Apparel
- 5.4.2. Consumer Electronics
- 5.4.3. Home Appliances
- 5.4.4. Furniture
- 5.4.5. Beauty and Personal Care Products
- 5.4.6. Other Products (Toys, Food Products, etc.)
- 5.5. Market Analysis, Insights and Forecast - by Region
- 5.5.1. North America
- 5.5.2. South America
- 5.5.3. Europe
- 5.5.4. Middle East & Africa
- 5.5.5. Asia Pacific
- 5.1. Market Analysis, Insights and Forecast - by Service
- 6. Global ASEAN E-commerce Logistics Market Analysis, Insights and Forecast, 2021-2033
- 6.1. Market Analysis, Insights and Forecast - by Service
- 6.1.1. Transportation
- 6.1.2. Warehousing and Inventory Management
- 6.1.3. Value-added Services (Labeling, Packaging, etc.)
- 6.2. Market Analysis, Insights and Forecast - by Business
- 6.2.1. B2B (Business-to-Business)
- 6.2.2. B2C (Business-to-Consumer)
- 6.3. Market Analysis, Insights and Forecast - by Destination
- 6.3.1. Domestic
- 6.3.2. International/Cross-border
- 6.4. Market Analysis, Insights and Forecast - by Product
- 6.4.1. Fashion and Apparel
- 6.4.2. Consumer Electronics
- 6.4.3. Home Appliances
- 6.4.4. Furniture
- 6.4.5. Beauty and Personal Care Products
- 6.4.6. Other Products (Toys, Food Products, etc.)
- 6.1. Market Analysis, Insights and Forecast - by Service
- 7. North America ASEAN E-commerce Logistics Market Analysis, Insights and Forecast, 2020-2032
- 7.1. Market Analysis, Insights and Forecast - by Service
- 7.1.1. Transportation
- 7.1.2. Warehousing and Inventory Management
- 7.1.3. Value-added Services (Labeling, Packaging, etc.)
- 7.2. Market Analysis, Insights and Forecast - by Business
- 7.2.1. B2B (Business-to-Business)
- 7.2.2. B2C (Business-to-Consumer)
- 7.3. Market Analysis, Insights and Forecast - by Destination
- 7.3.1. Domestic
- 7.3.2. International/Cross-border
- 7.4. Market Analysis, Insights and Forecast - by Product
- 7.4.1. Fashion and Apparel
- 7.4.2. Consumer Electronics
- 7.4.3. Home Appliances
- 7.4.4. Furniture
- 7.4.5. Beauty and Personal Care Products
- 7.4.6. Other Products (Toys, Food Products, etc.)
- 7.1. Market Analysis, Insights and Forecast - by Service
- 8. South America ASEAN E-commerce Logistics Market Analysis, Insights and Forecast, 2020-2032
- 8.1. Market Analysis, Insights and Forecast - by Service
- 8.1.1. Transportation
- 8.1.2. Warehousing and Inventory Management
- 8.1.3. Value-added Services (Labeling, Packaging, etc.)
- 8.2. Market Analysis, Insights and Forecast - by Business
- 8.2.1. B2B (Business-to-Business)
- 8.2.2. B2C (Business-to-Consumer)
- 8.3. Market Analysis, Insights and Forecast - by Destination
- 8.3.1. Domestic
- 8.3.2. International/Cross-border
- 8.4. Market Analysis, Insights and Forecast - by Product
- 8.4.1. Fashion and Apparel
- 8.4.2. Consumer Electronics
- 8.4.3. Home Appliances
- 8.4.4. Furniture
- 8.4.5. Beauty and Personal Care Products
- 8.4.6. Other Products (Toys, Food Products, etc.)
- 8.1. Market Analysis, Insights and Forecast - by Service
- 9. Europe ASEAN E-commerce Logistics Market Analysis, Insights and Forecast, 2020-2032
- 9.1. Market Analysis, Insights and Forecast - by Service
- 9.1.1. Transportation
- 9.1.2. Warehousing and Inventory Management
- 9.1.3. Value-added Services (Labeling, Packaging, etc.)
- 9.2. Market Analysis, Insights and Forecast - by Business
- 9.2.1. B2B (Business-to-Business)
- 9.2.2. B2C (Business-to-Consumer)
- 9.3. Market Analysis, Insights and Forecast - by Destination
- 9.3.1. Domestic
- 9.3.2. International/Cross-border
- 9.4. Market Analysis, Insights and Forecast - by Product
- 9.4.1. Fashion and Apparel
- 9.4.2. Consumer Electronics
- 9.4.3. Home Appliances
- 9.4.4. Furniture
- 9.4.5. Beauty and Personal Care Products
- 9.4.6. Other Products (Toys, Food Products, etc.)
- 9.1. Market Analysis, Insights and Forecast - by Service
- 10. Middle East & Africa ASEAN E-commerce Logistics Market Analysis, Insights and Forecast, 2020-2032
- 10.1. Market Analysis, Insights and Forecast - by Service
- 10.1.1. Transportation
- 10.1.2. Warehousing and Inventory Management
- 10.1.3. Value-added Services (Labeling, Packaging, etc.)
- 10.2. Market Analysis, Insights and Forecast - by Business
- 10.2.1. B2B (Business-to-Business)
- 10.2.2. B2C (Business-to-Consumer)
- 10.3. Market Analysis, Insights and Forecast - by Destination
- 10.3.1. Domestic
- 10.3.2. International/Cross-border
- 10.4. Market Analysis, Insights and Forecast - by Product
- 10.4.1. Fashion and Apparel
- 10.4.2. Consumer Electronics
- 10.4.3. Home Appliances
- 10.4.4. Furniture
- 10.4.5. Beauty and Personal Care Products
- 10.4.6. Other Products (Toys, Food Products, etc.)
- 10.1. Market Analysis, Insights and Forecast - by Service
- 11. Asia Pacific ASEAN E-commerce Logistics Market Analysis, Insights and Forecast, 2020-2032
- 11.1. Market Analysis, Insights and Forecast - by Service
- 11.1.1. Transportation
- 11.1.2. Warehousing and Inventory Management
- 11.1.3. Value-added Services (Labeling, Packaging, etc.)
- 11.2. Market Analysis, Insights and Forecast - by Business
- 11.2.1. B2B (Business-to-Business)
- 11.2.2. B2C (Business-to-Consumer)
- 11.3. Market Analysis, Insights and Forecast - by Destination
- 11.3.1. Domestic
- 11.3.2. International/Cross-border
- 11.4. Market Analysis, Insights and Forecast - by Product
- 11.4.1. Fashion and Apparel
- 11.4.2. Consumer Electronics
- 11.4.3. Home Appliances
- 11.4.4. Furniture
- 11.4.5. Beauty and Personal Care Products
- 11.4.6. Other Products (Toys, Food Products, etc.)
- 11.1. Market Analysis, Insights and Forecast - by Service
- 12. Competitive Analysis
- 12.1. Company Profiles
- 12.1.1 GD Express Sdn Bhd**List Not Exhaustive 6 3 Other Companie
- 12.1.1.1. Company Overview
- 12.1.1.2. Products
- 12.1.1.3. Company Financials
- 12.1.1.4. SWOT Analysis
- 12.1.2 LBC Express
- 12.1.2.1. Company Overview
- 12.1.2.2. Products
- 12.1.2.3. Company Financials
- 12.1.2.4. SWOT Analysis
- 12.1.3 Best Express
- 12.1.3.1. Company Overview
- 12.1.3.2. Products
- 12.1.3.3. Company Financials
- 12.1.3.4. SWOT Analysis
- 12.1.4 FedEx Corporation
- 12.1.4.1. Company Overview
- 12.1.4.2. Products
- 12.1.4.3. Company Financials
- 12.1.4.4. SWOT Analysis
- 12.1.5 United Parcel Service
- 12.1.5.1. Company Overview
- 12.1.5.2. Products
- 12.1.5.3. Company Financials
- 12.1.5.4. SWOT Analysis
- 12.1.6 J&T Express
- 12.1.6.1. Company Overview
- 12.1.6.2. Products
- 12.1.6.3. Company Financials
- 12.1.6.4. SWOT Analysis
- 12.1.7 PT Global Jet Express (J&T Express)
- 12.1.7.1. Company Overview
- 12.1.7.2. Products
- 12.1.7.3. Company Financials
- 12.1.7.4. SWOT Analysis
- 12.1.8 Giao Hang Nhanh
- 12.1.8.1. Company Overview
- 12.1.8.2. Products
- 12.1.8.3. Company Financials
- 12.1.8.4. SWOT Analysis
- 12.1.9 PT Citra Van Titipan Kilat (TIKI)
- 12.1.9.1. Company Overview
- 12.1.9.2. Products
- 12.1.9.3. Company Financials
- 12.1.9.4. SWOT Analysis
- 12.1.10 PT Jalur Nugraha Ekakurir (JNE Express)
- 12.1.10.1. Company Overview
- 12.1.10.2. Products
- 12.1.10.3. Company Financials
- 12.1.10.4. SWOT Analysis
- 12.1.11 Deutsche Post DHL Group
- 12.1.11.1. Company Overview
- 12.1.11.2. Products
- 12.1.11.3. Company Financials
- 12.1.11.4. SWOT Analysis
- 12.1.12 Kerry Express
- 12.1.12.1. Company Overview
- 12.1.12.2. Products
- 12.1.12.3. Company Financials
- 12.1.12.4. SWOT Analysis
- 12.1.13 Ninja Van
- 12.1.13.1. Company Overview
- 12.1.13.2. Products
- 12.1.13.3. Company Financials
- 12.1.13.4. SWOT Analysis
- 12.1.14 Flash Express
- 12.1.14.1. Company Overview
- 12.1.14.2. Products
- 12.1.14.3. Company Financials
- 12.1.14.4. SWOT Analysis
- 12.1.15 Pos Indonesia
- 12.1.15.1. Company Overview
- 12.1.15.2. Products
- 12.1.15.3. Company Financials
- 12.1.15.4. SWOT Analysis
- 12.1.1 GD Express Sdn Bhd**List Not Exhaustive 6 3 Other Companie
- 12.2. Market Entropy
- 12.2.1 Company's Key Areas Served
- 12.2.2 Recent Developments
- 12.3. Company Market Share Analysis 2025
- 12.3.1 Top 5 Companies Market Share Analysis
- 12.3.2 Top 3 Companies Market Share Analysis
- 12.4. List of Potential Customers
- 13. Research Methodology
List of Figures
- Figure 1: Global ASEAN E-commerce Logistics Market Revenue Breakdown (Million, %) by Region 2025 & 2033
- Figure 2: North America ASEAN E-commerce Logistics Market Revenue (Million), by Service 2025 & 2033
- Figure 3: North America ASEAN E-commerce Logistics Market Revenue Share (%), by Service 2025 & 2033
- Figure 4: North America ASEAN E-commerce Logistics Market Revenue (Million), by Business 2025 & 2033
- Figure 5: North America ASEAN E-commerce Logistics Market Revenue Share (%), by Business 2025 & 2033
- Figure 6: North America ASEAN E-commerce Logistics Market Revenue (Million), by Destination 2025 & 2033
- Figure 7: North America ASEAN E-commerce Logistics Market Revenue Share (%), by Destination 2025 & 2033
- Figure 8: North America ASEAN E-commerce Logistics Market Revenue (Million), by Product 2025 & 2033
- Figure 9: North America ASEAN E-commerce Logistics Market Revenue Share (%), by Product 2025 & 2033
- Figure 10: North America ASEAN E-commerce Logistics Market Revenue (Million), by Country 2025 & 2033
- Figure 11: North America ASEAN E-commerce Logistics Market Revenue Share (%), by Country 2025 & 2033
- Figure 12: South America ASEAN E-commerce Logistics Market Revenue (Million), by Service 2025 & 2033
- Figure 13: South America ASEAN E-commerce Logistics Market Revenue Share (%), by Service 2025 & 2033
- Figure 14: South America ASEAN E-commerce Logistics Market Revenue (Million), by Business 2025 & 2033
- Figure 15: South America ASEAN E-commerce Logistics Market Revenue Share (%), by Business 2025 & 2033
- Figure 16: South America ASEAN E-commerce Logistics Market Revenue (Million), by Destination 2025 & 2033
- Figure 17: South America ASEAN E-commerce Logistics Market Revenue Share (%), by Destination 2025 & 2033
- Figure 18: South America ASEAN E-commerce Logistics Market Revenue (Million), by Product 2025 & 2033
- Figure 19: South America ASEAN E-commerce Logistics Market Revenue Share (%), by Product 2025 & 2033
- Figure 20: South America ASEAN E-commerce Logistics Market Revenue (Million), by Country 2025 & 2033
- Figure 21: South America ASEAN E-commerce Logistics Market Revenue Share (%), by Country 2025 & 2033
- Figure 22: Europe ASEAN E-commerce Logistics Market Revenue (Million), by Service 2025 & 2033
- Figure 23: Europe ASEAN E-commerce Logistics Market Revenue Share (%), by Service 2025 & 2033
- Figure 24: Europe ASEAN E-commerce Logistics Market Revenue (Million), by Business 2025 & 2033
- Figure 25: Europe ASEAN E-commerce Logistics Market Revenue Share (%), by Business 2025 & 2033
- Figure 26: Europe ASEAN E-commerce Logistics Market Revenue (Million), by Destination 2025 & 2033
- Figure 27: Europe ASEAN E-commerce Logistics Market Revenue Share (%), by Destination 2025 & 2033
- Figure 28: Europe ASEAN E-commerce Logistics Market Revenue (Million), by Product 2025 & 2033
- Figure 29: Europe ASEAN E-commerce Logistics Market Revenue Share (%), by Product 2025 & 2033
- Figure 30: Europe ASEAN E-commerce Logistics Market Revenue (Million), by Country 2025 & 2033
- Figure 31: Europe ASEAN E-commerce Logistics Market Revenue Share (%), by Country 2025 & 2033
- Figure 32: Middle East & Africa ASEAN E-commerce Logistics Market Revenue (Million), by Service 2025 & 2033
- Figure 33: Middle East & Africa ASEAN E-commerce Logistics Market Revenue Share (%), by Service 2025 & 2033
- Figure 34: Middle East & Africa ASEAN E-commerce Logistics Market Revenue (Million), by Business 2025 & 2033
- Figure 35: Middle East & Africa ASEAN E-commerce Logistics Market Revenue Share (%), by Business 2025 & 2033
- Figure 36: Middle East & Africa ASEAN E-commerce Logistics Market Revenue (Million), by Destination 2025 & 2033
- Figure 37: Middle East & Africa ASEAN E-commerce Logistics Market Revenue Share (%), by Destination 2025 & 2033
- Figure 38: Middle East & Africa ASEAN E-commerce Logistics Market Revenue (Million), by Product 2025 & 2033
- Figure 39: Middle East & Africa ASEAN E-commerce Logistics Market Revenue Share (%), by Product 2025 & 2033
- Figure 40: Middle East & Africa ASEAN E-commerce Logistics Market Revenue (Million), by Country 2025 & 2033
- Figure 41: Middle East & Africa ASEAN E-commerce Logistics Market Revenue Share (%), by Country 2025 & 2033
- Figure 42: Asia Pacific ASEAN E-commerce Logistics Market Revenue (Million), by Service 2025 & 2033
- Figure 43: Asia Pacific ASEAN E-commerce Logistics Market Revenue Share (%), by Service 2025 & 2033
- Figure 44: Asia Pacific ASEAN E-commerce Logistics Market Revenue (Million), by Business 2025 & 2033
- Figure 45: Asia Pacific ASEAN E-commerce Logistics Market Revenue Share (%), by Business 2025 & 2033
- Figure 46: Asia Pacific ASEAN E-commerce Logistics Market Revenue (Million), by Destination 2025 & 2033
- Figure 47: Asia Pacific ASEAN E-commerce Logistics Market Revenue Share (%), by Destination 2025 & 2033
- Figure 48: Asia Pacific ASEAN E-commerce Logistics Market Revenue (Million), by Product 2025 & 2033
- Figure 49: Asia Pacific ASEAN E-commerce Logistics Market Revenue Share (%), by Product 2025 & 2033
- Figure 50: Asia Pacific ASEAN E-commerce Logistics Market Revenue (Million), by Country 2025 & 2033
- Figure 51: Asia Pacific ASEAN E-commerce Logistics Market Revenue Share (%), by Country 2025 & 2033
List of Tables
- Table 1: Global ASEAN E-commerce Logistics Market Revenue Million Forecast, by Service 2020 & 2033
- Table 2: Global ASEAN E-commerce Logistics Market Revenue Million Forecast, by Business 2020 & 2033
- Table 3: Global ASEAN E-commerce Logistics Market Revenue Million Forecast, by Destination 2020 & 2033
- Table 4: Global ASEAN E-commerce Logistics Market Revenue Million Forecast, by Product 2020 & 2033
- Table 5: Global ASEAN E-commerce Logistics Market Revenue Million Forecast, by Region 2020 & 2033
- Table 6: Global ASEAN E-commerce Logistics Market Revenue Million Forecast, by Service 2020 & 2033
- Table 7: Global ASEAN E-commerce Logistics Market Revenue Million Forecast, by Business 2020 & 2033
- Table 8: Global ASEAN E-commerce Logistics Market Revenue Million Forecast, by Destination 2020 & 2033
- Table 9: Global ASEAN E-commerce Logistics Market Revenue Million Forecast, by Product 2020 & 2033
- Table 10: Global ASEAN E-commerce Logistics Market Revenue Million Forecast, by Country 2020 & 2033
- Table 11: United States ASEAN E-commerce Logistics Market Revenue (Million) Forecast, by Application 2020 & 2033
- Table 12: Canada ASEAN E-commerce Logistics Market Revenue (Million) Forecast, by Application 2020 & 2033
- Table 13: Mexico ASEAN E-commerce Logistics Market Revenue (Million) Forecast, by Application 2020 & 2033
- Table 14: Global ASEAN E-commerce Logistics Market Revenue Million Forecast, by Service 2020 & 2033
- Table 15: Global ASEAN E-commerce Logistics Market Revenue Million Forecast, by Business 2020 & 2033
- Table 16: Global ASEAN E-commerce Logistics Market Revenue Million Forecast, by Destination 2020 & 2033
- Table 17: Global ASEAN E-commerce Logistics Market Revenue Million Forecast, by Product 2020 & 2033
- Table 18: Global ASEAN E-commerce Logistics Market Revenue Million Forecast, by Country 2020 & 2033
- Table 19: Brazil ASEAN E-commerce Logistics Market Revenue (Million) Forecast, by Application 2020 & 2033
- Table 20: Argentina ASEAN E-commerce Logistics Market Revenue (Million) Forecast, by Application 2020 & 2033
- Table 21: Rest of South America ASEAN E-commerce Logistics Market Revenue (Million) Forecast, by Application 2020 & 2033
- Table 22: Global ASEAN E-commerce Logistics Market Revenue Million Forecast, by Service 2020 & 2033
- Table 23: Global ASEAN E-commerce Logistics Market Revenue Million Forecast, by Business 2020 & 2033
- Table 24: Global ASEAN E-commerce Logistics Market Revenue Million Forecast, by Destination 2020 & 2033
- Table 25: Global ASEAN E-commerce Logistics Market Revenue Million Forecast, by Product 2020 & 2033
- Table 26: Global ASEAN E-commerce Logistics Market Revenue Million Forecast, by Country 2020 & 2033
- Table 27: United Kingdom ASEAN E-commerce Logistics Market Revenue (Million) Forecast, by Application 2020 & 2033
- Table 28: Germany ASEAN E-commerce Logistics Market Revenue (Million) Forecast, by Application 2020 & 2033
- Table 29: France ASEAN E-commerce Logistics Market Revenue (Million) Forecast, by Application 2020 & 2033
- Table 30: Italy ASEAN E-commerce Logistics Market Revenue (Million) Forecast, by Application 2020 & 2033
- Table 31: Spain ASEAN E-commerce Logistics Market Revenue (Million) Forecast, by Application 2020 & 2033
- Table 32: Russia ASEAN E-commerce Logistics Market Revenue (Million) Forecast, by Application 2020 & 2033
- Table 33: Benelux ASEAN E-commerce Logistics Market Revenue (Million) Forecast, by Application 2020 & 2033
- Table 34: Nordics ASEAN E-commerce Logistics Market Revenue (Million) Forecast, by Application 2020 & 2033
- Table 35: Rest of Europe ASEAN E-commerce Logistics Market Revenue (Million) Forecast, by Application 2020 & 2033
- Table 36: Global ASEAN E-commerce Logistics Market Revenue Million Forecast, by Service 2020 & 2033
- Table 37: Global ASEAN E-commerce Logistics Market Revenue Million Forecast, by Business 2020 & 2033
- Table 38: Global ASEAN E-commerce Logistics Market Revenue Million Forecast, by Destination 2020 & 2033
- Table 39: Global ASEAN E-commerce Logistics Market Revenue Million Forecast, by Product 2020 & 2033
- Table 40: Global ASEAN E-commerce Logistics Market Revenue Million Forecast, by Country 2020 & 2033
- Table 41: Turkey ASEAN E-commerce Logistics Market Revenue (Million) Forecast, by Application 2020 & 2033
- Table 42: Israel ASEAN E-commerce Logistics Market Revenue (Million) Forecast, by Application 2020 & 2033
- Table 43: GCC ASEAN E-commerce Logistics Market Revenue (Million) Forecast, by Application 2020 & 2033
- Table 44: North Africa ASEAN E-commerce Logistics Market Revenue (Million) Forecast, by Application 2020 & 2033
- Table 45: South Africa ASEAN E-commerce Logistics Market Revenue (Million) Forecast, by Application 2020 & 2033
- Table 46: Rest of Middle East & Africa ASEAN E-commerce Logistics Market Revenue (Million) Forecast, by Application 2020 & 2033
- Table 47: Global ASEAN E-commerce Logistics Market Revenue Million Forecast, by Service 2020 & 2033
- Table 48: Global ASEAN E-commerce Logistics Market Revenue Million Forecast, by Business 2020 & 2033
- Table 49: Global ASEAN E-commerce Logistics Market Revenue Million Forecast, by Destination 2020 & 2033
- Table 50: Global ASEAN E-commerce Logistics Market Revenue Million Forecast, by Product 2020 & 2033
- Table 51: Global ASEAN E-commerce Logistics Market Revenue Million Forecast, by Country 2020 & 2033
- Table 52: China ASEAN E-commerce Logistics Market Revenue (Million) Forecast, by Application 2020 & 2033
- Table 53: India ASEAN E-commerce Logistics Market Revenue (Million) Forecast, by Application 2020 & 2033
- Table 54: Japan ASEAN E-commerce Logistics Market Revenue (Million) Forecast, by Application 2020 & 2033
- Table 55: South Korea ASEAN E-commerce Logistics Market Revenue (Million) Forecast, by Application 2020 & 2033
- Table 56: ASEAN ASEAN E-commerce Logistics Market Revenue (Million) Forecast, by Application 2020 & 2033
- Table 57: Oceania ASEAN E-commerce Logistics Market Revenue (Million) Forecast, by Application 2020 & 2033
- Table 58: Rest of Asia Pacific ASEAN E-commerce Logistics Market Revenue (Million) Forecast, by Application 2020 & 2033
Frequently Asked Questions
1. What is the projected Compound Annual Growth Rate (CAGR) of the ASEAN E-commerce Logistics Market?
The projected CAGR is approximately 14.50%.
2. Which companies are prominent players in the ASEAN E-commerce Logistics Market?
Key companies in the market include GD Express Sdn Bhd**List Not Exhaustive 6 3 Other Companie, LBC Express, Best Express, FedEx Corporation, United Parcel Service, J&T Express, PT Global Jet Express (J&T Express), Giao Hang Nhanh, PT Citra Van Titipan Kilat (TIKI), PT Jalur Nugraha Ekakurir (JNE Express), Deutsche Post DHL Group, Kerry Express, Ninja Van, Flash Express, Pos Indonesia.
3. What are the main segments of the ASEAN E-commerce Logistics Market?
The market segments include Service, Business, Destination, Product.
4. Can you provide details about the market size?
The market size is estimated to be USD 6.22 Million as of 2022.
5. What are some drivers contributing to market growth?
4.; Growing E-commerce Sector.
6. What are the notable trends driving market growth?
E-commerce growth is driving the market.
7. Are there any restraints impacting market growth?
4.; Complicated Product Returns.
8. Can you provide examples of recent developments in the market?
N/A
9. What pricing options are available for accessing the report?
Pricing options include single-user, multi-user, and enterprise licenses priced at USD 3800, USD 4500, and USD 5800 respectively.
10. Is the market size provided in terms of value or volume?
The market size is provided in terms of value, measured in Million.
11. Are there any specific market keywords associated with the report?
Yes, the market keyword associated with the report is "ASEAN E-commerce Logistics Market," which aids in identifying and referencing the specific market segment covered.
12. How do I determine which pricing option suits my needs best?
The pricing options vary based on user requirements and access needs. Individual users may opt for single-user licenses, while businesses requiring broader access may choose multi-user or enterprise licenses for cost-effective access to the report.
13. Are there any additional resources or data provided in the ASEAN E-commerce Logistics Market report?
While the report offers comprehensive insights, it's advisable to review the specific contents or supplementary materials provided to ascertain if additional resources or data are available.
14. How can I stay updated on further developments or reports in the ASEAN E-commerce Logistics Market?
To stay informed about further developments, trends, and reports in the ASEAN E-commerce Logistics Market, consider subscribing to industry newsletters, following relevant companies and organizations, or regularly checking reputable industry news sources and publications.
Methodology
Step 1 - Identification of Relevant Samples Size from Population Database


Step 2 - Approaches for Defining Global Market Size (Value, Volume* & Price*)

Note*: In applicable scenarios
Step 3 - Data Sources
Primary Research
- Web Analytics
- Survey Reports
- Research Institute
- Latest Research Reports
- Opinion Leaders
Secondary Research
- Annual Reports
- White Paper
- Latest Press Release
- Industry Association
- Paid Database
- Investor Presentations

Step 4 - Data Triangulation
Involves using different sources of information in order to increase the validity of a study
These sources are likely to be stakeholders in a program - participants, other researchers, program staff, other community members, and so on.
Then we put all data in single framework & apply various statistical tools to find out the dynamic on the market.
During the analysis stage, feedback from the stakeholder groups would be compared to determine areas of agreement as well as areas of divergence