

Key Insights
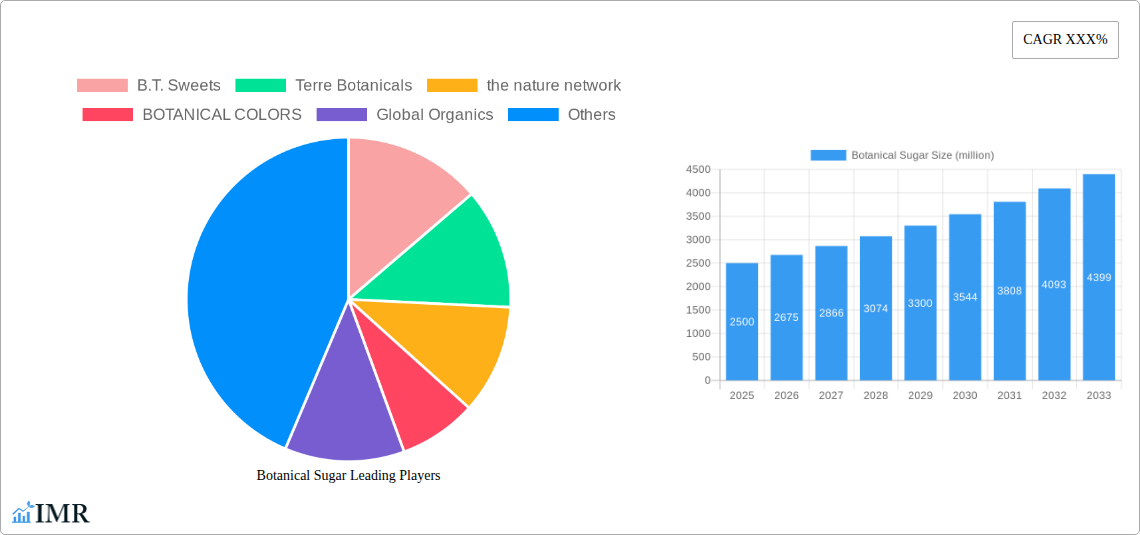
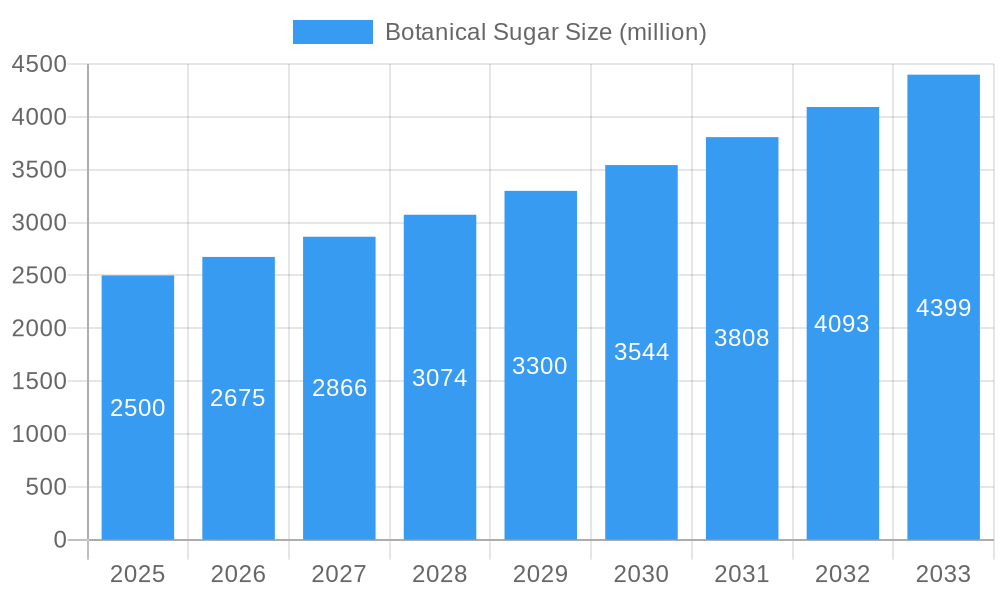
The botanical sugar market is experiencing robust growth, driven by increasing consumer demand for natural and healthier alternatives to traditional refined sugars. The market, estimated at $2.5 billion in 2025, is projected to expand at a compound annual growth rate (CAGR) of 7% from 2025 to 2033, reaching an estimated $4.5 billion by 2033. This growth is fueled by several key factors, including rising health consciousness among consumers, a growing preference for low-glycemic sweeteners, and increasing awareness of the negative health impacts of refined sugar. The rising prevalence of chronic diseases like diabetes and obesity is further accelerating the adoption of botanical sweeteners as a healthier alternative. Key trends include the increasing innovation in product formulations and the expansion of distribution channels to reach a wider consumer base. Major players like Cargill, ADM, and Ingredion are actively investing in research and development to improve the taste, texture, and functionality of botanical sugars, leading to broader application in various food and beverage products.
Botanical Sugar Market Size (In Billion)
However, market growth faces certain restraints. The relatively higher cost compared to conventional sugar remains a significant barrier, particularly in price-sensitive markets. Furthermore, consumer perceptions regarding taste and functionality can impact adoption rates. Nevertheless, the increasing availability of a wider variety of botanical sugar options, including stevia, monk fruit, and erythritol, along with ongoing technological advancements, are expected to gradually address these challenges and drive continued market expansion. Market segmentation based on product type (stevia, monk fruit, etc.), application (food, beverages, etc.), and geography will be vital for companies to strategically target specific consumer groups and market segments. The competitive landscape includes both established players and emerging businesses, indicating a dynamic market primed for innovation and expansion.
Botanical Sugar Company Market Share
Botanical Sugar Market Report: 2019-2033
This comprehensive report provides an in-depth analysis of the global botanical sugar market, encompassing market dynamics, growth trends, regional segmentation, product landscape, and key player analysis. The study period covers 2019-2033, with a base year of 2025 and a forecast period of 2025-2033. This report is essential for industry professionals, investors, and anyone seeking a comprehensive understanding of this burgeoning market. The report's detailed insights help navigate the complexities of this evolving sector, offering crucial data and projections to inform strategic decision-making. The total market size is projected to reach xx million units by 2033.
Botanical Sugar Market Dynamics & Structure
This section analyzes the market's competitive landscape, technological advancements, regulatory environment, and overall structure. The market is characterized by a moderate level of concentration, with key players holding significant market share. However, the entry of smaller, innovative companies is increasing competition.
- Market Concentration: The top 5 players collectively hold approximately 40% market share in 2025.
- Technological Innovation: Ongoing research focuses on improving extraction methods, enhancing sweetness profiles, and developing sustainable production processes. Innovation barriers include high R&D costs and stringent regulatory approvals.
- Regulatory Frameworks: Stringent food safety regulations vary across regions, influencing product development and market access. The lack of standardized regulations in some emerging markets presents a challenge.
- Competitive Product Substitutes: Artificial sweeteners and conventional sugar pose significant competitive challenges. However, the growing consumer preference for natural and healthy alternatives is driving market growth.
- End-User Demographics: Health-conscious consumers, particularly millennials and Gen Z, are the primary drivers of market demand. Increasing awareness of the health risks associated with conventional sugar is fueling this trend.
- M&A Trends: The past five years have witnessed xx M&A deals in the botanical sugar industry, primarily driven by consolidation efforts and expansion into new markets.
Botanical Sugar Growth Trends & Insights
The global botanical sugar market is experiencing significant growth, driven by increasing consumer demand for natural and healthier alternatives to refined sugar. The market size has grown from xx million units in 2019 to xx million units in 2024, and is projected to reach xx million units by 2033. This translates to a CAGR of xx% during the forecast period. Technological advancements, such as improved extraction techniques and innovative product formulations, are further accelerating market growth. The increasing adoption of botanical sugars in various food and beverage applications is a significant factor contributing to market expansion. Shifting consumer preferences towards natural sweeteners and a growing awareness of the adverse health effects of conventional sugar are also key drivers.
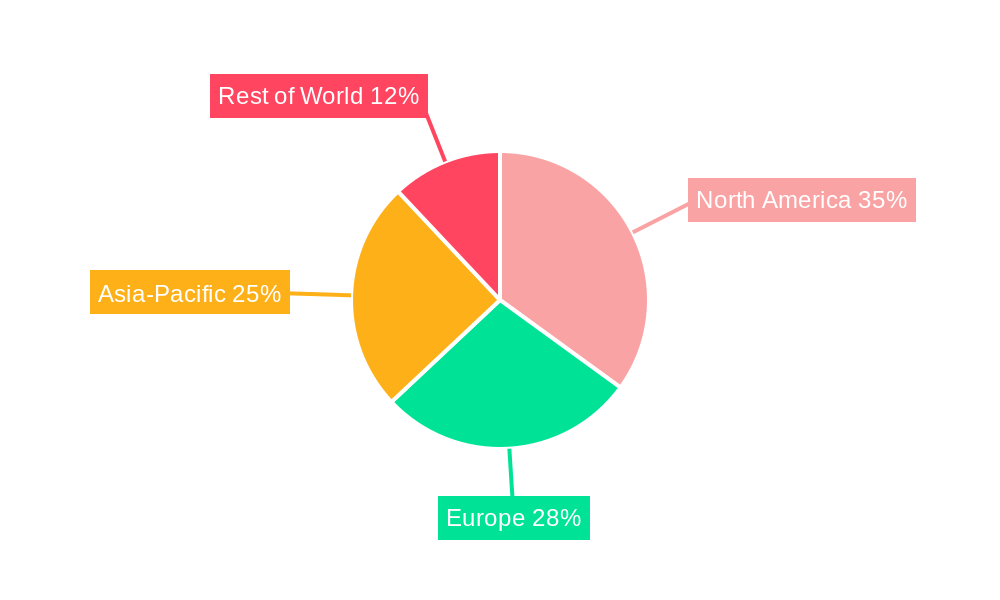
Dominant Regions, Countries, or Segments in Botanical Sugar
North America currently holds the largest market share, driven by high consumer awareness and adoption of healthier alternatives. However, Asia-Pacific is projected to witness the fastest growth rate during the forecast period, fueled by rising disposable incomes, changing dietary habits, and increasing health consciousness.
- North America: Strong consumer demand for natural and organic products, coupled with established distribution networks, contributes to its market dominance.
- Europe: Stricter regulations and a focus on sustainable practices drive market growth in this region.
- Asia-Pacific: Rapid economic growth, increasing health awareness, and a growing middle class are creating significant growth opportunities.
- Key Drivers: Growing health consciousness, increasing demand for natural sweeteners, and supportive government policies contribute to market growth in all regions.
Botanical Sugar Product Landscape
The botanical sugar market offers a diverse range of products, including stevia, monk fruit, agave nectar, and coconut sugar. Innovations focus on enhancing sweetness profiles, improving solubility, and developing products with better functional properties. Many brands highlight the natural origin, low-glycemic index, and potential health benefits of these products, creating a unique selling proposition for consumers.
Key Drivers, Barriers & Challenges in Botanical Sugar
Key Drivers: Increasing consumer demand for natural sweeteners, rising health awareness, and growing adoption in various food and beverage applications drive market growth. Government support for sustainable agriculture further boosts market expansion.
Key Challenges: High production costs, fluctuating raw material prices, and the potential for adulteration create challenges for manufacturers. The need for efficient and sustainable sourcing methods remains a key concern.
Emerging Opportunities in Botanical Sugar
Untapped markets in developing economies, particularly in Asia and Africa, offer significant growth potential. Innovations in product formulations, such as the development of novel blends and customized sweeteners, will further drive market expansion. The demand for botanical sugars in functional foods and beverages is increasing, paving the way for new opportunities.
Growth Accelerators in the Botanical Sugar Industry
Technological advancements in extraction and refining methods will improve production efficiency and reduce costs. Strategic partnerships between ingredient suppliers and food manufacturers will expand market reach and foster innovation. Government incentives and support for sustainable agriculture will further strengthen the growth trajectory of the botanical sugar industry.
Key Players Shaping the Botanical Sugar Market
- B.T. Sweets
- Terre Botanicals
- The Nature Network
- BOTANICAL COLORS
- Global Organics, Ltd.
- DO-IT Food Ingredients BV
- Louis Dreyfus Company B.V
- Cargill Incorporated
- Tate & Lyle
- ADM
- Ingredion Incorporated
- Roquette Freres
- Lakanto
- Layn Natural Ingredients
- Pyure Brands
- Monk Fruit Corp
Notable Milestones in Botanical Sugar Sector
- 2020: Launch of a new stevia-based sweetener with enhanced sweetness and improved solubility by a major ingredient supplier.
- 2022: Acquisition of a smaller botanical sugar producer by a large multinational food company, consolidating market share.
- 2023: Introduction of stringent regulations regarding the labeling and marketing of botanical sweeteners in the EU.
In-Depth Botanical Sugar Market Outlook
The botanical sugar market is poised for sustained growth driven by increasing health consciousness and the rising demand for natural and sustainable products. Strategic partnerships, technological advancements, and expansion into new markets will be crucial factors in driving long-term growth and unlocking untapped opportunities in this dynamic industry. The market is expected to experience a period of robust growth, presenting significant opportunities for both established players and new entrants.
Botanical Sugar Segmentation
-
1. Application
- 1.1. Food and Beverage Industry
- 1.2. Pharmaceutical Industry
- 1.3. Personal Care and Cosmetics Industry
- 1.4. Others
-
2. Type
- 2.1. Cane Sugar
- 2.2. Coconut Sugar
- 2.3. Maple Sugar
- 2.4. Palm Sugar
- 2.5. Stevia Sugar
- 2.6. Agave Sugar
- 2.7. Honey
- 2.8. Monk Fruit
- 2.9. Yacon Syrup
Botanical Sugar Segmentation By Geography
-
1. North America
- 1.1. United States
- 1.2. Canada
- 1.3. Mexico
-
2. South America
- 2.1. Brazil
- 2.2. Argentina
- 2.3. Rest of South America
-
3. Europe
- 3.1. United Kingdom
- 3.2. Germany
- 3.3. France
- 3.4. Italy
- 3.5. Spain
- 3.6. Russia
- 3.7. Benelux
- 3.8. Nordics
- 3.9. Rest of Europe
-
4. Middle East & Africa
- 4.1. Turkey
- 4.2. Israel
- 4.3. GCC
- 4.4. North Africa
- 4.5. South Africa
- 4.6. Rest of Middle East & Africa
-
5. Asia Pacific
- 5.1. China
- 5.2. India
- 5.3. Japan
- 5.4. South Korea
- 5.5. ASEAN
- 5.6. Oceania
- 5.7. Rest of Asia Pacific
Botanical Sugar Regional Market Share
Geographic Coverage of Botanical Sugar
Botanical Sugar REPORT HIGHLIGHTS
| Aspects | Details |
|---|---|
| Study Period | 2020-2034 |
| Base Year | 2025 |
| Estimated Year | 2026 |
| Forecast Period | 2026-2034 |
| Historical Period | 2020-2025 |
| Growth Rate | CAGR of 8.5% from 2020-2034 |
| Segmentation |
|
Table of Contents
- 1. Introduction
- 1.1. Research Scope
- 1.2. Market Segmentation
- 1.3. Research Methodology
- 1.4. Definitions and Assumptions
- 2. Executive Summary
- 2.1. Introduction
- 3. Market Dynamics
- 3.1. Introduction
- 3.2. Market Drivers
- 3.3. Market Restrains
- 3.4. Market Trends
- 4. Market Factor Analysis
- 4.1. Porters Five Forces
- 4.2. Supply/Value Chain
- 4.3. PESTEL analysis
- 4.4. Market Entropy
- 4.5. Patent/Trademark Analysis
- 5. Global Botanical Sugar Analysis, Insights and Forecast, 2020-2032
- 5.1. Market Analysis, Insights and Forecast - by Application
- 5.1.1. Food and Beverage Industry
- 5.1.2. Pharmaceutical Industry
- 5.1.3. Personal Care and Cosmetics Industry
- 5.1.4. Others
- 5.2. Market Analysis, Insights and Forecast - by Type
- 5.2.1. Cane Sugar
- 5.2.2. Coconut Sugar
- 5.2.3. Maple Sugar
- 5.2.4. Palm Sugar
- 5.2.5. Stevia Sugar
- 5.2.6. Agave Sugar
- 5.2.7. Honey
- 5.2.8. Monk Fruit
- 5.2.9. Yacon Syrup
- 5.3. Market Analysis, Insights and Forecast - by Region
- 5.3.1. North America
- 5.3.2. South America
- 5.3.3. Europe
- 5.3.4. Middle East & Africa
- 5.3.5. Asia Pacific
- 5.1. Market Analysis, Insights and Forecast - by Application
- 6. North America Botanical Sugar Analysis, Insights and Forecast, 2020-2032
- 6.1. Market Analysis, Insights and Forecast - by Application
- 6.1.1. Food and Beverage Industry
- 6.1.2. Pharmaceutical Industry
- 6.1.3. Personal Care and Cosmetics Industry
- 6.1.4. Others
- 6.2. Market Analysis, Insights and Forecast - by Type
- 6.2.1. Cane Sugar
- 6.2.2. Coconut Sugar
- 6.2.3. Maple Sugar
- 6.2.4. Palm Sugar
- 6.2.5. Stevia Sugar
- 6.2.6. Agave Sugar
- 6.2.7. Honey
- 6.2.8. Monk Fruit
- 6.2.9. Yacon Syrup
- 6.1. Market Analysis, Insights and Forecast - by Application
- 7. South America Botanical Sugar Analysis, Insights and Forecast, 2020-2032
- 7.1. Market Analysis, Insights and Forecast - by Application
- 7.1.1. Food and Beverage Industry
- 7.1.2. Pharmaceutical Industry
- 7.1.3. Personal Care and Cosmetics Industry
- 7.1.4. Others
- 7.2. Market Analysis, Insights and Forecast - by Type
- 7.2.1. Cane Sugar
- 7.2.2. Coconut Sugar
- 7.2.3. Maple Sugar
- 7.2.4. Palm Sugar
- 7.2.5. Stevia Sugar
- 7.2.6. Agave Sugar
- 7.2.7. Honey
- 7.2.8. Monk Fruit
- 7.2.9. Yacon Syrup
- 7.1. Market Analysis, Insights and Forecast - by Application
- 8. Europe Botanical Sugar Analysis, Insights and Forecast, 2020-2032
- 8.1. Market Analysis, Insights and Forecast - by Application
- 8.1.1. Food and Beverage Industry
- 8.1.2. Pharmaceutical Industry
- 8.1.3. Personal Care and Cosmetics Industry
- 8.1.4. Others
- 8.2. Market Analysis, Insights and Forecast - by Type
- 8.2.1. Cane Sugar
- 8.2.2. Coconut Sugar
- 8.2.3. Maple Sugar
- 8.2.4. Palm Sugar
- 8.2.5. Stevia Sugar
- 8.2.6. Agave Sugar
- 8.2.7. Honey
- 8.2.8. Monk Fruit
- 8.2.9. Yacon Syrup
- 8.1. Market Analysis, Insights and Forecast - by Application
- 9. Middle East & Africa Botanical Sugar Analysis, Insights and Forecast, 2020-2032
- 9.1. Market Analysis, Insights and Forecast - by Application
- 9.1.1. Food and Beverage Industry
- 9.1.2. Pharmaceutical Industry
- 9.1.3. Personal Care and Cosmetics Industry
- 9.1.4. Others
- 9.2. Market Analysis, Insights and Forecast - by Type
- 9.2.1. Cane Sugar
- 9.2.2. Coconut Sugar
- 9.2.3. Maple Sugar
- 9.2.4. Palm Sugar
- 9.2.5. Stevia Sugar
- 9.2.6. Agave Sugar
- 9.2.7. Honey
- 9.2.8. Monk Fruit
- 9.2.9. Yacon Syrup
- 9.1. Market Analysis, Insights and Forecast - by Application
- 10. Asia Pacific Botanical Sugar Analysis, Insights and Forecast, 2020-2032
- 10.1. Market Analysis, Insights and Forecast - by Application
- 10.1.1. Food and Beverage Industry
- 10.1.2. Pharmaceutical Industry
- 10.1.3. Personal Care and Cosmetics Industry
- 10.1.4. Others
- 10.2. Market Analysis, Insights and Forecast - by Type
- 10.2.1. Cane Sugar
- 10.2.2. Coconut Sugar
- 10.2.3. Maple Sugar
- 10.2.4. Palm Sugar
- 10.2.5. Stevia Sugar
- 10.2.6. Agave Sugar
- 10.2.7. Honey
- 10.2.8. Monk Fruit
- 10.2.9. Yacon Syrup
- 10.1. Market Analysis, Insights and Forecast - by Application
- 11. Competitive Analysis
- 11.1. Global Market Share Analysis 2025
- 11.2. Company Profiles
- 11.2.1 B.T. Sweets
- 11.2.1.1. Overview
- 11.2.1.2. Products
- 11.2.1.3. SWOT Analysis
- 11.2.1.4. Recent Developments
- 11.2.1.5. Financials (Based on Availability)
- 11.2.2 Terre Botanicals
- 11.2.2.1. Overview
- 11.2.2.2. Products
- 11.2.2.3. SWOT Analysis
- 11.2.2.4. Recent Developments
- 11.2.2.5. Financials (Based on Availability)
- 11.2.3 the nature network
- 11.2.3.1. Overview
- 11.2.3.2. Products
- 11.2.3.3. SWOT Analysis
- 11.2.3.4. Recent Developments
- 11.2.3.5. Financials (Based on Availability)
- 11.2.4 BOTANICAL COLORS
- 11.2.4.1. Overview
- 11.2.4.2. Products
- 11.2.4.3. SWOT Analysis
- 11.2.4.4. Recent Developments
- 11.2.4.5. Financials (Based on Availability)
- 11.2.5 Global Organics
- 11.2.5.1. Overview
- 11.2.5.2. Products
- 11.2.5.3. SWOT Analysis
- 11.2.5.4. Recent Developments
- 11.2.5.5. Financials (Based on Availability)
- 11.2.6 Ltd.
- 11.2.6.1. Overview
- 11.2.6.2. Products
- 11.2.6.3. SWOT Analysis
- 11.2.6.4. Recent Developments
- 11.2.6.5. Financials (Based on Availability)
- 11.2.7 DO-IT Food Ingredients BV
- 11.2.7.1. Overview
- 11.2.7.2. Products
- 11.2.7.3. SWOT Analysis
- 11.2.7.4. Recent Developments
- 11.2.7.5. Financials (Based on Availability)
- 11.2.8 Louis Dreyfus Company B.V
- 11.2.8.1. Overview
- 11.2.8.2. Products
- 11.2.8.3. SWOT Analysis
- 11.2.8.4. Recent Developments
- 11.2.8.5. Financials (Based on Availability)
- 11.2.9 Cargill Incorporated
- 11.2.9.1. Overview
- 11.2.9.2. Products
- 11.2.9.3. SWOT Analysis
- 11.2.9.4. Recent Developments
- 11.2.9.5. Financials (Based on Availability)
- 11.2.10 Tale & Lyle
- 11.2.10.1. Overview
- 11.2.10.2. Products
- 11.2.10.3. SWOT Analysis
- 11.2.10.4. Recent Developments
- 11.2.10.5. Financials (Based on Availability)
- 11.2.11 ADM
- 11.2.11.1. Overview
- 11.2.11.2. Products
- 11.2.11.3. SWOT Analysis
- 11.2.11.4. Recent Developments
- 11.2.11.5. Financials (Based on Availability)
- 11.2.12 Ingredion Incorporated
- 11.2.12.1. Overview
- 11.2.12.2. Products
- 11.2.12.3. SWOT Analysis
- 11.2.12.4. Recent Developments
- 11.2.12.5. Financials (Based on Availability)
- 11.2.13 Roquette Freres
- 11.2.13.1. Overview
- 11.2.13.2. Products
- 11.2.13.3. SWOT Analysis
- 11.2.13.4. Recent Developments
- 11.2.13.5. Financials (Based on Availability)
- 11.2.14 Lakanto
- 11.2.14.1. Overview
- 11.2.14.2. Products
- 11.2.14.3. SWOT Analysis
- 11.2.14.4. Recent Developments
- 11.2.14.5. Financials (Based on Availability)
- 11.2.15 Layn Natural Ingredients
- 11.2.15.1. Overview
- 11.2.15.2. Products
- 11.2.15.3. SWOT Analysis
- 11.2.15.4. Recent Developments
- 11.2.15.5. Financials (Based on Availability)
- 11.2.16 Pyure Brands
- 11.2.16.1. Overview
- 11.2.16.2. Products
- 11.2.16.3. SWOT Analysis
- 11.2.16.4. Recent Developments
- 11.2.16.5. Financials (Based on Availability)
- 11.2.17 Monk Fruit Corp
- 11.2.17.1. Overview
- 11.2.17.2. Products
- 11.2.17.3. SWOT Analysis
- 11.2.17.4. Recent Developments
- 11.2.17.5. Financials (Based on Availability)
- 11.2.1 B.T. Sweets
List of Figures
- Figure 1: Global Botanical Sugar Revenue Breakdown (undefined, %) by Region 2025 & 2033
- Figure 2: Global Botanical Sugar Volume Breakdown (K, %) by Region 2025 & 2033
- Figure 3: North America Botanical Sugar Revenue (undefined), by Application 2025 & 2033
- Figure 4: North America Botanical Sugar Volume (K), by Application 2025 & 2033
- Figure 5: North America Botanical Sugar Revenue Share (%), by Application 2025 & 2033
- Figure 6: North America Botanical Sugar Volume Share (%), by Application 2025 & 2033
- Figure 7: North America Botanical Sugar Revenue (undefined), by Type 2025 & 2033
- Figure 8: North America Botanical Sugar Volume (K), by Type 2025 & 2033
- Figure 9: North America Botanical Sugar Revenue Share (%), by Type 2025 & 2033
- Figure 10: North America Botanical Sugar Volume Share (%), by Type 2025 & 2033
- Figure 11: North America Botanical Sugar Revenue (undefined), by Country 2025 & 2033
- Figure 12: North America Botanical Sugar Volume (K), by Country 2025 & 2033
- Figure 13: North America Botanical Sugar Revenue Share (%), by Country 2025 & 2033
- Figure 14: North America Botanical Sugar Volume Share (%), by Country 2025 & 2033
- Figure 15: South America Botanical Sugar Revenue (undefined), by Application 2025 & 2033
- Figure 16: South America Botanical Sugar Volume (K), by Application 2025 & 2033
- Figure 17: South America Botanical Sugar Revenue Share (%), by Application 2025 & 2033
- Figure 18: South America Botanical Sugar Volume Share (%), by Application 2025 & 2033
- Figure 19: South America Botanical Sugar Revenue (undefined), by Type 2025 & 2033
- Figure 20: South America Botanical Sugar Volume (K), by Type 2025 & 2033
- Figure 21: South America Botanical Sugar Revenue Share (%), by Type 2025 & 2033
- Figure 22: South America Botanical Sugar Volume Share (%), by Type 2025 & 2033
- Figure 23: South America Botanical Sugar Revenue (undefined), by Country 2025 & 2033
- Figure 24: South America Botanical Sugar Volume (K), by Country 2025 & 2033
- Figure 25: South America Botanical Sugar Revenue Share (%), by Country 2025 & 2033
- Figure 26: South America Botanical Sugar Volume Share (%), by Country 2025 & 2033
- Figure 27: Europe Botanical Sugar Revenue (undefined), by Application 2025 & 2033
- Figure 28: Europe Botanical Sugar Volume (K), by Application 2025 & 2033
- Figure 29: Europe Botanical Sugar Revenue Share (%), by Application 2025 & 2033
- Figure 30: Europe Botanical Sugar Volume Share (%), by Application 2025 & 2033
- Figure 31: Europe Botanical Sugar Revenue (undefined), by Type 2025 & 2033
- Figure 32: Europe Botanical Sugar Volume (K), by Type 2025 & 2033
- Figure 33: Europe Botanical Sugar Revenue Share (%), by Type 2025 & 2033
- Figure 34: Europe Botanical Sugar Volume Share (%), by Type 2025 & 2033
- Figure 35: Europe Botanical Sugar Revenue (undefined), by Country 2025 & 2033
- Figure 36: Europe Botanical Sugar Volume (K), by Country 2025 & 2033
- Figure 37: Europe Botanical Sugar Revenue Share (%), by Country 2025 & 2033
- Figure 38: Europe Botanical Sugar Volume Share (%), by Country 2025 & 2033
- Figure 39: Middle East & Africa Botanical Sugar Revenue (undefined), by Application 2025 & 2033
- Figure 40: Middle East & Africa Botanical Sugar Volume (K), by Application 2025 & 2033
- Figure 41: Middle East & Africa Botanical Sugar Revenue Share (%), by Application 2025 & 2033
- Figure 42: Middle East & Africa Botanical Sugar Volume Share (%), by Application 2025 & 2033
- Figure 43: Middle East & Africa Botanical Sugar Revenue (undefined), by Type 2025 & 2033
- Figure 44: Middle East & Africa Botanical Sugar Volume (K), by Type 2025 & 2033
- Figure 45: Middle East & Africa Botanical Sugar Revenue Share (%), by Type 2025 & 2033
- Figure 46: Middle East & Africa Botanical Sugar Volume Share (%), by Type 2025 & 2033
- Figure 47: Middle East & Africa Botanical Sugar Revenue (undefined), by Country 2025 & 2033
- Figure 48: Middle East & Africa Botanical Sugar Volume (K), by Country 2025 & 2033
- Figure 49: Middle East & Africa Botanical Sugar Revenue Share (%), by Country 2025 & 2033
- Figure 50: Middle East & Africa Botanical Sugar Volume Share (%), by Country 2025 & 2033
- Figure 51: Asia Pacific Botanical Sugar Revenue (undefined), by Application 2025 & 2033
- Figure 52: Asia Pacific Botanical Sugar Volume (K), by Application 2025 & 2033
- Figure 53: Asia Pacific Botanical Sugar Revenue Share (%), by Application 2025 & 2033
- Figure 54: Asia Pacific Botanical Sugar Volume Share (%), by Application 2025 & 2033
- Figure 55: Asia Pacific Botanical Sugar Revenue (undefined), by Type 2025 & 2033
- Figure 56: Asia Pacific Botanical Sugar Volume (K), by Type 2025 & 2033
- Figure 57: Asia Pacific Botanical Sugar Revenue Share (%), by Type 2025 & 2033
- Figure 58: Asia Pacific Botanical Sugar Volume Share (%), by Type 2025 & 2033
- Figure 59: Asia Pacific Botanical Sugar Revenue (undefined), by Country 2025 & 2033
- Figure 60: Asia Pacific Botanical Sugar Volume (K), by Country 2025 & 2033
- Figure 61: Asia Pacific Botanical Sugar Revenue Share (%), by Country 2025 & 2033
- Figure 62: Asia Pacific Botanical Sugar Volume Share (%), by Country 2025 & 2033
List of Tables
- Table 1: Global Botanical Sugar Revenue undefined Forecast, by Application 2020 & 2033
- Table 2: Global Botanical Sugar Volume K Forecast, by Application 2020 & 2033
- Table 3: Global Botanical Sugar Revenue undefined Forecast, by Type 2020 & 2033
- Table 4: Global Botanical Sugar Volume K Forecast, by Type 2020 & 2033
- Table 5: Global Botanical Sugar Revenue undefined Forecast, by Region 2020 & 2033
- Table 6: Global Botanical Sugar Volume K Forecast, by Region 2020 & 2033
- Table 7: Global Botanical Sugar Revenue undefined Forecast, by Application 2020 & 2033
- Table 8: Global Botanical Sugar Volume K Forecast, by Application 2020 & 2033
- Table 9: Global Botanical Sugar Revenue undefined Forecast, by Type 2020 & 2033
- Table 10: Global Botanical Sugar Volume K Forecast, by Type 2020 & 2033
- Table 11: Global Botanical Sugar Revenue undefined Forecast, by Country 2020 & 2033
- Table 12: Global Botanical Sugar Volume K Forecast, by Country 2020 & 2033
- Table 13: United States Botanical Sugar Revenue (undefined) Forecast, by Application 2020 & 2033
- Table 14: United States Botanical Sugar Volume (K) Forecast, by Application 2020 & 2033
- Table 15: Canada Botanical Sugar Revenue (undefined) Forecast, by Application 2020 & 2033
- Table 16: Canada Botanical Sugar Volume (K) Forecast, by Application 2020 & 2033
- Table 17: Mexico Botanical Sugar Revenue (undefined) Forecast, by Application 2020 & 2033
- Table 18: Mexico Botanical Sugar Volume (K) Forecast, by Application 2020 & 2033
- Table 19: Global Botanical Sugar Revenue undefined Forecast, by Application 2020 & 2033
- Table 20: Global Botanical Sugar Volume K Forecast, by Application 2020 & 2033
- Table 21: Global Botanical Sugar Revenue undefined Forecast, by Type 2020 & 2033
- Table 22: Global Botanical Sugar Volume K Forecast, by Type 2020 & 2033
- Table 23: Global Botanical Sugar Revenue undefined Forecast, by Country 2020 & 2033
- Table 24: Global Botanical Sugar Volume K Forecast, by Country 2020 & 2033
- Table 25: Brazil Botanical Sugar Revenue (undefined) Forecast, by Application 2020 & 2033
- Table 26: Brazil Botanical Sugar Volume (K) Forecast, by Application 2020 & 2033
- Table 27: Argentina Botanical Sugar Revenue (undefined) Forecast, by Application 2020 & 2033
- Table 28: Argentina Botanical Sugar Volume (K) Forecast, by Application 2020 & 2033
- Table 29: Rest of South America Botanical Sugar Revenue (undefined) Forecast, by Application 2020 & 2033
- Table 30: Rest of South America Botanical Sugar Volume (K) Forecast, by Application 2020 & 2033
- Table 31: Global Botanical Sugar Revenue undefined Forecast, by Application 2020 & 2033
- Table 32: Global Botanical Sugar Volume K Forecast, by Application 2020 & 2033
- Table 33: Global Botanical Sugar Revenue undefined Forecast, by Type 2020 & 2033
- Table 34: Global Botanical Sugar Volume K Forecast, by Type 2020 & 2033
- Table 35: Global Botanical Sugar Revenue undefined Forecast, by Country 2020 & 2033
- Table 36: Global Botanical Sugar Volume K Forecast, by Country 2020 & 2033
- Table 37: United Kingdom Botanical Sugar Revenue (undefined) Forecast, by Application 2020 & 2033
- Table 38: United Kingdom Botanical Sugar Volume (K) Forecast, by Application 2020 & 2033
- Table 39: Germany Botanical Sugar Revenue (undefined) Forecast, by Application 2020 & 2033
- Table 40: Germany Botanical Sugar Volume (K) Forecast, by Application 2020 & 2033
- Table 41: France Botanical Sugar Revenue (undefined) Forecast, by Application 2020 & 2033
- Table 42: France Botanical Sugar Volume (K) Forecast, by Application 2020 & 2033
- Table 43: Italy Botanical Sugar Revenue (undefined) Forecast, by Application 2020 & 2033
- Table 44: Italy Botanical Sugar Volume (K) Forecast, by Application 2020 & 2033
- Table 45: Spain Botanical Sugar Revenue (undefined) Forecast, by Application 2020 & 2033
- Table 46: Spain Botanical Sugar Volume (K) Forecast, by Application 2020 & 2033
- Table 47: Russia Botanical Sugar Revenue (undefined) Forecast, by Application 2020 & 2033
- Table 48: Russia Botanical Sugar Volume (K) Forecast, by Application 2020 & 2033
- Table 49: Benelux Botanical Sugar Revenue (undefined) Forecast, by Application 2020 & 2033
- Table 50: Benelux Botanical Sugar Volume (K) Forecast, by Application 2020 & 2033
- Table 51: Nordics Botanical Sugar Revenue (undefined) Forecast, by Application 2020 & 2033
- Table 52: Nordics Botanical Sugar Volume (K) Forecast, by Application 2020 & 2033
- Table 53: Rest of Europe Botanical Sugar Revenue (undefined) Forecast, by Application 2020 & 2033
- Table 54: Rest of Europe Botanical Sugar Volume (K) Forecast, by Application 2020 & 2033
- Table 55: Global Botanical Sugar Revenue undefined Forecast, by Application 2020 & 2033
- Table 56: Global Botanical Sugar Volume K Forecast, by Application 2020 & 2033
- Table 57: Global Botanical Sugar Revenue undefined Forecast, by Type 2020 & 2033
- Table 58: Global Botanical Sugar Volume K Forecast, by Type 2020 & 2033
- Table 59: Global Botanical Sugar Revenue undefined Forecast, by Country 2020 & 2033
- Table 60: Global Botanical Sugar Volume K Forecast, by Country 2020 & 2033
- Table 61: Turkey Botanical Sugar Revenue (undefined) Forecast, by Application 2020 & 2033
- Table 62: Turkey Botanical Sugar Volume (K) Forecast, by Application 2020 & 2033
- Table 63: Israel Botanical Sugar Revenue (undefined) Forecast, by Application 2020 & 2033
- Table 64: Israel Botanical Sugar Volume (K) Forecast, by Application 2020 & 2033
- Table 65: GCC Botanical Sugar Revenue (undefined) Forecast, by Application 2020 & 2033
- Table 66: GCC Botanical Sugar Volume (K) Forecast, by Application 2020 & 2033
- Table 67: North Africa Botanical Sugar Revenue (undefined) Forecast, by Application 2020 & 2033
- Table 68: North Africa Botanical Sugar Volume (K) Forecast, by Application 2020 & 2033
- Table 69: South Africa Botanical Sugar Revenue (undefined) Forecast, by Application 2020 & 2033
- Table 70: South Africa Botanical Sugar Volume (K) Forecast, by Application 2020 & 2033
- Table 71: Rest of Middle East & Africa Botanical Sugar Revenue (undefined) Forecast, by Application 2020 & 2033
- Table 72: Rest of Middle East & Africa Botanical Sugar Volume (K) Forecast, by Application 2020 & 2033
- Table 73: Global Botanical Sugar Revenue undefined Forecast, by Application 2020 & 2033
- Table 74: Global Botanical Sugar Volume K Forecast, by Application 2020 & 2033
- Table 75: Global Botanical Sugar Revenue undefined Forecast, by Type 2020 & 2033
- Table 76: Global Botanical Sugar Volume K Forecast, by Type 2020 & 2033
- Table 77: Global Botanical Sugar Revenue undefined Forecast, by Country 2020 & 2033
- Table 78: Global Botanical Sugar Volume K Forecast, by Country 2020 & 2033
- Table 79: China Botanical Sugar Revenue (undefined) Forecast, by Application 2020 & 2033
- Table 80: China Botanical Sugar Volume (K) Forecast, by Application 2020 & 2033
- Table 81: India Botanical Sugar Revenue (undefined) Forecast, by Application 2020 & 2033
- Table 82: India Botanical Sugar Volume (K) Forecast, by Application 2020 & 2033
- Table 83: Japan Botanical Sugar Revenue (undefined) Forecast, by Application 2020 & 2033
- Table 84: Japan Botanical Sugar Volume (K) Forecast, by Application 2020 & 2033
- Table 85: South Korea Botanical Sugar Revenue (undefined) Forecast, by Application 2020 & 2033
- Table 86: South Korea Botanical Sugar Volume (K) Forecast, by Application 2020 & 2033
- Table 87: ASEAN Botanical Sugar Revenue (undefined) Forecast, by Application 2020 & 2033
- Table 88: ASEAN Botanical Sugar Volume (K) Forecast, by Application 2020 & 2033
- Table 89: Oceania Botanical Sugar Revenue (undefined) Forecast, by Application 2020 & 2033
- Table 90: Oceania Botanical Sugar Volume (K) Forecast, by Application 2020 & 2033
- Table 91: Rest of Asia Pacific Botanical Sugar Revenue (undefined) Forecast, by Application 2020 & 2033
- Table 92: Rest of Asia Pacific Botanical Sugar Volume (K) Forecast, by Application 2020 & 2033
Frequently Asked Questions
1. What is the projected Compound Annual Growth Rate (CAGR) of the Botanical Sugar?
The projected CAGR is approximately 8.5%.
2. Which companies are prominent players in the Botanical Sugar?
Key companies in the market include B.T. Sweets, Terre Botanicals, the nature network, BOTANICAL COLORS, Global Organics, Ltd., DO-IT Food Ingredients BV, Louis Dreyfus Company B.V, Cargill Incorporated, Tale & Lyle, ADM, Ingredion Incorporated, Roquette Freres, Lakanto, Layn Natural Ingredients, Pyure Brands, Monk Fruit Corp.
3. What are the main segments of the Botanical Sugar?
The market segments include Application, Type.
4. Can you provide details about the market size?
The market size is estimated to be USD XXX N/A as of 2022.
5. What are some drivers contributing to market growth?
N/A
6. What are the notable trends driving market growth?
N/A
7. Are there any restraints impacting market growth?
N/A
8. Can you provide examples of recent developments in the market?
N/A
9. What pricing options are available for accessing the report?
Pricing options include single-user, multi-user, and enterprise licenses priced at USD 3950.00, USD 5925.00, and USD 7900.00 respectively.
10. Is the market size provided in terms of value or volume?
The market size is provided in terms of value, measured in N/A and volume, measured in K.
11. Are there any specific market keywords associated with the report?
Yes, the market keyword associated with the report is "Botanical Sugar," which aids in identifying and referencing the specific market segment covered.
12. How do I determine which pricing option suits my needs best?
The pricing options vary based on user requirements and access needs. Individual users may opt for single-user licenses, while businesses requiring broader access may choose multi-user or enterprise licenses for cost-effective access to the report.
13. Are there any additional resources or data provided in the Botanical Sugar report?
While the report offers comprehensive insights, it's advisable to review the specific contents or supplementary materials provided to ascertain if additional resources or data are available.
14. How can I stay updated on further developments or reports in the Botanical Sugar?
To stay informed about further developments, trends, and reports in the Botanical Sugar, consider subscribing to industry newsletters, following relevant companies and organizations, or regularly checking reputable industry news sources and publications.
Methodology
Step 1 - Identification of Relevant Samples Size from Population Database


Step 2 - Approaches for Defining Global Market Size (Value, Volume* & Price*)

Note*: In applicable scenarios
Step 3 - Data Sources
Primary Research
- Web Analytics
- Survey Reports
- Research Institute
- Latest Research Reports
- Opinion Leaders
Secondary Research
- Annual Reports
- White Paper
- Latest Press Release
- Industry Association
- Paid Database
- Investor Presentations

Step 4 - Data Triangulation
Involves using different sources of information in order to increase the validity of a study
These sources are likely to be stakeholders in a program - participants, other researchers, program staff, other community members, and so on.
Then we put all data in single framework & apply various statistical tools to find out the dynamic on the market.
During the analysis stage, feedback from the stakeholder groups would be compared to determine areas of agreement as well as areas of divergence