

Key Insights
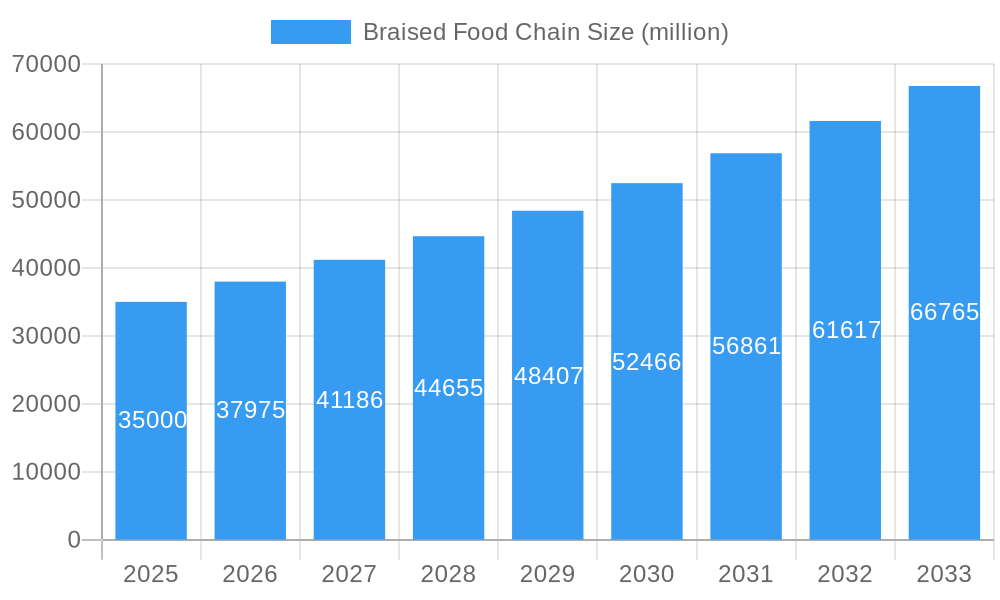
The global braised food market is demonstrating significant expansion, with an estimated market size projected to reach USD 15 billion by 2025. This growth is primarily driven by increasing consumer demand for convenient, ready-to-eat meals, especially among urban and younger populations. The appeal of savory, slow-cooked delicacies as both standalone dishes and meal components is a key factor. Furthermore, evolving culinary preferences and a desire for diverse food experiences are boosting the demand for a wider range of braised meats, from traditional favorites to regional specialties. Enhanced accessibility through organized retail expansion and growing e-commerce food sales also contribute to market penetration.
Braised Food Chain Market Size (In Billion)
The braised food market is forecasted for continued strong growth, with a projected Compound Annual Growth Rate (CAGR) of 7% between 2025 and 2033. This sustained expansion will be supported by ongoing product innovation focused on healthier options, diverse flavors, and attractive packaging. The emergence of dedicated braised food establishments and ghost kitchens supporting delivery services are notable trends. Key challenges include managing volatile raw material costs and navigating competitive landscapes. The Asia Pacific region, led by China, is expected to hold substantial market share due to established preferences for braised dishes. North America and Europe are also experiencing robust growth, fueled by the adoption of global food trends and demand for convenient, protein-rich options.
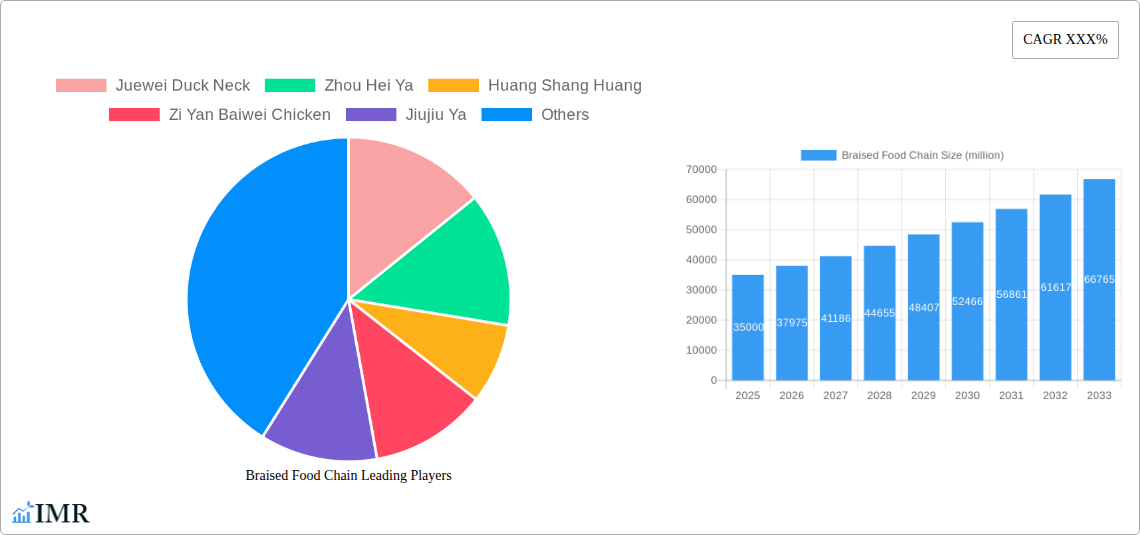
Braised Food Chain Company Market Share
Braised Food Chain Market Dynamics & Structure
The Braised Food Chain market is characterized by a moderate level of concentration, with dominant players like Juewei Duck Neck and Zhou Hei Ya holding significant market share. Technological innovation is a key driver, particularly in processing techniques, flavor development, and packaging solutions that extend shelf life and enhance convenience for consumers. Regulatory frameworks governing food safety, labeling, and sourcing play a crucial role in shaping market entry and operational standards. Competitive product substitutes include other ready-to-eat snacks and protein-rich convenience foods, necessitating continuous product differentiation and value proposition enhancement. End-user demographics are increasingly favoring younger, urban populations seeking convenient, flavorful, and high-quality protein options. Mergers and acquisitions (M&A) trends are observed as companies aim to consolidate market presence, acquire complementary technologies, or expand their distribution networks.
- Market Concentration: Moderate, with leading players holding substantial share, but still room for niche segment growth.
- Technological Innovation Drivers: Advanced braising techniques, novel flavor profiles, efficient preservation methods, and smart packaging.
- Regulatory Frameworks: Stringent food safety standards (e.g., HACCP, ISO 22000), clear labeling requirements, and traceability mandates.
- Competitive Product Substitutes: Other processed meats, plant-based protein snacks, and traditional home-cooked meals.
- End-User Demographics: Millennial and Gen Z consumers, urban professionals, and individuals with busy lifestyles.
- M&A Trends: Consolidation for market dominance, vertical integration, and expansion into new geographical markets.
Braised Food Chain Growth Trends & Insights
The Braised Food Chain market is poised for robust expansion, driven by evolving consumer preferences for convenient, flavorful, and ready-to-eat food options. The market size is projected to witness significant growth, fueled by increasing urbanization, rising disposable incomes, and a growing demand for high-protein snacks and meals. Adoption rates for pre-packaged braised foods are escalating, particularly among younger demographics who prioritize convenience and taste. Technological disruptions, such as advancements in preservation techniques and innovative flavor infusion methods, are enhancing product quality and shelf-life, thereby broadening consumer accessibility. Consumer behavior shifts are evident, with a growing inclination towards healthier, yet indulgent, snack options and a willingness to explore diverse culinary experiences.
The forecast period of 2025–2033 is expected to witness a Compound Annual Growth Rate (CAGR) of approximately 7.8% in the global braised food chain market, reaching an estimated value of $XX billion by 2033. This growth is underpinned by a substantial increase in market penetration, which is anticipated to rise from an estimated 35% in the base year of 2025 to over 55% by the end of the forecast period. Key drivers include the proliferation of modern retail channels and e-commerce platforms, which are making braised food products more accessible to a wider consumer base. Furthermore, a growing awareness of the protein content in braised foods, aligning with health and wellness trends, is also contributing to its appeal. The market is seeing a surge in product diversification, with manufacturers introducing a wider array of flavor profiles and ingredient combinations to cater to diverse palates and dietary preferences. This includes an increasing focus on perceived healthier braised options, such as reduced sodium or low-fat variants, and the incorporation of premium ingredients. The convenience factor remains paramount, with consumers actively seeking on-the-go meal solutions and satisfying snacks that require minimal preparation. This trend is particularly pronounced in urban centers where time constraints are a significant consideration for many households. Innovations in packaging technology are also playing a vital role, enabling extended shelf life and maintaining the freshness and quality of braised products during transit and storage. This technological advancement is crucial for expanding the reach of braised foods into regions with less developed cold chain infrastructure. The competitive landscape is dynamic, with established players continuously innovating and new entrants exploring niche segments. This healthy competition fosters further market development and consumer choice, ultimately accelerating the overall growth of the braised food chain. The increasing popularity of these products in both developed and emerging economies suggests a sustained upward trajectory for the foreseeable future.
Dominant Regions, Countries, or Segments in Braised Food Chain
The Asia-Pacific region stands as the dominant force in the global Braised Food Chain market, primarily driven by the burgeoning economies of China and Southeast Asian countries. The "Casual Snacks" application segment, encompassing ready-to-eat braised delicacies, exhibits the strongest growth momentum. Within this segment, braised duck products, led by iconic offerings from companies like Juewei Duck Neck and Zhou Hei Ya, command a significant market share due to deeply ingrained cultural preferences and widespread consumer familiarity. The region's dominance is further bolstered by favorable demographic trends, including a large and young population with increasing disposable incomes and a penchant for convenient, flavorful food options. Robust economic policies promoting the food processing industry, coupled with extensive investments in modern retail infrastructure and a highly developed e-commerce ecosystem, create an ideal environment for the expansion of braised food businesses.
- Leading Region: Asia-Pacific, particularly China and Southeast Asia.
- Dominant Application Segment: Casual Snacks, driven by the demand for convenient and ready-to-eat options.
- Key Product Type: Braised Duck, with substantial cultural acceptance and market penetration.
- Market Share & Growth Potential: Asia-Pacific holds an estimated 60% of the global market share, with a projected CAGR of 8.5% in the forecast period.
- Key Drivers in Dominance:
- Cultural Affinity: Deep-rooted consumer preference for braised flavors, especially duck and chicken.
- Urbanization & Middle-Class Growth: Increasing disposable incomes and demand for convenient food solutions.
- E-commerce & Modern Retail: Extensive reach and accessibility of products through online and offline channels.
- Government Support: Favorable policies for the food processing sector and agricultural development.
- Logistics & Supply Chain: Improving infrastructure for efficient distribution of perishable goods.
The "Serve with Food" application segment also contributes significantly, reflecting the traditional role of braised dishes as accompaniments to staple meals. Countries like China, with its vast population and established culinary traditions, are key contributors to this segment's strength. The accessibility of raw materials for braising, such as duck and chicken, further supports domestic production and consumption. Emerging economies within the Asia-Pacific are increasingly adopting these convenient food formats, signifying substantial untapped growth potential. The competitive landscape in these dominant regions is intense, fostering continuous innovation in product variety, flavor profiles, and packaging to capture consumer attention. Companies are also focusing on expanding their distribution networks, venturing into smaller cities and rural areas to maximize market reach. The health consciousness trend is also influencing product development, with a growing demand for braised options that are perceived as healthier, such as those with reduced salt or fat content. The overall dominance of the Asia-Pacific region is a testament to its strong consumer base, supportive infrastructure, and the inherent appeal of braised food products.
Braised Food Chain Product Landscape
The Braised Food Chain product landscape is characterized by a continuous stream of innovations aimed at enhancing flavor complexity, convenience, and nutritional appeal. Companies are investing in advanced braising techniques that lock in moisture and maximize ingredient absorption, resulting in more tender and flavorful products. Unique selling propositions often revolve around proprietary spice blends, heritage recipes, and the use of premium quality ingredients. Technological advancements in packaging, such as modified atmosphere packaging (MAP) and retort pouch technology, are extending shelf life and ensuring product freshness, making braised foods accessible to a wider consumer base and enabling broader geographical distribution.
Key Drivers, Barriers & Challenges in Braised Food Chain
Key Drivers:
- Convenience: Increasing consumer demand for quick, ready-to-eat meal solutions due to busy lifestyles.
- Flavor & Taste: The inherent appeal of rich, savory, and complex flavors offered by braised foods.
- Health & Nutrition Trends: Growing consumer interest in protein-rich food options, with braised meats being a good source.
- E-commerce & Modern Retail: Expanded accessibility and distribution channels for convenience foods.
- Technological Advancements: Innovations in preservation, packaging, and processing techniques enhancing quality and shelf life.
Barriers & Challenges:
- Supply Chain Volatility: Fluctuations in raw material prices (e.g., poultry, spices) and availability can impact production costs.
- Regulatory Hurdles: Stringent food safety regulations and varying standards across different regions can pose compliance challenges.
- Perception of Unhealthiness: Some consumers associate processed and braised foods with high sodium or fat content, requiring educational efforts.
- Intense Competition: A crowded market with established players and new entrants necessitates continuous product differentiation and marketing investment.
- Shelf-Life Limitations: Despite advancements, maintaining optimal freshness and quality over extended periods remains a challenge for certain products.
Emerging Opportunities in Braised Food Chain
Emerging opportunities within the Braised Food Chain lie in catering to specialized dietary needs and exploring novel flavor fusion. The demand for plant-based braised alternatives is on the rise, presenting a significant untapped market. Additionally, the integration of international braising techniques and flavor profiles into existing product lines can attract a wider, more adventurous consumer base. Leveraging advanced processing technologies for improved texture and nutrient retention in braised products, particularly for plant-based options, will be crucial. Furthermore, direct-to-consumer (DTC) models and subscription box services for curated braised food experiences offer promising avenues for enhanced customer engagement and market penetration.
Growth Accelerators in the Braised Food Chain Industry
Long-term growth in the Braised Food Chain industry is being significantly accelerated by ongoing technological breakthroughs in food science and processing. Innovations in ultra-high temperature processing and advanced sous-vide techniques are leading to superior product quality, extended shelf life, and enhanced nutrient preservation. Strategic partnerships between ingredient suppliers, manufacturers, and distribution networks are streamlining supply chains and reducing costs. Furthermore, aggressive market expansion strategies by key players, including entering emerging markets and developing localized product offerings, are creating new demand centers and fostering widespread adoption of braised food products.
Key Players Shaping the Braised Food Chain Market
- Juewei Duck Neck
- Zhou Hei Ya
- Huang Shang Huang
- Zi Yan Baiwei Chicken
- Jiujiu Ya
- Jingwu Duck Neck
- Liao Ji Bang Bang Chicken
- Lu Ren Jia
- Liu Fu Duck
Notable Milestones in Braised Food Chain Sector
- 2020 March: Juewei Duck Neck expands its product line with premium duck neck variants, focusing on unique spice blends.
- 2021 February: Zhou Hei Ya invests in new automated braising facilities to increase production capacity by 30%.
- 2022 April: Huang Shang Huang launches a nationwide e-commerce campaign, significantly boosting online sales.
- 2022 December: Zi Yan Baiwei Chicken introduces a line of healthier, reduced-sodium braised chicken products.
- 2023 May: Jiujiu Ya acquires a regional competitor, expanding its market presence in Eastern China.
- 2024 January: Jingwu Duck Neck pioneers innovative, spill-proof packaging for its on-the-go braised snacks.
In-Depth Braised Food Chain Market Outlook
The Braised Food Chain market is characterized by strong growth accelerators, including continuous technological innovation in processing and preservation, which are enhancing product quality and shelf life. Strategic partnerships across the value chain are optimizing supply chains and driving efficiency. Furthermore, ambitious market expansion strategies, particularly into developing economies and through diverse distribution channels like e-commerce and convenience stores, are fueling widespread consumer adoption. These catalysts collectively point towards a future of sustained market growth, driven by evolving consumer preferences for convenient, flavorful, and high-protein food options, and the industry's ability to adapt and innovate in response.
Braised Food Chain Segmentation
-
1. Application
- 1.1. Casual Snacks
- 1.2. Serve with Food
-
2. Type
- 2.1. Braised Chicken
- 2.2. Braised Duck
- 2.3. Others
Braised Food Chain Segmentation By Geography
-
1. North America
- 1.1. United States
- 1.2. Canada
- 1.3. Mexico
-
2. South America
- 2.1. Brazil
- 2.2. Argentina
- 2.3. Rest of South America
-
3. Europe
- 3.1. United Kingdom
- 3.2. Germany
- 3.3. France
- 3.4. Italy
- 3.5. Spain
- 3.6. Russia
- 3.7. Benelux
- 3.8. Nordics
- 3.9. Rest of Europe
-
4. Middle East & Africa
- 4.1. Turkey
- 4.2. Israel
- 4.3. GCC
- 4.4. North Africa
- 4.5. South Africa
- 4.6. Rest of Middle East & Africa
-
5. Asia Pacific
- 5.1. China
- 5.2. India
- 5.3. Japan
- 5.4. South Korea
- 5.5. ASEAN
- 5.6. Oceania
- 5.7. Rest of Asia Pacific
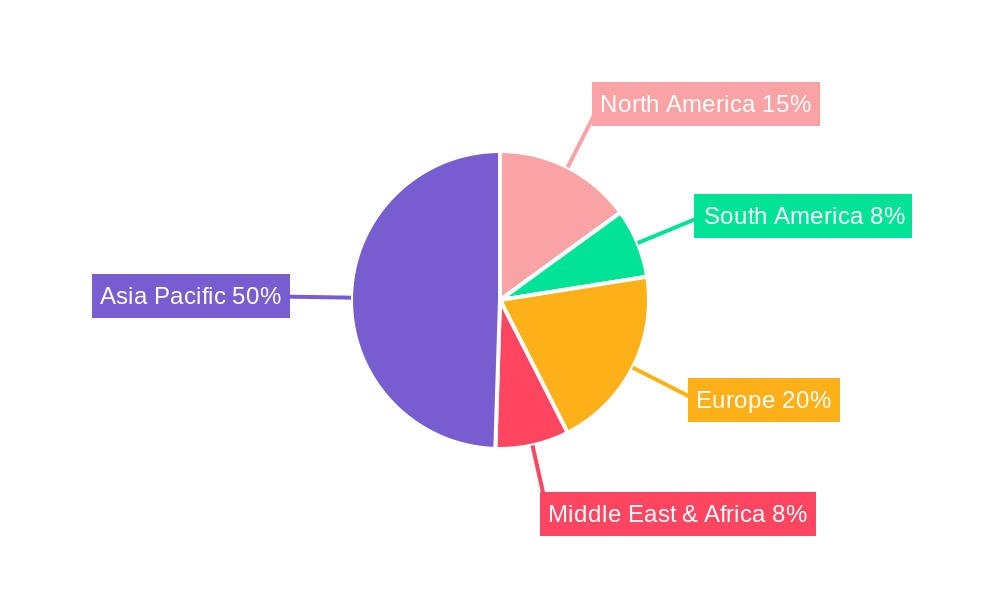
Braised Food Chain Regional Market Share
Geographic Coverage of Braised Food Chain
Braised Food Chain REPORT HIGHLIGHTS
| Aspects | Details |
|---|---|
| Study Period | 2020-2034 |
| Base Year | 2025 |
| Estimated Year | 2026 |
| Forecast Period | 2026-2034 |
| Historical Period | 2020-2025 |
| Growth Rate | CAGR of 7% from 2020-2034 |
| Segmentation |
|
Table of Contents
- 1. Introduction
- 1.1. Research Scope
- 1.2. Market Segmentation
- 1.3. Research Methodology
- 1.4. Definitions and Assumptions
- 2. Executive Summary
- 2.1. Introduction
- 3. Market Dynamics
- 3.1. Introduction
- 3.2. Market Drivers
- 3.3. Market Restrains
- 3.4. Market Trends
- 4. Market Factor Analysis
- 4.1. Porters Five Forces
- 4.2. Supply/Value Chain
- 4.3. PESTEL analysis
- 4.4. Market Entropy
- 4.5. Patent/Trademark Analysis
- 5. Global Braised Food Chain Analysis, Insights and Forecast, 2020-2032
- 5.1. Market Analysis, Insights and Forecast - by Application
- 5.1.1. Casual Snacks
- 5.1.2. Serve with Food
- 5.2. Market Analysis, Insights and Forecast - by Type
- 5.2.1. Braised Chicken
- 5.2.2. Braised Duck
- 5.2.3. Others
- 5.3. Market Analysis, Insights and Forecast - by Region
- 5.3.1. North America
- 5.3.2. South America
- 5.3.3. Europe
- 5.3.4. Middle East & Africa
- 5.3.5. Asia Pacific
- 5.1. Market Analysis, Insights and Forecast - by Application
- 6. North America Braised Food Chain Analysis, Insights and Forecast, 2020-2032
- 6.1. Market Analysis, Insights and Forecast - by Application
- 6.1.1. Casual Snacks
- 6.1.2. Serve with Food
- 6.2. Market Analysis, Insights and Forecast - by Type
- 6.2.1. Braised Chicken
- 6.2.2. Braised Duck
- 6.2.3. Others
- 6.1. Market Analysis, Insights and Forecast - by Application
- 7. South America Braised Food Chain Analysis, Insights and Forecast, 2020-2032
- 7.1. Market Analysis, Insights and Forecast - by Application
- 7.1.1. Casual Snacks
- 7.1.2. Serve with Food
- 7.2. Market Analysis, Insights and Forecast - by Type
- 7.2.1. Braised Chicken
- 7.2.2. Braised Duck
- 7.2.3. Others
- 7.1. Market Analysis, Insights and Forecast - by Application
- 8. Europe Braised Food Chain Analysis, Insights and Forecast, 2020-2032
- 8.1. Market Analysis, Insights and Forecast - by Application
- 8.1.1. Casual Snacks
- 8.1.2. Serve with Food
- 8.2. Market Analysis, Insights and Forecast - by Type
- 8.2.1. Braised Chicken
- 8.2.2. Braised Duck
- 8.2.3. Others
- 8.1. Market Analysis, Insights and Forecast - by Application
- 9. Middle East & Africa Braised Food Chain Analysis, Insights and Forecast, 2020-2032
- 9.1. Market Analysis, Insights and Forecast - by Application
- 9.1.1. Casual Snacks
- 9.1.2. Serve with Food
- 9.2. Market Analysis, Insights and Forecast - by Type
- 9.2.1. Braised Chicken
- 9.2.2. Braised Duck
- 9.2.3. Others
- 9.1. Market Analysis, Insights and Forecast - by Application
- 10. Asia Pacific Braised Food Chain Analysis, Insights and Forecast, 2020-2032
- 10.1. Market Analysis, Insights and Forecast - by Application
- 10.1.1. Casual Snacks
- 10.1.2. Serve with Food
- 10.2. Market Analysis, Insights and Forecast - by Type
- 10.2.1. Braised Chicken
- 10.2.2. Braised Duck
- 10.2.3. Others
- 10.1. Market Analysis, Insights and Forecast - by Application
- 11. Competitive Analysis
- 11.1. Global Market Share Analysis 2025
- 11.2. Company Profiles
- 11.2.1 Juewei Duck Neck
- 11.2.1.1. Overview
- 11.2.1.2. Products
- 11.2.1.3. SWOT Analysis
- 11.2.1.4. Recent Developments
- 11.2.1.5. Financials (Based on Availability)
- 11.2.2 Zhou Hei Ya
- 11.2.2.1. Overview
- 11.2.2.2. Products
- 11.2.2.3. SWOT Analysis
- 11.2.2.4. Recent Developments
- 11.2.2.5. Financials (Based on Availability)
- 11.2.3 Huang Shang Huang
- 11.2.3.1. Overview
- 11.2.3.2. Products
- 11.2.3.3. SWOT Analysis
- 11.2.3.4. Recent Developments
- 11.2.3.5. Financials (Based on Availability)
- 11.2.4 Zi Yan Baiwei Chicken
- 11.2.4.1. Overview
- 11.2.4.2. Products
- 11.2.4.3. SWOT Analysis
- 11.2.4.4. Recent Developments
- 11.2.4.5. Financials (Based on Availability)
- 11.2.5 Jiujiu Ya
- 11.2.5.1. Overview
- 11.2.5.2. Products
- 11.2.5.3. SWOT Analysis
- 11.2.5.4. Recent Developments
- 11.2.5.5. Financials (Based on Availability)
- 11.2.6 Jingwu Duck Neck
- 11.2.6.1. Overview
- 11.2.6.2. Products
- 11.2.6.3. SWOT Analysis
- 11.2.6.4. Recent Developments
- 11.2.6.5. Financials (Based on Availability)
- 11.2.7 Liao Ji Bang Bang Chicken
- 11.2.7.1. Overview
- 11.2.7.2. Products
- 11.2.7.3. SWOT Analysis
- 11.2.7.4. Recent Developments
- 11.2.7.5. Financials (Based on Availability)
- 11.2.8 Lu Ren Jia
- 11.2.8.1. Overview
- 11.2.8.2. Products
- 11.2.8.3. SWOT Analysis
- 11.2.8.4. Recent Developments
- 11.2.8.5. Financials (Based on Availability)
- 11.2.9 Liu Fu Duck
- 11.2.9.1. Overview
- 11.2.9.2. Products
- 11.2.9.3. SWOT Analysis
- 11.2.9.4. Recent Developments
- 11.2.9.5. Financials (Based on Availability)
- 11.2.1 Juewei Duck Neck
List of Figures
- Figure 1: Global Braised Food Chain Revenue Breakdown (billion, %) by Region 2025 & 2033
- Figure 2: North America Braised Food Chain Revenue (billion), by Application 2025 & 2033
- Figure 3: North America Braised Food Chain Revenue Share (%), by Application 2025 & 2033
- Figure 4: North America Braised Food Chain Revenue (billion), by Type 2025 & 2033
- Figure 5: North America Braised Food Chain Revenue Share (%), by Type 2025 & 2033
- Figure 6: North America Braised Food Chain Revenue (billion), by Country 2025 & 2033
- Figure 7: North America Braised Food Chain Revenue Share (%), by Country 2025 & 2033
- Figure 8: South America Braised Food Chain Revenue (billion), by Application 2025 & 2033
- Figure 9: South America Braised Food Chain Revenue Share (%), by Application 2025 & 2033
- Figure 10: South America Braised Food Chain Revenue (billion), by Type 2025 & 2033
- Figure 11: South America Braised Food Chain Revenue Share (%), by Type 2025 & 2033
- Figure 12: South America Braised Food Chain Revenue (billion), by Country 2025 & 2033
- Figure 13: South America Braised Food Chain Revenue Share (%), by Country 2025 & 2033
- Figure 14: Europe Braised Food Chain Revenue (billion), by Application 2025 & 2033
- Figure 15: Europe Braised Food Chain Revenue Share (%), by Application 2025 & 2033
- Figure 16: Europe Braised Food Chain Revenue (billion), by Type 2025 & 2033
- Figure 17: Europe Braised Food Chain Revenue Share (%), by Type 2025 & 2033
- Figure 18: Europe Braised Food Chain Revenue (billion), by Country 2025 & 2033
- Figure 19: Europe Braised Food Chain Revenue Share (%), by Country 2025 & 2033
- Figure 20: Middle East & Africa Braised Food Chain Revenue (billion), by Application 2025 & 2033
- Figure 21: Middle East & Africa Braised Food Chain Revenue Share (%), by Application 2025 & 2033
- Figure 22: Middle East & Africa Braised Food Chain Revenue (billion), by Type 2025 & 2033
- Figure 23: Middle East & Africa Braised Food Chain Revenue Share (%), by Type 2025 & 2033
- Figure 24: Middle East & Africa Braised Food Chain Revenue (billion), by Country 2025 & 2033
- Figure 25: Middle East & Africa Braised Food Chain Revenue Share (%), by Country 2025 & 2033
- Figure 26: Asia Pacific Braised Food Chain Revenue (billion), by Application 2025 & 2033
- Figure 27: Asia Pacific Braised Food Chain Revenue Share (%), by Application 2025 & 2033
- Figure 28: Asia Pacific Braised Food Chain Revenue (billion), by Type 2025 & 2033
- Figure 29: Asia Pacific Braised Food Chain Revenue Share (%), by Type 2025 & 2033
- Figure 30: Asia Pacific Braised Food Chain Revenue (billion), by Country 2025 & 2033
- Figure 31: Asia Pacific Braised Food Chain Revenue Share (%), by Country 2025 & 2033
List of Tables
- Table 1: Global Braised Food Chain Revenue billion Forecast, by Application 2020 & 2033
- Table 2: Global Braised Food Chain Revenue billion Forecast, by Type 2020 & 2033
- Table 3: Global Braised Food Chain Revenue billion Forecast, by Region 2020 & 2033
- Table 4: Global Braised Food Chain Revenue billion Forecast, by Application 2020 & 2033
- Table 5: Global Braised Food Chain Revenue billion Forecast, by Type 2020 & 2033
- Table 6: Global Braised Food Chain Revenue billion Forecast, by Country 2020 & 2033
- Table 7: United States Braised Food Chain Revenue (billion) Forecast, by Application 2020 & 2033
- Table 8: Canada Braised Food Chain Revenue (billion) Forecast, by Application 2020 & 2033
- Table 9: Mexico Braised Food Chain Revenue (billion) Forecast, by Application 2020 & 2033
- Table 10: Global Braised Food Chain Revenue billion Forecast, by Application 2020 & 2033
- Table 11: Global Braised Food Chain Revenue billion Forecast, by Type 2020 & 2033
- Table 12: Global Braised Food Chain Revenue billion Forecast, by Country 2020 & 2033
- Table 13: Brazil Braised Food Chain Revenue (billion) Forecast, by Application 2020 & 2033
- Table 14: Argentina Braised Food Chain Revenue (billion) Forecast, by Application 2020 & 2033
- Table 15: Rest of South America Braised Food Chain Revenue (billion) Forecast, by Application 2020 & 2033
- Table 16: Global Braised Food Chain Revenue billion Forecast, by Application 2020 & 2033
- Table 17: Global Braised Food Chain Revenue billion Forecast, by Type 2020 & 2033
- Table 18: Global Braised Food Chain Revenue billion Forecast, by Country 2020 & 2033
- Table 19: United Kingdom Braised Food Chain Revenue (billion) Forecast, by Application 2020 & 2033
- Table 20: Germany Braised Food Chain Revenue (billion) Forecast, by Application 2020 & 2033
- Table 21: France Braised Food Chain Revenue (billion) Forecast, by Application 2020 & 2033
- Table 22: Italy Braised Food Chain Revenue (billion) Forecast, by Application 2020 & 2033
- Table 23: Spain Braised Food Chain Revenue (billion) Forecast, by Application 2020 & 2033
- Table 24: Russia Braised Food Chain Revenue (billion) Forecast, by Application 2020 & 2033
- Table 25: Benelux Braised Food Chain Revenue (billion) Forecast, by Application 2020 & 2033
- Table 26: Nordics Braised Food Chain Revenue (billion) Forecast, by Application 2020 & 2033
- Table 27: Rest of Europe Braised Food Chain Revenue (billion) Forecast, by Application 2020 & 2033
- Table 28: Global Braised Food Chain Revenue billion Forecast, by Application 2020 & 2033
- Table 29: Global Braised Food Chain Revenue billion Forecast, by Type 2020 & 2033
- Table 30: Global Braised Food Chain Revenue billion Forecast, by Country 2020 & 2033
- Table 31: Turkey Braised Food Chain Revenue (billion) Forecast, by Application 2020 & 2033
- Table 32: Israel Braised Food Chain Revenue (billion) Forecast, by Application 2020 & 2033
- Table 33: GCC Braised Food Chain Revenue (billion) Forecast, by Application 2020 & 2033
- Table 34: North Africa Braised Food Chain Revenue (billion) Forecast, by Application 2020 & 2033
- Table 35: South Africa Braised Food Chain Revenue (billion) Forecast, by Application 2020 & 2033
- Table 36: Rest of Middle East & Africa Braised Food Chain Revenue (billion) Forecast, by Application 2020 & 2033
- Table 37: Global Braised Food Chain Revenue billion Forecast, by Application 2020 & 2033
- Table 38: Global Braised Food Chain Revenue billion Forecast, by Type 2020 & 2033
- Table 39: Global Braised Food Chain Revenue billion Forecast, by Country 2020 & 2033
- Table 40: China Braised Food Chain Revenue (billion) Forecast, by Application 2020 & 2033
- Table 41: India Braised Food Chain Revenue (billion) Forecast, by Application 2020 & 2033
- Table 42: Japan Braised Food Chain Revenue (billion) Forecast, by Application 2020 & 2033
- Table 43: South Korea Braised Food Chain Revenue (billion) Forecast, by Application 2020 & 2033
- Table 44: ASEAN Braised Food Chain Revenue (billion) Forecast, by Application 2020 & 2033
- Table 45: Oceania Braised Food Chain Revenue (billion) Forecast, by Application 2020 & 2033
- Table 46: Rest of Asia Pacific Braised Food Chain Revenue (billion) Forecast, by Application 2020 & 2033
Frequently Asked Questions
1. What is the projected Compound Annual Growth Rate (CAGR) of the Braised Food Chain?
The projected CAGR is approximately 7%.
2. Which companies are prominent players in the Braised Food Chain?
Key companies in the market include Juewei Duck Neck, Zhou Hei Ya, Huang Shang Huang, Zi Yan Baiwei Chicken, Jiujiu Ya, Jingwu Duck Neck, Liao Ji Bang Bang Chicken, Lu Ren Jia, Liu Fu Duck.
3. What are the main segments of the Braised Food Chain?
The market segments include Application, Type.
4. Can you provide details about the market size?
The market size is estimated to be USD 15 billion as of 2022.
5. What are some drivers contributing to market growth?
N/A
6. What are the notable trends driving market growth?
N/A
7. Are there any restraints impacting market growth?
N/A
8. Can you provide examples of recent developments in the market?
N/A
9. What pricing options are available for accessing the report?
Pricing options include single-user, multi-user, and enterprise licenses priced at USD 3950.00, USD 5925.00, and USD 7900.00 respectively.
10. Is the market size provided in terms of value or volume?
The market size is provided in terms of value, measured in billion.
11. Are there any specific market keywords associated with the report?
Yes, the market keyword associated with the report is "Braised Food Chain," which aids in identifying and referencing the specific market segment covered.
12. How do I determine which pricing option suits my needs best?
The pricing options vary based on user requirements and access needs. Individual users may opt for single-user licenses, while businesses requiring broader access may choose multi-user or enterprise licenses for cost-effective access to the report.
13. Are there any additional resources or data provided in the Braised Food Chain report?
While the report offers comprehensive insights, it's advisable to review the specific contents or supplementary materials provided to ascertain if additional resources or data are available.
14. How can I stay updated on further developments or reports in the Braised Food Chain?
To stay informed about further developments, trends, and reports in the Braised Food Chain, consider subscribing to industry newsletters, following relevant companies and organizations, or regularly checking reputable industry news sources and publications.
Methodology
Step 1 - Identification of Relevant Samples Size from Population Database


Step 2 - Approaches for Defining Global Market Size (Value, Volume* & Price*)

Note*: In applicable scenarios
Step 3 - Data Sources
Primary Research
- Web Analytics
- Survey Reports
- Research Institute
- Latest Research Reports
- Opinion Leaders
Secondary Research
- Annual Reports
- White Paper
- Latest Press Release
- Industry Association
- Paid Database
- Investor Presentations

Step 4 - Data Triangulation
Involves using different sources of information in order to increase the validity of a study
These sources are likely to be stakeholders in a program - participants, other researchers, program staff, other community members, and so on.
Then we put all data in single framework & apply various statistical tools to find out the dynamic on the market.
During the analysis stage, feedback from the stakeholder groups would be compared to determine areas of agreement as well as areas of divergence