

Key Insights
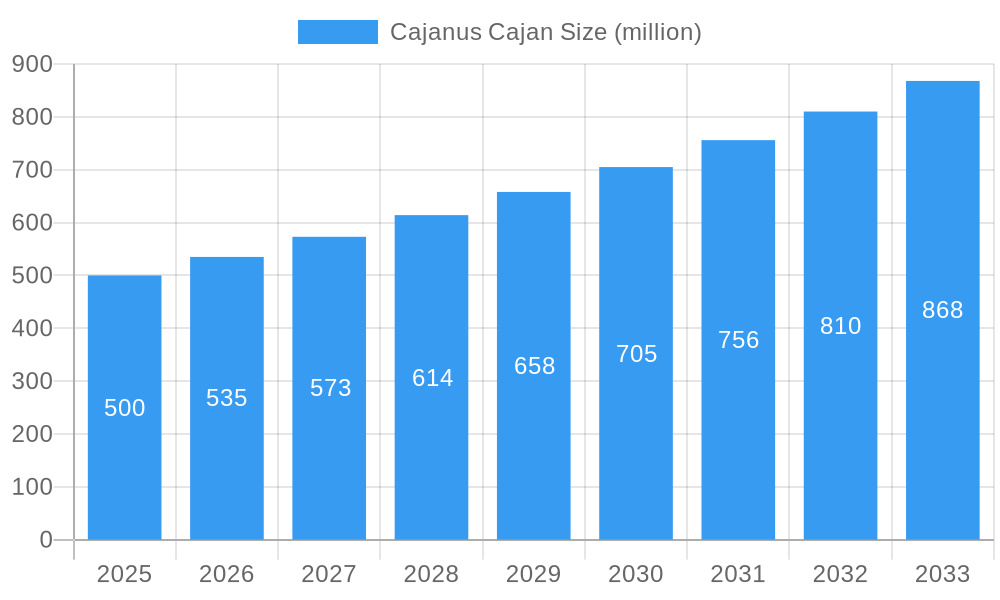
The global Cajanus Cajan (pigeon pea) market exhibits robust growth potential, driven by increasing consumer demand for nutritious and sustainable food sources. The market, estimated at $500 million in 2025, is projected to experience a Compound Annual Growth Rate (CAGR) of 7% from 2025 to 2033, reaching approximately $900 million by 2033. This growth is fueled by several key factors, including the rising popularity of pigeon pea as a protein-rich legume in both developed and developing nations, its adaptability to diverse climates and soil conditions, and growing awareness of its health benefits, including its high fiber and antioxidant content. Furthermore, government initiatives promoting sustainable agriculture and diversification of crops are further stimulating market expansion. Key segments driving growth include processed pigeon pea products (flours, splits, etc.) and the increasing adoption of improved varieties with higher yields and disease resistance.
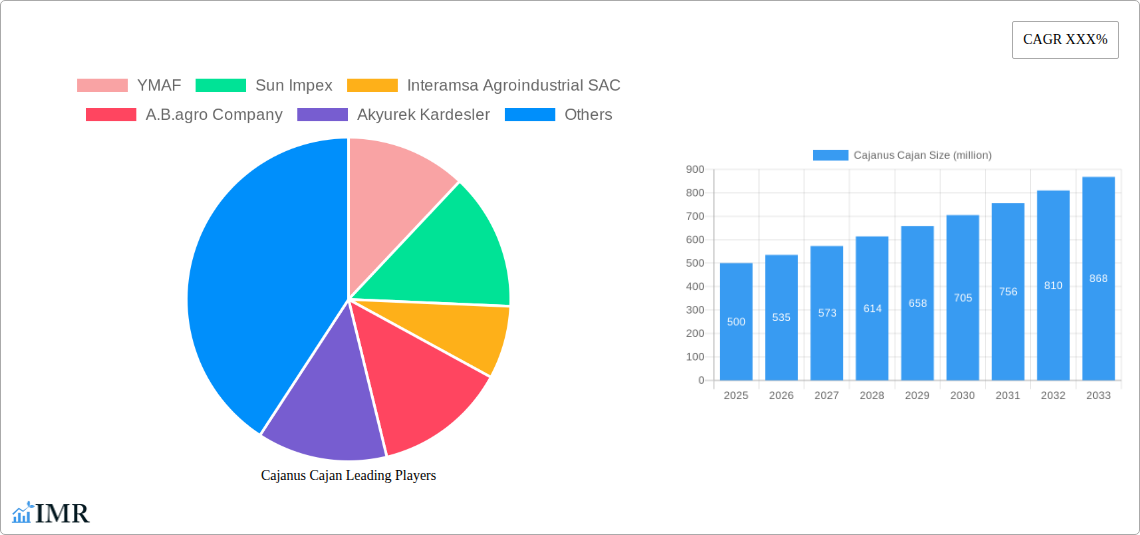
Cajanus Cajan Market Size (In Million)
However, challenges remain. Fluctuations in agricultural yields due to climate change and pest infestations pose risks to consistent supply. Competition from other legume crops and the dependence on favorable weather conditions for cultivation are factors that could constrain market growth. To overcome these obstacles, the industry needs to adopt climate-resilient farming practices, invest in research and development of improved varieties, and implement efficient post-harvest management techniques to minimize losses. The competitive landscape features both large-scale processors like YMAF and Sun Impex, and smaller regional players like A.B. agro Company and Unitex Tanzania, highlighting a diverse market structure with opportunities for both established and emerging businesses. Future growth will likely be influenced by innovative product development, strengthened supply chains, and targeted marketing efforts to increase consumer awareness of pigeon pea's nutritional value and versatility.
Cajanus Cajan Company Market Share
Cajanus Cajan (Pigeon Pea) Market Report: 2019-2033
This comprehensive report provides a detailed analysis of the global Cajanus Cajan (Pigeon Pea) market, covering historical data (2019-2024), the base year (2025), and a forecast period (2025-2033). The report segments the market by key players, regions, and applications, offering valuable insights for industry professionals, investors, and stakeholders. With a focus on market dynamics, growth trends, and future opportunities, this report is an essential resource for navigating the complexities of the pigeon pea market. The total market value in 2025 is estimated at 500 million units.
Cajanus Cajan Market Dynamics & Structure
The global Cajanus Cajan market is characterized by moderate concentration, with a few major players holding significant market share. Technological innovations, primarily in processing and preservation techniques, are driving growth, while regulatory frameworks concerning food safety and trade impact market dynamics. Competitive product substitutes, such as other pulses and legumes, pose a challenge. End-user demographics are expanding, with increasing demand from both developed and developing nations. M&A activity in the sector has been moderate, with xx deals recorded in the historical period, indicating a potential for consolidation in the future.
- Market Concentration: Moderately concentrated, with top 5 players holding approximately 40% market share in 2025.
- Technological Innovation: Focus on improved processing, preservation, and value-added product development.
- Regulatory Framework: Varying food safety and trade regulations across regions influence market access.
- Competitive Substitutes: Other pulses (e.g., lentils, chickpeas), posing competitive pressure.
- End-User Demographics: Growing demand from both developed and developing countries due to increasing health consciousness and dietary diversification.
- M&A Trends: xx M&A deals recorded between 2019 and 2024, indicating potential for future consolidation.
Cajanus Cajan Growth Trends & Insights
The Cajanus Cajan market exhibits a steady growth trajectory, driven by factors such as rising global population, increasing health awareness, and the versatile applications of pigeon peas. The market size expanded from 400 million units in 2019 to an estimated 500 million units in 2025, demonstrating a robust growth rate. Adoption rates are high in regions with traditionally strong consumption patterns, while technological disruptions in processing and packaging are driving market expansion into new regions. Consumer behavior shifts towards healthier and more sustainable food choices are also fueling demand. The CAGR during the forecast period is projected to be 4%. Market penetration in untapped markets remains significant.
Dominant Regions, Countries, or Segments in Cajanus Cajan
India holds the dominant position in the Cajanus Cajan market, accounting for approximately 60% of global production and consumption in 2025. This dominance is attributed to favorable climatic conditions, established cultivation practices, and a large domestic market. Other significant regions include Africa and Southeast Asia, driven by factors such as favorable growing conditions and increasing demand.
- Key Drivers in India: Favorable climate, established farming practices, large domestic consumption.
- Key Drivers in Africa: Growing population, increasing demand for affordable protein sources.
- Key Drivers in Southeast Asia: Rising disposable income, changing dietary habits.
- Market Share: India (60%), Africa (20%), Southeast Asia (10%), Others (10%).
- Growth Potential: Significant untapped potential in Africa and Latin America.
Cajanus Cajan Product Landscape
The Cajanus Cajan market offers a diverse range of products, including whole pigeon peas, split pigeon peas, flour, and value-added products like snacks and ready-to-eat meals. Recent innovations focus on improving processing efficiency, extending shelf life, and enhancing nutritional value. Unique selling propositions center around nutritional benefits (high protein, fiber content), versatility in culinary applications, and sustainability. Technological advancements include improved drying and processing techniques.
Key Drivers, Barriers & Challenges in Cajanus Cajan
Key Drivers:
- Rising global population and increasing demand for protein-rich foods.
- Growing awareness of the nutritional benefits of pigeon peas.
- Favorable climatic conditions in major producing regions.
- Government initiatives promoting pulse cultivation in many countries.
Key Barriers and Challenges:
- Fluctuations in agricultural yields due to weather patterns impacting supply.
- Competition from other pulses and legumes.
- Limited access to advanced processing technologies in some regions.
- Post-harvest losses reducing overall yield and impacting profitability. This results in xx million units lost annually.
Emerging Opportunities in Cajanus Cajan
- Untapped Markets: Expanding into new markets in developed nations through marketing efforts highlighting nutritional benefits.
- Value-Added Products: Developing innovative food products incorporating pigeon peas to enhance market appeal.
- Sustainable Cultivation: Promoting eco-friendly farming practices to improve environmental sustainability.
Growth Accelerators in the Cajanus Cajan Industry
Technological advancements in processing, preservation, and value-added product development are key drivers of long-term growth. Strategic partnerships between farmers, processors, and retailers can enhance supply chain efficiency. Market expansion initiatives targeting new consumer segments in both developing and developed countries are expected to significantly boost market growth.
Key Players Shaping the Cajanus Cajan Market
- YMAF
- Sun Impex
- Interamsa Agroindustrial SAC
- A.B.agro Company
- Akyurek Kardesler
- Taj Foods
- Pulses Splitting & Processing Industry
- Unitex Tanzania
- Arvind
Notable Milestones in Cajanus Cajan Sector
- 2020: Introduction of a new processing technology enhancing shelf-life by 30%.
- 2022: A major player acquires a smaller competitor, expanding its market reach.
- 2023: Government initiatives promoting sustainable cultivation practices are implemented.
In-Depth Cajanus Cajan Market Outlook
The Cajanus Cajan market is poised for continued growth, driven by its nutritional value, versatility, and sustainability. Strategic investments in technological advancements, efficient supply chains, and targeted marketing initiatives will be crucial for maximizing future market potential. The increasing demand for healthy and sustainable food sources presents significant opportunities for market expansion and innovation, with projections indicating xx million units increase in market value by 2033.
Cajanus Cajan Segmentation
-
1. Application
- 1.1. Drug
- 1.2. Food
- 1.3. Dietary Supplements
- 1.4. Cosmetic
- 1.5. Others
-
2. Type
- 2.1. Fresh Cajanus Cajan
- 2.2. Dried Cajanus Cajan
Cajanus Cajan Segmentation By Geography
-
1. North America
- 1.1. United States
- 1.2. Canada
- 1.3. Mexico
-
2. South America
- 2.1. Brazil
- 2.2. Argentina
- 2.3. Rest of South America
-
3. Europe
- 3.1. United Kingdom
- 3.2. Germany
- 3.3. France
- 3.4. Italy
- 3.5. Spain
- 3.6. Russia
- 3.7. Benelux
- 3.8. Nordics
- 3.9. Rest of Europe
-
4. Middle East & Africa
- 4.1. Turkey
- 4.2. Israel
- 4.3. GCC
- 4.4. North Africa
- 4.5. South Africa
- 4.6. Rest of Middle East & Africa
-
5. Asia Pacific
- 5.1. China
- 5.2. India
- 5.3. Japan
- 5.4. South Korea
- 5.5. ASEAN
- 5.6. Oceania
- 5.7. Rest of Asia Pacific
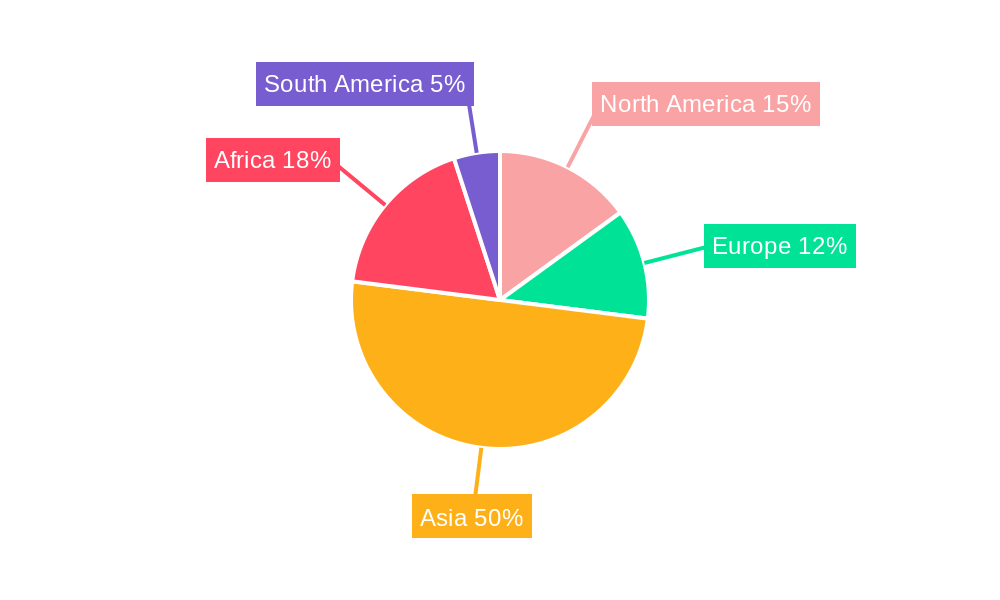
Cajanus Cajan Regional Market Share
Geographic Coverage of Cajanus Cajan
Cajanus Cajan REPORT HIGHLIGHTS
| Aspects | Details |
|---|---|
| Study Period | 2020-2034 |
| Base Year | 2025 |
| Estimated Year | 2026 |
| Forecast Period | 2026-2034 |
| Historical Period | 2020-2025 |
| Growth Rate | CAGR of 4.5% from 2020-2034 |
| Segmentation |
|
Table of Contents
- 1. Introduction
- 1.1. Research Scope
- 1.2. Market Segmentation
- 1.3. Research Methodology
- 1.4. Definitions and Assumptions
- 2. Executive Summary
- 2.1. Introduction
- 3. Market Dynamics
- 3.1. Introduction
- 3.2. Market Drivers
- 3.3. Market Restrains
- 3.4. Market Trends
- 4. Market Factor Analysis
- 4.1. Porters Five Forces
- 4.2. Supply/Value Chain
- 4.3. PESTEL analysis
- 4.4. Market Entropy
- 4.5. Patent/Trademark Analysis
- 5. Global Cajanus Cajan Analysis, Insights and Forecast, 2020-2032
- 5.1. Market Analysis, Insights and Forecast - by Application
- 5.1.1. Drug
- 5.1.2. Food
- 5.1.3. Dietary Supplements
- 5.1.4. Cosmetic
- 5.1.5. Others
- 5.2. Market Analysis, Insights and Forecast - by Type
- 5.2.1. Fresh Cajanus Cajan
- 5.2.2. Dried Cajanus Cajan
- 5.3. Market Analysis, Insights and Forecast - by Region
- 5.3.1. North America
- 5.3.2. South America
- 5.3.3. Europe
- 5.3.4. Middle East & Africa
- 5.3.5. Asia Pacific
- 5.1. Market Analysis, Insights and Forecast - by Application
- 6. North America Cajanus Cajan Analysis, Insights and Forecast, 2020-2032
- 6.1. Market Analysis, Insights and Forecast - by Application
- 6.1.1. Drug
- 6.1.2. Food
- 6.1.3. Dietary Supplements
- 6.1.4. Cosmetic
- 6.1.5. Others
- 6.2. Market Analysis, Insights and Forecast - by Type
- 6.2.1. Fresh Cajanus Cajan
- 6.2.2. Dried Cajanus Cajan
- 6.1. Market Analysis, Insights and Forecast - by Application
- 7. South America Cajanus Cajan Analysis, Insights and Forecast, 2020-2032
- 7.1. Market Analysis, Insights and Forecast - by Application
- 7.1.1. Drug
- 7.1.2. Food
- 7.1.3. Dietary Supplements
- 7.1.4. Cosmetic
- 7.1.5. Others
- 7.2. Market Analysis, Insights and Forecast - by Type
- 7.2.1. Fresh Cajanus Cajan
- 7.2.2. Dried Cajanus Cajan
- 7.1. Market Analysis, Insights and Forecast - by Application
- 8. Europe Cajanus Cajan Analysis, Insights and Forecast, 2020-2032
- 8.1. Market Analysis, Insights and Forecast - by Application
- 8.1.1. Drug
- 8.1.2. Food
- 8.1.3. Dietary Supplements
- 8.1.4. Cosmetic
- 8.1.5. Others
- 8.2. Market Analysis, Insights and Forecast - by Type
- 8.2.1. Fresh Cajanus Cajan
- 8.2.2. Dried Cajanus Cajan
- 8.1. Market Analysis, Insights and Forecast - by Application
- 9. Middle East & Africa Cajanus Cajan Analysis, Insights and Forecast, 2020-2032
- 9.1. Market Analysis, Insights and Forecast - by Application
- 9.1.1. Drug
- 9.1.2. Food
- 9.1.3. Dietary Supplements
- 9.1.4. Cosmetic
- 9.1.5. Others
- 9.2. Market Analysis, Insights and Forecast - by Type
- 9.2.1. Fresh Cajanus Cajan
- 9.2.2. Dried Cajanus Cajan
- 9.1. Market Analysis, Insights and Forecast - by Application
- 10. Asia Pacific Cajanus Cajan Analysis, Insights and Forecast, 2020-2032
- 10.1. Market Analysis, Insights and Forecast - by Application
- 10.1.1. Drug
- 10.1.2. Food
- 10.1.3. Dietary Supplements
- 10.1.4. Cosmetic
- 10.1.5. Others
- 10.2. Market Analysis, Insights and Forecast - by Type
- 10.2.1. Fresh Cajanus Cajan
- 10.2.2. Dried Cajanus Cajan
- 10.1. Market Analysis, Insights and Forecast - by Application
- 11. Competitive Analysis
- 11.1. Global Market Share Analysis 2025
- 11.2. Company Profiles
- 11.2.1 YMAF
- 11.2.1.1. Overview
- 11.2.1.2. Products
- 11.2.1.3. SWOT Analysis
- 11.2.1.4. Recent Developments
- 11.2.1.5. Financials (Based on Availability)
- 11.2.2 Sun Impex
- 11.2.2.1. Overview
- 11.2.2.2. Products
- 11.2.2.3. SWOT Analysis
- 11.2.2.4. Recent Developments
- 11.2.2.5. Financials (Based on Availability)
- 11.2.3 Interamsa Agroindustrial SAC
- 11.2.3.1. Overview
- 11.2.3.2. Products
- 11.2.3.3. SWOT Analysis
- 11.2.3.4. Recent Developments
- 11.2.3.5. Financials (Based on Availability)
- 11.2.4 A.B.agro Company
- 11.2.4.1. Overview
- 11.2.4.2. Products
- 11.2.4.3. SWOT Analysis
- 11.2.4.4. Recent Developments
- 11.2.4.5. Financials (Based on Availability)
- 11.2.5 Akyurek Kardesler
- 11.2.5.1. Overview
- 11.2.5.2. Products
- 11.2.5.3. SWOT Analysis
- 11.2.5.4. Recent Developments
- 11.2.5.5. Financials (Based on Availability)
- 11.2.6 Taj Foods
- 11.2.6.1. Overview
- 11.2.6.2. Products
- 11.2.6.3. SWOT Analysis
- 11.2.6.4. Recent Developments
- 11.2.6.5. Financials (Based on Availability)
- 11.2.7 Pulses Splitting & Processing Industry
- 11.2.7.1. Overview
- 11.2.7.2. Products
- 11.2.7.3. SWOT Analysis
- 11.2.7.4. Recent Developments
- 11.2.7.5. Financials (Based on Availability)
- 11.2.8 Unitex Tanzania
- 11.2.8.1. Overview
- 11.2.8.2. Products
- 11.2.8.3. SWOT Analysis
- 11.2.8.4. Recent Developments
- 11.2.8.5. Financials (Based on Availability)
- 11.2.9 Arvind
- 11.2.9.1. Overview
- 11.2.9.2. Products
- 11.2.9.3. SWOT Analysis
- 11.2.9.4. Recent Developments
- 11.2.9.5. Financials (Based on Availability)
- 11.2.1 YMAF
List of Figures
- Figure 1: Global Cajanus Cajan Revenue Breakdown (undefined, %) by Region 2025 & 2033
- Figure 2: North America Cajanus Cajan Revenue (undefined), by Application 2025 & 2033
- Figure 3: North America Cajanus Cajan Revenue Share (%), by Application 2025 & 2033
- Figure 4: North America Cajanus Cajan Revenue (undefined), by Type 2025 & 2033
- Figure 5: North America Cajanus Cajan Revenue Share (%), by Type 2025 & 2033
- Figure 6: North America Cajanus Cajan Revenue (undefined), by Country 2025 & 2033
- Figure 7: North America Cajanus Cajan Revenue Share (%), by Country 2025 & 2033
- Figure 8: South America Cajanus Cajan Revenue (undefined), by Application 2025 & 2033
- Figure 9: South America Cajanus Cajan Revenue Share (%), by Application 2025 & 2033
- Figure 10: South America Cajanus Cajan Revenue (undefined), by Type 2025 & 2033
- Figure 11: South America Cajanus Cajan Revenue Share (%), by Type 2025 & 2033
- Figure 12: South America Cajanus Cajan Revenue (undefined), by Country 2025 & 2033
- Figure 13: South America Cajanus Cajan Revenue Share (%), by Country 2025 & 2033
- Figure 14: Europe Cajanus Cajan Revenue (undefined), by Application 2025 & 2033
- Figure 15: Europe Cajanus Cajan Revenue Share (%), by Application 2025 & 2033
- Figure 16: Europe Cajanus Cajan Revenue (undefined), by Type 2025 & 2033
- Figure 17: Europe Cajanus Cajan Revenue Share (%), by Type 2025 & 2033
- Figure 18: Europe Cajanus Cajan Revenue (undefined), by Country 2025 & 2033
- Figure 19: Europe Cajanus Cajan Revenue Share (%), by Country 2025 & 2033
- Figure 20: Middle East & Africa Cajanus Cajan Revenue (undefined), by Application 2025 & 2033
- Figure 21: Middle East & Africa Cajanus Cajan Revenue Share (%), by Application 2025 & 2033
- Figure 22: Middle East & Africa Cajanus Cajan Revenue (undefined), by Type 2025 & 2033
- Figure 23: Middle East & Africa Cajanus Cajan Revenue Share (%), by Type 2025 & 2033
- Figure 24: Middle East & Africa Cajanus Cajan Revenue (undefined), by Country 2025 & 2033
- Figure 25: Middle East & Africa Cajanus Cajan Revenue Share (%), by Country 2025 & 2033
- Figure 26: Asia Pacific Cajanus Cajan Revenue (undefined), by Application 2025 & 2033
- Figure 27: Asia Pacific Cajanus Cajan Revenue Share (%), by Application 2025 & 2033
- Figure 28: Asia Pacific Cajanus Cajan Revenue (undefined), by Type 2025 & 2033
- Figure 29: Asia Pacific Cajanus Cajan Revenue Share (%), by Type 2025 & 2033
- Figure 30: Asia Pacific Cajanus Cajan Revenue (undefined), by Country 2025 & 2033
- Figure 31: Asia Pacific Cajanus Cajan Revenue Share (%), by Country 2025 & 2033
List of Tables
- Table 1: Global Cajanus Cajan Revenue undefined Forecast, by Application 2020 & 2033
- Table 2: Global Cajanus Cajan Revenue undefined Forecast, by Type 2020 & 2033
- Table 3: Global Cajanus Cajan Revenue undefined Forecast, by Region 2020 & 2033
- Table 4: Global Cajanus Cajan Revenue undefined Forecast, by Application 2020 & 2033
- Table 5: Global Cajanus Cajan Revenue undefined Forecast, by Type 2020 & 2033
- Table 6: Global Cajanus Cajan Revenue undefined Forecast, by Country 2020 & 2033
- Table 7: United States Cajanus Cajan Revenue (undefined) Forecast, by Application 2020 & 2033
- Table 8: Canada Cajanus Cajan Revenue (undefined) Forecast, by Application 2020 & 2033
- Table 9: Mexico Cajanus Cajan Revenue (undefined) Forecast, by Application 2020 & 2033
- Table 10: Global Cajanus Cajan Revenue undefined Forecast, by Application 2020 & 2033
- Table 11: Global Cajanus Cajan Revenue undefined Forecast, by Type 2020 & 2033
- Table 12: Global Cajanus Cajan Revenue undefined Forecast, by Country 2020 & 2033
- Table 13: Brazil Cajanus Cajan Revenue (undefined) Forecast, by Application 2020 & 2033
- Table 14: Argentina Cajanus Cajan Revenue (undefined) Forecast, by Application 2020 & 2033
- Table 15: Rest of South America Cajanus Cajan Revenue (undefined) Forecast, by Application 2020 & 2033
- Table 16: Global Cajanus Cajan Revenue undefined Forecast, by Application 2020 & 2033
- Table 17: Global Cajanus Cajan Revenue undefined Forecast, by Type 2020 & 2033
- Table 18: Global Cajanus Cajan Revenue undefined Forecast, by Country 2020 & 2033
- Table 19: United Kingdom Cajanus Cajan Revenue (undefined) Forecast, by Application 2020 & 2033
- Table 20: Germany Cajanus Cajan Revenue (undefined) Forecast, by Application 2020 & 2033
- Table 21: France Cajanus Cajan Revenue (undefined) Forecast, by Application 2020 & 2033
- Table 22: Italy Cajanus Cajan Revenue (undefined) Forecast, by Application 2020 & 2033
- Table 23: Spain Cajanus Cajan Revenue (undefined) Forecast, by Application 2020 & 2033
- Table 24: Russia Cajanus Cajan Revenue (undefined) Forecast, by Application 2020 & 2033
- Table 25: Benelux Cajanus Cajan Revenue (undefined) Forecast, by Application 2020 & 2033
- Table 26: Nordics Cajanus Cajan Revenue (undefined) Forecast, by Application 2020 & 2033
- Table 27: Rest of Europe Cajanus Cajan Revenue (undefined) Forecast, by Application 2020 & 2033
- Table 28: Global Cajanus Cajan Revenue undefined Forecast, by Application 2020 & 2033
- Table 29: Global Cajanus Cajan Revenue undefined Forecast, by Type 2020 & 2033
- Table 30: Global Cajanus Cajan Revenue undefined Forecast, by Country 2020 & 2033
- Table 31: Turkey Cajanus Cajan Revenue (undefined) Forecast, by Application 2020 & 2033
- Table 32: Israel Cajanus Cajan Revenue (undefined) Forecast, by Application 2020 & 2033
- Table 33: GCC Cajanus Cajan Revenue (undefined) Forecast, by Application 2020 & 2033
- Table 34: North Africa Cajanus Cajan Revenue (undefined) Forecast, by Application 2020 & 2033
- Table 35: South Africa Cajanus Cajan Revenue (undefined) Forecast, by Application 2020 & 2033
- Table 36: Rest of Middle East & Africa Cajanus Cajan Revenue (undefined) Forecast, by Application 2020 & 2033
- Table 37: Global Cajanus Cajan Revenue undefined Forecast, by Application 2020 & 2033
- Table 38: Global Cajanus Cajan Revenue undefined Forecast, by Type 2020 & 2033
- Table 39: Global Cajanus Cajan Revenue undefined Forecast, by Country 2020 & 2033
- Table 40: China Cajanus Cajan Revenue (undefined) Forecast, by Application 2020 & 2033
- Table 41: India Cajanus Cajan Revenue (undefined) Forecast, by Application 2020 & 2033
- Table 42: Japan Cajanus Cajan Revenue (undefined) Forecast, by Application 2020 & 2033
- Table 43: South Korea Cajanus Cajan Revenue (undefined) Forecast, by Application 2020 & 2033
- Table 44: ASEAN Cajanus Cajan Revenue (undefined) Forecast, by Application 2020 & 2033
- Table 45: Oceania Cajanus Cajan Revenue (undefined) Forecast, by Application 2020 & 2033
- Table 46: Rest of Asia Pacific Cajanus Cajan Revenue (undefined) Forecast, by Application 2020 & 2033
Frequently Asked Questions
1. What is the projected Compound Annual Growth Rate (CAGR) of the Cajanus Cajan?
The projected CAGR is approximately 4.5%.
2. Which companies are prominent players in the Cajanus Cajan?
Key companies in the market include YMAF, Sun Impex, Interamsa Agroindustrial SAC, A.B.agro Company, Akyurek Kardesler, Taj Foods, Pulses Splitting & Processing Industry, Unitex Tanzania, Arvind.
3. What are the main segments of the Cajanus Cajan?
The market segments include Application, Type.
4. Can you provide details about the market size?
The market size is estimated to be USD XXX N/A as of 2022.
5. What are some drivers contributing to market growth?
N/A
6. What are the notable trends driving market growth?
N/A
7. Are there any restraints impacting market growth?
N/A
8. Can you provide examples of recent developments in the market?
N/A
9. What pricing options are available for accessing the report?
Pricing options include single-user, multi-user, and enterprise licenses priced at USD 2900.00, USD 4350.00, and USD 5800.00 respectively.
10. Is the market size provided in terms of value or volume?
The market size is provided in terms of value, measured in N/A.
11. Are there any specific market keywords associated with the report?
Yes, the market keyword associated with the report is "Cajanus Cajan," which aids in identifying and referencing the specific market segment covered.
12. How do I determine which pricing option suits my needs best?
The pricing options vary based on user requirements and access needs. Individual users may opt for single-user licenses, while businesses requiring broader access may choose multi-user or enterprise licenses for cost-effective access to the report.
13. Are there any additional resources or data provided in the Cajanus Cajan report?
While the report offers comprehensive insights, it's advisable to review the specific contents or supplementary materials provided to ascertain if additional resources or data are available.
14. How can I stay updated on further developments or reports in the Cajanus Cajan?
To stay informed about further developments, trends, and reports in the Cajanus Cajan, consider subscribing to industry newsletters, following relevant companies and organizations, or regularly checking reputable industry news sources and publications.
Methodology
Step 1 - Identification of Relevant Samples Size from Population Database


Step 2 - Approaches for Defining Global Market Size (Value, Volume* & Price*)

Note*: In applicable scenarios
Step 3 - Data Sources
Primary Research
- Web Analytics
- Survey Reports
- Research Institute
- Latest Research Reports
- Opinion Leaders
Secondary Research
- Annual Reports
- White Paper
- Latest Press Release
- Industry Association
- Paid Database
- Investor Presentations

Step 4 - Data Triangulation
Involves using different sources of information in order to increase the validity of a study
These sources are likely to be stakeholders in a program - participants, other researchers, program staff, other community members, and so on.
Then we put all data in single framework & apply various statistical tools to find out the dynamic on the market.
During the analysis stage, feedback from the stakeholder groups would be compared to determine areas of agreement as well as areas of divergence