

Key Insights
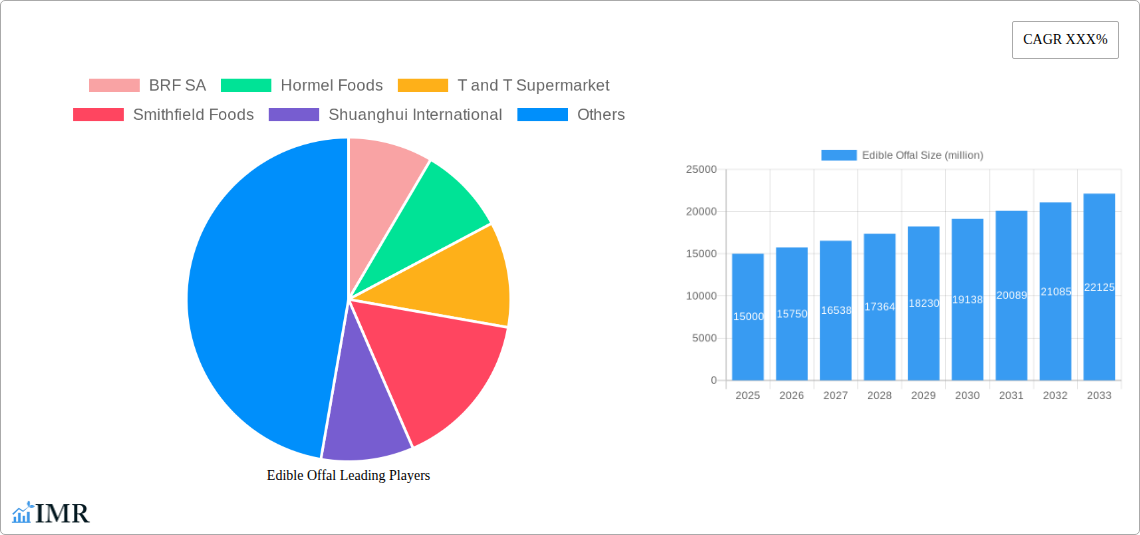
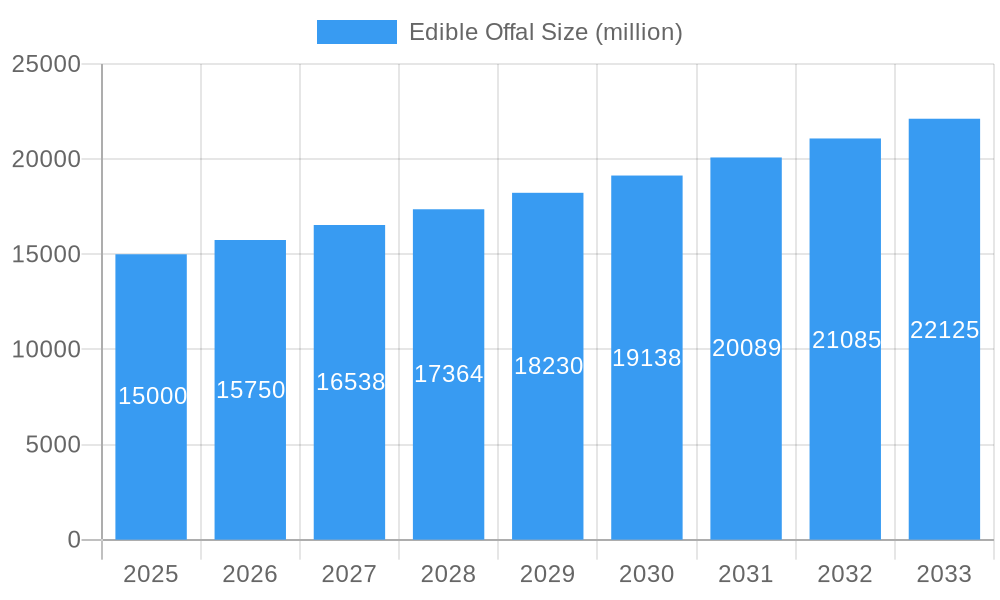
The global edible offal market is experiencing robust growth, driven by increasing consumer awareness of its nutritional benefits and cost-effectiveness compared to other protein sources. This market, estimated at $15 billion in 2025, is projected to grow at a Compound Annual Growth Rate (CAGR) of 5% from 2025 to 2033, reaching approximately $23 billion by 2033. Key drivers include rising demand for affordable protein sources in developing economies, the growing popularity of offal-based dishes in various cuisines, and the increasing focus on minimizing food waste within the meat processing industry. Furthermore, innovative food processing techniques are making offal more palatable and appealing to a wider consumer base. While some regional variations exist, North America and Europe currently dominate the market, with Asia-Pacific poised for significant growth due to changing dietary preferences and rising disposable incomes. Challenges include overcoming consumer perceptions associated with offal, ensuring consistent product quality and safety, and managing supply chain efficiencies. Major players such as BRF SA, Hormel Foods, and Tyson Foods are actively investing in research and development, expanding their product portfolios, and exploring new markets to capitalize on the growing opportunities within this dynamic sector.
Edible Offal Market Size (In Billion)
The market segmentation includes various types of edible offal (liver, kidney, heart, etc.), categorized by processing methods (fresh, frozen, processed), and distribution channels (retail, foodservice). The competitive landscape is relatively fragmented, with both large multinational corporations and smaller regional players vying for market share. Strategic partnerships, acquisitions, and product innovation are common strategies used to gain a competitive edge. While the market faces challenges in terms of consumer perception and regulatory compliance, the long-term outlook for the edible offal market remains positive, underpinned by favorable demographic trends, rising protein demand, and a growing consciousness towards sustainability and minimizing food waste. The continuous development of innovative culinary applications and enhanced processing technologies will contribute further to the market's expansion in the coming years.
Edible Offal Company Market Share
Edible Offal Market Report: 2019-2033
This comprehensive report provides a detailed analysis of the global edible offal market, encompassing market dynamics, growth trends, regional dominance, product landscape, and key player strategies. The study period spans from 2019 to 2033, with 2025 serving as the base and estimated year. The forecast period covers 2025-2033, and the historical period includes 2019-2024. This report is crucial for industry professionals, investors, and anyone seeking to understand the intricacies of this growing market segment within the broader meat and food processing industry.
Edible Offal Market Dynamics & Structure
The global edible offal market, valued at $xx million in 2025, exhibits a moderately concentrated structure with key players like BRF SA, Hormel Foods, and JBS USA holding significant market share. Technological innovation, particularly in processing and preservation techniques, is a key driver, alongside evolving consumer preferences toward sustainable and nutritious food sources. Regulatory frameworks concerning food safety and hygiene significantly influence market operations. Competitive substitutes include plant-based alternatives and other protein sources, impacting market share. End-user demographics, particularly in developing economies with rising disposable incomes, are shaping demand. The market has witnessed a moderate level of M&A activity in recent years, with approximately xx deals recorded between 2019 and 2024, contributing to market consolidation.
- Market Concentration: Moderately concentrated, with top 5 players holding approximately xx% market share in 2025.
- Technological Innovation: Focus on improved processing, preservation (e.g., freezing, canning), and value-added products.
- Regulatory Framework: Stringent food safety and hygiene standards impact production and distribution.
- Competitive Substitutes: Plant-based alternatives and other protein sources pose a moderate competitive threat.
- End-User Demographics: Growing middle class in developing economies drives demand for affordable protein sources.
- M&A Trends: xx M&A deals between 2019-2024, indicating consolidation and strategic expansion.
Edible Offal Growth Trends & Insights
The global edible offal market demonstrates robust growth, driven by increasing consumer awareness of its nutritional benefits and cost-effectiveness. The market size expanded from $xx million in 2019 to $xx million in 2024, exhibiting a CAGR of xx%. This growth trajectory is projected to continue, with a forecasted CAGR of xx% from 2025 to 2033, reaching $xx million by 2033. Technological advancements in processing and preservation have increased shelf life and improved product quality, fueling market expansion. Changing consumer preferences, influenced by health and sustainability concerns, are also contributing to the market's upward trend. The rising adoption of offal in various culinary applications globally is also a contributing factor.
Dominant Regions, Countries, or Segments in Edible Offal
Asia-Pacific dominates the global edible offal market, accounting for approximately xx% of the total market share in 2025. This dominance is attributed to several factors:
- High Population Density: The region's vast population fuels high demand for affordable protein sources.
- Growing Middle Class: Rising disposable incomes contribute to increased meat consumption, including offal.
- Cultural Preferences: Traditional culinary practices in many Asian countries incorporate offal in various dishes.
- Favorable Government Policies: Supportive agricultural policies and infrastructure development foster market growth.
- Cost-Effectiveness: Offal represents a more affordable protein source compared to other meat cuts.
China and India are the leading countries within the region, driving significant market growth due to expanding economies, increasing urbanization, and changing dietary habits. The market in North America and Europe is also witnessing growth, albeit at a slower pace compared to the Asia-Pacific region.
Edible Offal Product Landscape
The edible offal market offers a diverse product landscape, including liver, kidney, heart, and other organs, processed in various forms such as fresh, frozen, canned, and value-added products (e.g., sausages, pates). Technological advancements in processing and packaging extend shelf life and improve product quality. Unique selling propositions include cost-effectiveness, high nutritional value (e.g., iron, vitamin B12), and versatility in culinary applications.
Key Drivers, Barriers & Challenges in Edible Offal
Key Drivers:
- Cost-Effectiveness: Offal is significantly cheaper than other meat cuts, making it accessible to a wider consumer base.
- Nutritional Value: Rich in essential vitamins and minerals, appealing to health-conscious consumers.
- Culinary Versatility: Adaptable to various cooking methods and cuisines.
- Technological Advancements: Improved processing and preservation techniques enhance quality and shelf life.
Challenges & Restraints:
- Consumer Perception: Negative perceptions associated with offal in some cultures hinder market penetration.
- Supply Chain Inefficiencies: Lack of efficient and hygienic supply chains, particularly in developing countries, restricts market growth.
- Regulatory Hurdles: Varying food safety regulations across different regions can pose challenges to market expansion.
- Competition from Substitutes: Plant-based meat alternatives present a growing competitive threat. This impact is estimated at a xx% reduction in market growth by 2033.
Emerging Opportunities in Edible Offal
- Value-Added Products: Developing innovative, value-added products like offal-based sausages, pâtés, and ready-to-eat meals can attract new consumer segments.
- Untapped Markets: Exploring new markets in regions with limited offal consumption, through targeted marketing and education campaigns.
- Sustainability Focus: Highlighting the environmental benefits of utilizing offal, reducing food waste.
Growth Accelerators in the Edible Offal Industry
Strategic partnerships between food processors, retailers, and technology providers are crucial for accelerating market growth. Technological breakthroughs in processing and preservation, coupled with targeted marketing campaigns promoting offal's nutritional value and culinary applications, will unlock substantial market potential. Expansion into new markets and diversification of product offerings will also drive long-term growth.
Key Players Shaping the Edible Offal Market
- BRF SA
- Hormel Foods
- T and T Supermarket
- Smithfield Foods
- Shuanghui International
- JBS USA
- Cargill
- Excel Industrial
- Cheetah Foods
- Niman Ranch
- Tyson Foods
- Pinnacle Foods
- Marfrig Foods
- Oxfords Food Group
- Foster Farms
Notable Milestones in Edible Offal Sector
- 2020: Introduction of new, sustainable offal processing technology by Cargill.
- 2022: Launch of a new line of offal-based ready-to-eat meals by BRF SA.
- 2023: Acquisition of a smaller offal processor by JBS USA, expanding its market presence.
In-Depth Edible Offal Market Outlook
The edible offal market is poised for significant growth in the coming years, driven by factors such as rising consumer awareness of its nutritional benefits, technological advancements in processing and preservation, and increasing demand for affordable protein sources. Strategic partnerships, innovative product development, and expansion into new markets represent key opportunities for companies operating in this sector. The long-term outlook for the edible offal market is exceptionally positive, with substantial growth potential for both established players and new entrants.
Edible Offal Segmentation
-
1. Application
- 1.1. Online Sales
- 1.2. Offline Sales
-
2. Type
- 2.1. Beef
- 2.2. Pork
- 2.3. Lamb
- 2.4. Poultry
- 2.5. Fish
Edible Offal Segmentation By Geography
-
1. North America
- 1.1. United States
- 1.2. Canada
- 1.3. Mexico
-
2. South America
- 2.1. Brazil
- 2.2. Argentina
- 2.3. Rest of South America
-
3. Europe
- 3.1. United Kingdom
- 3.2. Germany
- 3.3. France
- 3.4. Italy
- 3.5. Spain
- 3.6. Russia
- 3.7. Benelux
- 3.8. Nordics
- 3.9. Rest of Europe
-
4. Middle East & Africa
- 4.1. Turkey
- 4.2. Israel
- 4.3. GCC
- 4.4. North Africa
- 4.5. South Africa
- 4.6. Rest of Middle East & Africa
-
5. Asia Pacific
- 5.1. China
- 5.2. India
- 5.3. Japan
- 5.4. South Korea
- 5.5. ASEAN
- 5.6. Oceania
- 5.7. Rest of Asia Pacific

Edible Offal Regional Market Share
Geographic Coverage of Edible Offal
Edible Offal REPORT HIGHLIGHTS
| Aspects | Details |
|---|---|
| Study Period | 2020-2034 |
| Base Year | 2025 |
| Estimated Year | 2026 |
| Forecast Period | 2026-2034 |
| Historical Period | 2020-2025 |
| Growth Rate | CAGR of 4% from 2020-2034 |
| Segmentation |
|
Table of Contents
- 1. Introduction
- 1.1. Research Scope
- 1.2. Market Segmentation
- 1.3. Research Methodology
- 1.4. Definitions and Assumptions
- 2. Executive Summary
- 2.1. Introduction
- 3. Market Dynamics
- 3.1. Introduction
- 3.2. Market Drivers
- 3.3. Market Restrains
- 3.4. Market Trends
- 4. Market Factor Analysis
- 4.1. Porters Five Forces
- 4.2. Supply/Value Chain
- 4.3. PESTEL analysis
- 4.4. Market Entropy
- 4.5. Patent/Trademark Analysis
- 5. Global Edible Offal Analysis, Insights and Forecast, 2020-2032
- 5.1. Market Analysis, Insights and Forecast - by Application
- 5.1.1. Online Sales
- 5.1.2. Offline Sales
- 5.2. Market Analysis, Insights and Forecast - by Type
- 5.2.1. Beef
- 5.2.2. Pork
- 5.2.3. Lamb
- 5.2.4. Poultry
- 5.2.5. Fish
- 5.3. Market Analysis, Insights and Forecast - by Region
- 5.3.1. North America
- 5.3.2. South America
- 5.3.3. Europe
- 5.3.4. Middle East & Africa
- 5.3.5. Asia Pacific
- 5.1. Market Analysis, Insights and Forecast - by Application
- 6. North America Edible Offal Analysis, Insights and Forecast, 2020-2032
- 6.1. Market Analysis, Insights and Forecast - by Application
- 6.1.1. Online Sales
- 6.1.2. Offline Sales
- 6.2. Market Analysis, Insights and Forecast - by Type
- 6.2.1. Beef
- 6.2.2. Pork
- 6.2.3. Lamb
- 6.2.4. Poultry
- 6.2.5. Fish
- 6.1. Market Analysis, Insights and Forecast - by Application
- 7. South America Edible Offal Analysis, Insights and Forecast, 2020-2032
- 7.1. Market Analysis, Insights and Forecast - by Application
- 7.1.1. Online Sales
- 7.1.2. Offline Sales
- 7.2. Market Analysis, Insights and Forecast - by Type
- 7.2.1. Beef
- 7.2.2. Pork
- 7.2.3. Lamb
- 7.2.4. Poultry
- 7.2.5. Fish
- 7.1. Market Analysis, Insights and Forecast - by Application
- 8. Europe Edible Offal Analysis, Insights and Forecast, 2020-2032
- 8.1. Market Analysis, Insights and Forecast - by Application
- 8.1.1. Online Sales
- 8.1.2. Offline Sales
- 8.2. Market Analysis, Insights and Forecast - by Type
- 8.2.1. Beef
- 8.2.2. Pork
- 8.2.3. Lamb
- 8.2.4. Poultry
- 8.2.5. Fish
- 8.1. Market Analysis, Insights and Forecast - by Application
- 9. Middle East & Africa Edible Offal Analysis, Insights and Forecast, 2020-2032
- 9.1. Market Analysis, Insights and Forecast - by Application
- 9.1.1. Online Sales
- 9.1.2. Offline Sales
- 9.2. Market Analysis, Insights and Forecast - by Type
- 9.2.1. Beef
- 9.2.2. Pork
- 9.2.3. Lamb
- 9.2.4. Poultry
- 9.2.5. Fish
- 9.1. Market Analysis, Insights and Forecast - by Application
- 10. Asia Pacific Edible Offal Analysis, Insights and Forecast, 2020-2032
- 10.1. Market Analysis, Insights and Forecast - by Application
- 10.1.1. Online Sales
- 10.1.2. Offline Sales
- 10.2. Market Analysis, Insights and Forecast - by Type
- 10.2.1. Beef
- 10.2.2. Pork
- 10.2.3. Lamb
- 10.2.4. Poultry
- 10.2.5. Fish
- 10.1. Market Analysis, Insights and Forecast - by Application
- 11. Competitive Analysis
- 11.1. Global Market Share Analysis 2025
- 11.2. Company Profiles
- 11.2.1 BRF SA
- 11.2.1.1. Overview
- 11.2.1.2. Products
- 11.2.1.3. SWOT Analysis
- 11.2.1.4. Recent Developments
- 11.2.1.5. Financials (Based on Availability)
- 11.2.2 Hormel Foods
- 11.2.2.1. Overview
- 11.2.2.2. Products
- 11.2.2.3. SWOT Analysis
- 11.2.2.4. Recent Developments
- 11.2.2.5. Financials (Based on Availability)
- 11.2.3 T and T Supermarket
- 11.2.3.1. Overview
- 11.2.3.2. Products
- 11.2.3.3. SWOT Analysis
- 11.2.3.4. Recent Developments
- 11.2.3.5. Financials (Based on Availability)
- 11.2.4 Smithfield Foods
- 11.2.4.1. Overview
- 11.2.4.2. Products
- 11.2.4.3. SWOT Analysis
- 11.2.4.4. Recent Developments
- 11.2.4.5. Financials (Based on Availability)
- 11.2.5 Shuanghui International
- 11.2.5.1. Overview
- 11.2.5.2. Products
- 11.2.5.3. SWOT Analysis
- 11.2.5.4. Recent Developments
- 11.2.5.5. Financials (Based on Availability)
- 11.2.6 JBS USA
- 11.2.6.1. Overview
- 11.2.6.2. Products
- 11.2.6.3. SWOT Analysis
- 11.2.6.4. Recent Developments
- 11.2.6.5. Financials (Based on Availability)
- 11.2.7 Cargill
- 11.2.7.1. Overview
- 11.2.7.2. Products
- 11.2.7.3. SWOT Analysis
- 11.2.7.4. Recent Developments
- 11.2.7.5. Financials (Based on Availability)
- 11.2.8 Excel Industrial
- 11.2.8.1. Overview
- 11.2.8.2. Products
- 11.2.8.3. SWOT Analysis
- 11.2.8.4. Recent Developments
- 11.2.8.5. Financials (Based on Availability)
- 11.2.9 Cheetah Foods
- 11.2.9.1. Overview
- 11.2.9.2. Products
- 11.2.9.3. SWOT Analysis
- 11.2.9.4. Recent Developments
- 11.2.9.5. Financials (Based on Availability)
- 11.2.10 Niman Ranch
- 11.2.10.1. Overview
- 11.2.10.2. Products
- 11.2.10.3. SWOT Analysis
- 11.2.10.4. Recent Developments
- 11.2.10.5. Financials (Based on Availability)
- 11.2.11 Tyson Foods
- 11.2.11.1. Overview
- 11.2.11.2. Products
- 11.2.11.3. SWOT Analysis
- 11.2.11.4. Recent Developments
- 11.2.11.5. Financials (Based on Availability)
- 11.2.12 Pinnacle Foods
- 11.2.12.1. Overview
- 11.2.12.2. Products
- 11.2.12.3. SWOT Analysis
- 11.2.12.4. Recent Developments
- 11.2.12.5. Financials (Based on Availability)
- 11.2.13 Marfrig Foods
- 11.2.13.1. Overview
- 11.2.13.2. Products
- 11.2.13.3. SWOT Analysis
- 11.2.13.4. Recent Developments
- 11.2.13.5. Financials (Based on Availability)
- 11.2.14 Oxfords Food Group
- 11.2.14.1. Overview
- 11.2.14.2. Products
- 11.2.14.3. SWOT Analysis
- 11.2.14.4. Recent Developments
- 11.2.14.5. Financials (Based on Availability)
- 11.2.15 Foster Farms
- 11.2.15.1. Overview
- 11.2.15.2. Products
- 11.2.15.3. SWOT Analysis
- 11.2.15.4. Recent Developments
- 11.2.15.5. Financials (Based on Availability)
- 11.2.1 BRF SA
List of Figures
- Figure 1: Global Edible Offal Revenue Breakdown (undefined, %) by Region 2025 & 2033
- Figure 2: North America Edible Offal Revenue (undefined), by Application 2025 & 2033
- Figure 3: North America Edible Offal Revenue Share (%), by Application 2025 & 2033
- Figure 4: North America Edible Offal Revenue (undefined), by Type 2025 & 2033
- Figure 5: North America Edible Offal Revenue Share (%), by Type 2025 & 2033
- Figure 6: North America Edible Offal Revenue (undefined), by Country 2025 & 2033
- Figure 7: North America Edible Offal Revenue Share (%), by Country 2025 & 2033
- Figure 8: South America Edible Offal Revenue (undefined), by Application 2025 & 2033
- Figure 9: South America Edible Offal Revenue Share (%), by Application 2025 & 2033
- Figure 10: South America Edible Offal Revenue (undefined), by Type 2025 & 2033
- Figure 11: South America Edible Offal Revenue Share (%), by Type 2025 & 2033
- Figure 12: South America Edible Offal Revenue (undefined), by Country 2025 & 2033
- Figure 13: South America Edible Offal Revenue Share (%), by Country 2025 & 2033
- Figure 14: Europe Edible Offal Revenue (undefined), by Application 2025 & 2033
- Figure 15: Europe Edible Offal Revenue Share (%), by Application 2025 & 2033
- Figure 16: Europe Edible Offal Revenue (undefined), by Type 2025 & 2033
- Figure 17: Europe Edible Offal Revenue Share (%), by Type 2025 & 2033
- Figure 18: Europe Edible Offal Revenue (undefined), by Country 2025 & 2033
- Figure 19: Europe Edible Offal Revenue Share (%), by Country 2025 & 2033
- Figure 20: Middle East & Africa Edible Offal Revenue (undefined), by Application 2025 & 2033
- Figure 21: Middle East & Africa Edible Offal Revenue Share (%), by Application 2025 & 2033
- Figure 22: Middle East & Africa Edible Offal Revenue (undefined), by Type 2025 & 2033
- Figure 23: Middle East & Africa Edible Offal Revenue Share (%), by Type 2025 & 2033
- Figure 24: Middle East & Africa Edible Offal Revenue (undefined), by Country 2025 & 2033
- Figure 25: Middle East & Africa Edible Offal Revenue Share (%), by Country 2025 & 2033
- Figure 26: Asia Pacific Edible Offal Revenue (undefined), by Application 2025 & 2033
- Figure 27: Asia Pacific Edible Offal Revenue Share (%), by Application 2025 & 2033
- Figure 28: Asia Pacific Edible Offal Revenue (undefined), by Type 2025 & 2033
- Figure 29: Asia Pacific Edible Offal Revenue Share (%), by Type 2025 & 2033
- Figure 30: Asia Pacific Edible Offal Revenue (undefined), by Country 2025 & 2033
- Figure 31: Asia Pacific Edible Offal Revenue Share (%), by Country 2025 & 2033
List of Tables
- Table 1: Global Edible Offal Revenue undefined Forecast, by Application 2020 & 2033
- Table 2: Global Edible Offal Revenue undefined Forecast, by Type 2020 & 2033
- Table 3: Global Edible Offal Revenue undefined Forecast, by Region 2020 & 2033
- Table 4: Global Edible Offal Revenue undefined Forecast, by Application 2020 & 2033
- Table 5: Global Edible Offal Revenue undefined Forecast, by Type 2020 & 2033
- Table 6: Global Edible Offal Revenue undefined Forecast, by Country 2020 & 2033
- Table 7: United States Edible Offal Revenue (undefined) Forecast, by Application 2020 & 2033
- Table 8: Canada Edible Offal Revenue (undefined) Forecast, by Application 2020 & 2033
- Table 9: Mexico Edible Offal Revenue (undefined) Forecast, by Application 2020 & 2033
- Table 10: Global Edible Offal Revenue undefined Forecast, by Application 2020 & 2033
- Table 11: Global Edible Offal Revenue undefined Forecast, by Type 2020 & 2033
- Table 12: Global Edible Offal Revenue undefined Forecast, by Country 2020 & 2033
- Table 13: Brazil Edible Offal Revenue (undefined) Forecast, by Application 2020 & 2033
- Table 14: Argentina Edible Offal Revenue (undefined) Forecast, by Application 2020 & 2033
- Table 15: Rest of South America Edible Offal Revenue (undefined) Forecast, by Application 2020 & 2033
- Table 16: Global Edible Offal Revenue undefined Forecast, by Application 2020 & 2033
- Table 17: Global Edible Offal Revenue undefined Forecast, by Type 2020 & 2033
- Table 18: Global Edible Offal Revenue undefined Forecast, by Country 2020 & 2033
- Table 19: United Kingdom Edible Offal Revenue (undefined) Forecast, by Application 2020 & 2033
- Table 20: Germany Edible Offal Revenue (undefined) Forecast, by Application 2020 & 2033
- Table 21: France Edible Offal Revenue (undefined) Forecast, by Application 2020 & 2033
- Table 22: Italy Edible Offal Revenue (undefined) Forecast, by Application 2020 & 2033
- Table 23: Spain Edible Offal Revenue (undefined) Forecast, by Application 2020 & 2033
- Table 24: Russia Edible Offal Revenue (undefined) Forecast, by Application 2020 & 2033
- Table 25: Benelux Edible Offal Revenue (undefined) Forecast, by Application 2020 & 2033
- Table 26: Nordics Edible Offal Revenue (undefined) Forecast, by Application 2020 & 2033
- Table 27: Rest of Europe Edible Offal Revenue (undefined) Forecast, by Application 2020 & 2033
- Table 28: Global Edible Offal Revenue undefined Forecast, by Application 2020 & 2033
- Table 29: Global Edible Offal Revenue undefined Forecast, by Type 2020 & 2033
- Table 30: Global Edible Offal Revenue undefined Forecast, by Country 2020 & 2033
- Table 31: Turkey Edible Offal Revenue (undefined) Forecast, by Application 2020 & 2033
- Table 32: Israel Edible Offal Revenue (undefined) Forecast, by Application 2020 & 2033
- Table 33: GCC Edible Offal Revenue (undefined) Forecast, by Application 2020 & 2033
- Table 34: North Africa Edible Offal Revenue (undefined) Forecast, by Application 2020 & 2033
- Table 35: South Africa Edible Offal Revenue (undefined) Forecast, by Application 2020 & 2033
- Table 36: Rest of Middle East & Africa Edible Offal Revenue (undefined) Forecast, by Application 2020 & 2033
- Table 37: Global Edible Offal Revenue undefined Forecast, by Application 2020 & 2033
- Table 38: Global Edible Offal Revenue undefined Forecast, by Type 2020 & 2033
- Table 39: Global Edible Offal Revenue undefined Forecast, by Country 2020 & 2033
- Table 40: China Edible Offal Revenue (undefined) Forecast, by Application 2020 & 2033
- Table 41: India Edible Offal Revenue (undefined) Forecast, by Application 2020 & 2033
- Table 42: Japan Edible Offal Revenue (undefined) Forecast, by Application 2020 & 2033
- Table 43: South Korea Edible Offal Revenue (undefined) Forecast, by Application 2020 & 2033
- Table 44: ASEAN Edible Offal Revenue (undefined) Forecast, by Application 2020 & 2033
- Table 45: Oceania Edible Offal Revenue (undefined) Forecast, by Application 2020 & 2033
- Table 46: Rest of Asia Pacific Edible Offal Revenue (undefined) Forecast, by Application 2020 & 2033
Frequently Asked Questions
1. What is the projected Compound Annual Growth Rate (CAGR) of the Edible Offal?
The projected CAGR is approximately 4%.
2. Which companies are prominent players in the Edible Offal?
Key companies in the market include BRF SA, Hormel Foods, T and T Supermarket, Smithfield Foods, Shuanghui International, JBS USA, Cargill, Excel Industrial, Cheetah Foods, Niman Ranch, Tyson Foods, Pinnacle Foods, Marfrig Foods, Oxfords Food Group, Foster Farms.
3. What are the main segments of the Edible Offal?
The market segments include Application, Type.
4. Can you provide details about the market size?
The market size is estimated to be USD XXX N/A as of 2022.
5. What are some drivers contributing to market growth?
N/A
6. What are the notable trends driving market growth?
N/A
7. Are there any restraints impacting market growth?
N/A
8. Can you provide examples of recent developments in the market?
N/A
9. What pricing options are available for accessing the report?
Pricing options include single-user, multi-user, and enterprise licenses priced at USD 4250.00, USD 6375.00, and USD 8500.00 respectively.
10. Is the market size provided in terms of value or volume?
The market size is provided in terms of value, measured in N/A.
11. Are there any specific market keywords associated with the report?
Yes, the market keyword associated with the report is "Edible Offal," which aids in identifying and referencing the specific market segment covered.
12. How do I determine which pricing option suits my needs best?
The pricing options vary based on user requirements and access needs. Individual users may opt for single-user licenses, while businesses requiring broader access may choose multi-user or enterprise licenses for cost-effective access to the report.
13. Are there any additional resources or data provided in the Edible Offal report?
While the report offers comprehensive insights, it's advisable to review the specific contents or supplementary materials provided to ascertain if additional resources or data are available.
14. How can I stay updated on further developments or reports in the Edible Offal?
To stay informed about further developments, trends, and reports in the Edible Offal, consider subscribing to industry newsletters, following relevant companies and organizations, or regularly checking reputable industry news sources and publications.
Methodology
Step 1 - Identification of Relevant Samples Size from Population Database


Step 2 - Approaches for Defining Global Market Size (Value, Volume* & Price*)

Note*: In applicable scenarios
Step 3 - Data Sources
Primary Research
- Web Analytics
- Survey Reports
- Research Institute
- Latest Research Reports
- Opinion Leaders
Secondary Research
- Annual Reports
- White Paper
- Latest Press Release
- Industry Association
- Paid Database
- Investor Presentations

Step 4 - Data Triangulation
Involves using different sources of information in order to increase the validity of a study
These sources are likely to be stakeholders in a program - participants, other researchers, program staff, other community members, and so on.
Then we put all data in single framework & apply various statistical tools to find out the dynamic on the market.
During the analysis stage, feedback from the stakeholder groups would be compared to determine areas of agreement as well as areas of divergence