

Key Insights
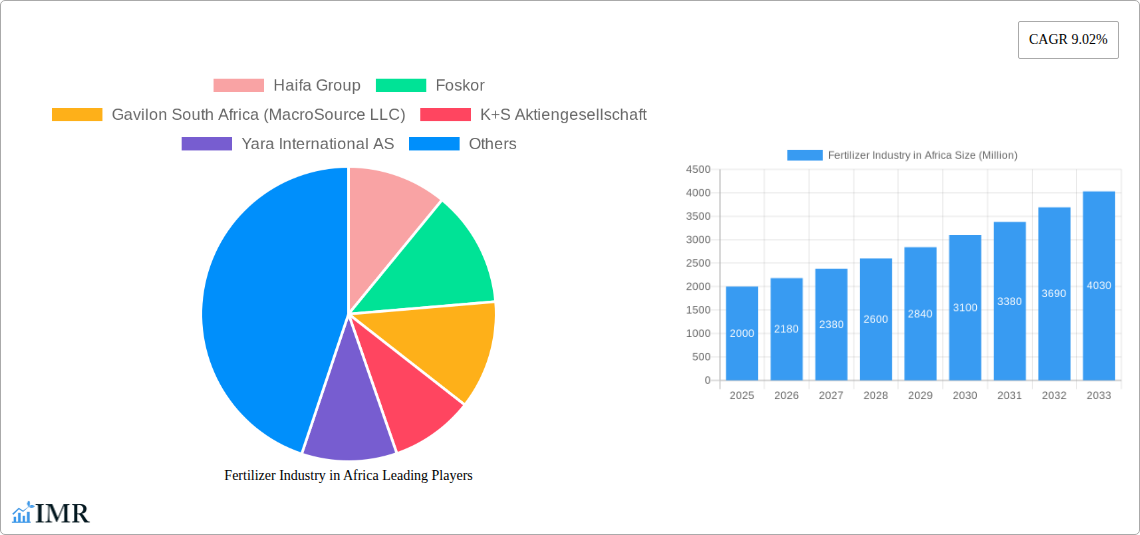
The African fertilizer market, valued at approximately $XX million in 2025, is experiencing robust growth, projected to expand at a compound annual growth rate (CAGR) of 9.02% from 2025 to 2033. This surge is driven by several factors, including increasing agricultural production to meet rising food demands of a rapidly growing population, governmental initiatives promoting fertilizer use to enhance crop yields, and the expansion of high-value horticultural crops across the continent. Significant growth is observed in key segments such as fertigation and foliar application methods, catering to the needs of modern, efficient farming practices. South Africa remains a dominant market within the region, followed by Nigeria and other rapidly developing East African nations. The demand for specialty fertilizers, tailored to specific crop needs and soil conditions, is also experiencing rapid growth, outpacing the growth of conventional fertilizers. However, the market faces challenges including fluctuating raw material prices, infrastructure limitations hindering efficient distribution, and the need for greater farmer education and access to credit.
The market segmentation reveals substantial opportunities. The strong preference for water-soluble fertilizers, especially in horticulture and high-value crops, indicates a shift towards more efficient and precise nutrient delivery systems. While complex fertilizers maintain a significant share, the rising demand for straight fertilizers reflects the need for targeted nutrient supplementation based on specific soil deficiencies. Companies like Haifa Group, Foskor, and Yara International are well-positioned to benefit from this growth, leveraging their established distribution networks and product portfolios. However, competition is intensifying, requiring companies to focus on innovation, sustainable practices, and localized strategies to cater to the diverse needs of different African nations. Further growth will be driven by improved access to finance for farmers, better infrastructure, and supportive government policies.
Fertilizer Industry in Africa: A Comprehensive Market Report (2019-2033)
This comprehensive report provides an in-depth analysis of the African fertilizer market, offering invaluable insights for industry professionals, investors, and stakeholders. Covering the period 2019-2033, with a base year of 2025, this report meticulously examines market dynamics, growth trends, and key players, empowering strategic decision-making. The report segments the market across various parameters, including application mode (fertigation, foliar, soil), country (Nigeria, South Africa, Rest of Africa), form (conventional, specialty), crop type (field crops, horticultural crops, turf & ornamental), and type (complex, straight, water-soluble specialty). The total market size is projected at xx Million units by 2033.
Fertilizer Industry in Africa Market Dynamics & Structure
The African fertilizer market is characterized by a moderately concentrated structure, with a few multinational companies dominating alongside several regional players. Technological innovation is crucial, driven by the need for enhanced efficiency and sustainability. Regulatory frameworks vary across countries, impacting market access and product approvals. Competitive pressures exist from substitute products, such as organic fertilizers, but demand for conventional fertilizers remains high. End-user demographics, characterized by a growing population and increasing agricultural activity, are shaping market growth. Mergers and acquisitions (M&A) activity is picking up, with major players like K+S and ICL actively seeking expansion opportunities. The projected M&A deal volume for 2025-2033 is estimated at xx Million units.
- Market Concentration: Moderately concentrated, with top 5 players holding approximately xx% market share.
- Technological Innovation: Focus on improved nutrient use efficiency (NUE), slow-release fertilizers, and precision farming techniques.
- Regulatory Landscape: Varies significantly across African nations, posing challenges to standardization and market entry.
- Competitive Substitutes: Organic fertilizers and biofertilizers are gaining traction, but chemical fertilizers maintain dominance.
- End-User Demographics: Rapid population growth and increasing urbanization drive demand for increased food production.
- M&A Activity: Strategic acquisitions are reshaping the competitive landscape, reflecting growth ambitions and market consolidation.
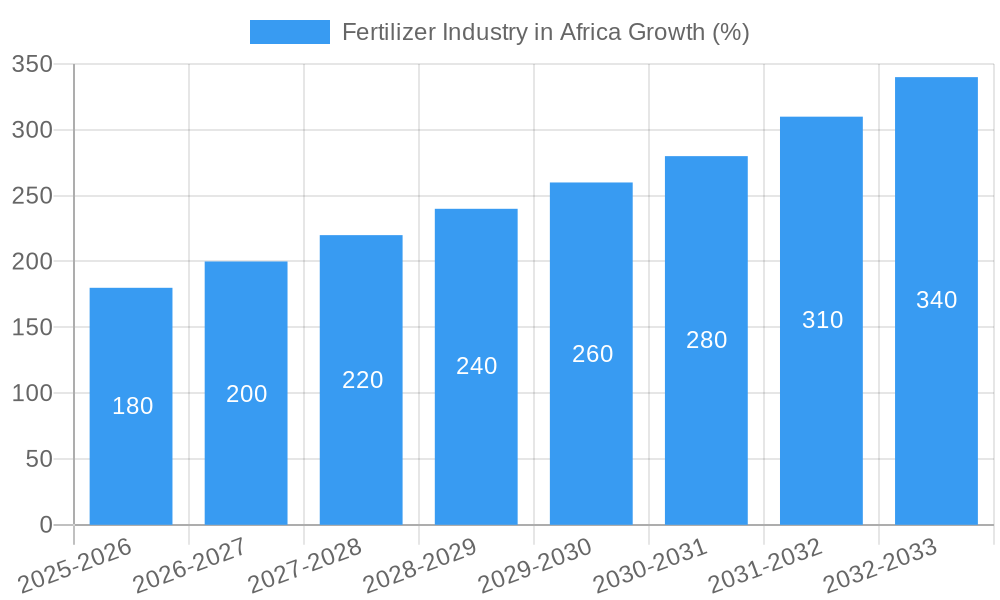
Fertilizer Industry in Africa Growth Trends & Insights
The African fertilizer market exhibits robust growth, driven by factors including rising agricultural production, government support, and improving infrastructure. The market size expanded from xx Million units in 2019 to xx Million units in 2024, demonstrating a significant increase. The Compound Annual Growth Rate (CAGR) during the historical period (2019-2024) was xx%, and is projected to reach xx% during the forecast period (2025-2033). This growth is fueled by a combination of factors including rising agricultural land under cultivation and the growing awareness of improved fertilizer usage practices. Market penetration, especially in Sub-Saharan Africa, continues to be an important factor. Technological disruptions in precision farming and data-driven agriculture are influencing fertilizer application and usage, enabling efficient and targeted fertilizer application. Consumer behavior shifts towards adoption of high-quality, specialized fertilizers with superior crop performance attributes further influences market demand.
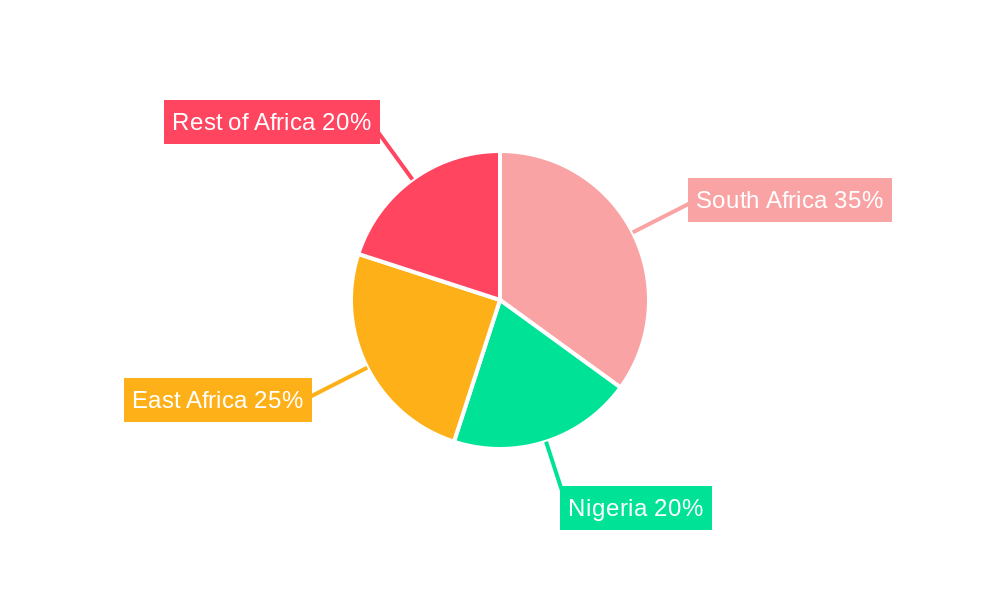
Dominant Regions, Countries, or Segments in Fertilizer Industry in Africa
South Africa is the dominant market, holding the largest market share in both value and volume, driven by advanced agricultural practices and well-established distribution networks. Nigeria presents a significant growth opportunity due to its large population and expanding agricultural sector, though infrastructure limitations present challenges. The "Rest of Africa" segment displays diverse growth trajectories depending on the region-specific agricultural landscape. Within application modes, soil application remains dominant, while fertigation and foliar application are expected to witness strong growth due to their efficiency. The specialty fertilizer segment is expanding rapidly, reflecting the increasing demand for enhanced crop yields and improved nutrient management.
- Key Drivers in South Africa: Well-developed agricultural infrastructure, supportive government policies, and advanced farming practices.
- Growth Potential in Nigeria: Large agricultural land area, burgeoning population, and increasing demand for food security.
- Challenges in Rest of Africa: Infrastructure limitations, access to finance, and varying agricultural practices.
- Application Mode Dominance: Soil application currently dominates, but fertigation and foliar are rapidly gaining traction.
- Specialty Fertilizer Growth: Driven by increasing demand for higher crop yields and improved nutrient efficiency.
Fertilizer Industry in Africa Product Landscape
The product landscape is characterized by a range of conventional and specialty fertilizers, including NPK (Nitrogen, Phosphorus, Potassium) blends and single nutrient products. Technological advancements include slow-release fertilizers, micronutrient-enriched formulations, and bio-fertilizers, designed to improve nutrient use efficiency and reduce environmental impact. Unique selling propositions encompass superior crop performance, ease of application, and customized formulations for specific crops and soil conditions.
Key Drivers, Barriers & Challenges in Fertilizer Industry in Africa
Key Drivers: Growing agricultural production, government support for agricultural development, increasing awareness of fertilizer benefits, and rising disposable incomes. Investments in agricultural infrastructure also play a significant role.
Challenges: High fertilizer prices, limited access to credit and finance for smallholder farmers, poor infrastructure and logistics hindering efficient distribution, and regulatory inconsistencies across regions. These factors result in xx Million units of lost potential revenue annually.
Emerging Opportunities in Fertilizer Industry in Africa
Significant opportunities exist in untapped markets within sub-Saharan Africa, particularly in promoting the use of improved fertilizer practices among smallholder farmers. The expansion of precision agriculture techniques using digital technologies and the development of climate-smart fertilizers tailored to specific regional conditions offer significant potential. Further exploration of innovative financing mechanisms and partnerships with local agribusinesses can foster growth and inclusivity.
Growth Accelerators in the Fertilizer Industry in Africa Industry
Technological advancements in fertilizer formulation, including the development of efficient, eco-friendly products, are key growth drivers. Strategic partnerships between fertilizer manufacturers, input suppliers, and technology providers are fostering efficient distribution channels and improved farmer education. Government initiatives aimed at promoting sustainable agriculture, enhancing rural infrastructure, and encouraging investment in the sector are fueling growth.
Key Players Shaping the Fertilizer Industry in Africa Market
- Haifa Group
- Foskor
- Gavilon South Africa (MacroSource LLC)
- K+S Aktiengesellschaft
- Yara International AS
- UPL Limited
- ICL Group Ltd
- Kynoch Fertilizer
Notable Milestones in Fertilizer Industry in Africa Sector
- May 2022: ICL launched three new NPK formulations of Solinure, a product with increased trace elements to optimize yields.
- January 2023: ICL partnered with General Mills for supplying specialty phosphate solutions, focusing on international expansion.
- April 2023: K+S acquired a 75% share of Industrial Commodities Holdings (Pty) Ltd's fertilizer business, strengthening its presence in southern and eastern Africa under the FertivPty Ltd joint venture.
In-Depth Fertilizer Industry in Africa Market Outlook
The African fertilizer market is poised for sustained growth driven by technological innovations, strategic partnerships, and supportive government policies. The market's potential remains substantial, with significant opportunities for expansion in untapped markets and the adoption of sustainable practices. Companies that invest in research and development, build strong distribution networks, and adapt to the unique needs of African farmers are best positioned to succeed in this dynamic and growing market.
Fertilizer Industry in Africa Segmentation
- 1. Production Analysis
- 2. Consumption Analysis
- 3. Import Market Analysis (Value & Volume)
- 4. Export Market Analysis (Value & Volume)
- 5. Price Trend Analysis
Fertilizer Industry in Africa Segmentation By Geography
-
1. North America
- 1.1. United States
- 1.2. Canada
- 1.3. Mexico
-
2. South America
- 2.1. Brazil
- 2.2. Argentina
- 2.3. Rest of South America
-
3. Europe
- 3.1. United Kingdom
- 3.2. Germany
- 3.3. France
- 3.4. Italy
- 3.5. Spain
- 3.6. Russia
- 3.7. Benelux
- 3.8. Nordics
- 3.9. Rest of Europe
-
4. Middle East & Africa
- 4.1. Turkey
- 4.2. Israel
- 4.3. GCC
- 4.4. North Africa
- 4.5. South Africa
- 4.6. Rest of Middle East & Africa
-
5. Asia Pacific
- 5.1. China
- 5.2. India
- 5.3. Japan
- 5.4. South Korea
- 5.5. ASEAN
- 5.6. Oceania
- 5.7. Rest of Asia Pacific
Fertilizer Industry in Africa REPORT HIGHLIGHTS
| Aspects | Details |
|---|---|
| Study Period | 2019-2033 |
| Base Year | 2024 |
| Estimated Year | 2025 |
| Forecast Period | 2025-2033 |
| Historical Period | 2019-2024 |
| Growth Rate | CAGR of 9.02% from 2019-2033 |
| Segmentation |
|
Table of Contents
- 1. Introduction
- 1.1. Research Scope
- 1.2. Market Segmentation
- 1.3. Research Methodology
- 1.4. Definitions and Assumptions
- 2. Executive Summary
- 2.1. Introduction
- 3. Market Dynamics
- 3.1. Introduction
- 3.2. Market Drivers
- 3.2.1. Need for Custom Product Development; Use of CROs for Regulatory Services
- 3.3. Market Restrains
- 3.3.1. Data and Cyber Security Concerns; Lack of Experts and Professionals in this Industry
- 3.4. Market Trends
- 3.4.1. OTHER KEY INDUSTRY TRENDS COVERED IN THE REPORT
- 4. Market Factor Analysis
- 4.1. Porters Five Forces
- 4.2. Supply/Value Chain
- 4.3. PESTEL analysis
- 4.4. Market Entropy
- 4.5. Patent/Trademark Analysis
- 5. Global Fertilizer Industry in Africa Analysis, Insights and Forecast, 2019-2031
- 5.1. Market Analysis, Insights and Forecast - by Production Analysis
- 5.2. Market Analysis, Insights and Forecast - by Consumption Analysis
- 5.3. Market Analysis, Insights and Forecast - by Import Market Analysis (Value & Volume)
- 5.4. Market Analysis, Insights and Forecast - by Export Market Analysis (Value & Volume)
- 5.5. Market Analysis, Insights and Forecast - by Price Trend Analysis
- 5.6. Market Analysis, Insights and Forecast - by Region
- 5.6.1. North America
- 5.6.2. South America
- 5.6.3. Europe
- 5.6.4. Middle East & Africa
- 5.6.5. Asia Pacific
- 5.1. Market Analysis, Insights and Forecast - by Production Analysis
- 6. North America Fertilizer Industry in Africa Analysis, Insights and Forecast, 2019-2031
- 6.1. Market Analysis, Insights and Forecast - by Production Analysis
- 6.2. Market Analysis, Insights and Forecast - by Consumption Analysis
- 6.3. Market Analysis, Insights and Forecast - by Import Market Analysis (Value & Volume)
- 6.4. Market Analysis, Insights and Forecast - by Export Market Analysis (Value & Volume)
- 6.5. Market Analysis, Insights and Forecast - by Price Trend Analysis
- 6.1. Market Analysis, Insights and Forecast - by Production Analysis
- 7. South America Fertilizer Industry in Africa Analysis, Insights and Forecast, 2019-2031
- 7.1. Market Analysis, Insights and Forecast - by Production Analysis
- 7.2. Market Analysis, Insights and Forecast - by Consumption Analysis
- 7.3. Market Analysis, Insights and Forecast - by Import Market Analysis (Value & Volume)
- 7.4. Market Analysis, Insights and Forecast - by Export Market Analysis (Value & Volume)
- 7.5. Market Analysis, Insights and Forecast - by Price Trend Analysis
- 7.1. Market Analysis, Insights and Forecast - by Production Analysis
- 8. Europe Fertilizer Industry in Africa Analysis, Insights and Forecast, 2019-2031
- 8.1. Market Analysis, Insights and Forecast - by Production Analysis
- 8.2. Market Analysis, Insights and Forecast - by Consumption Analysis
- 8.3. Market Analysis, Insights and Forecast - by Import Market Analysis (Value & Volume)
- 8.4. Market Analysis, Insights and Forecast - by Export Market Analysis (Value & Volume)
- 8.5. Market Analysis, Insights and Forecast - by Price Trend Analysis
- 8.1. Market Analysis, Insights and Forecast - by Production Analysis
- 9. Middle East & Africa Fertilizer Industry in Africa Analysis, Insights and Forecast, 2019-2031
- 9.1. Market Analysis, Insights and Forecast - by Production Analysis
- 9.2. Market Analysis, Insights and Forecast - by Consumption Analysis
- 9.3. Market Analysis, Insights and Forecast - by Import Market Analysis (Value & Volume)
- 9.4. Market Analysis, Insights and Forecast - by Export Market Analysis (Value & Volume)
- 9.5. Market Analysis, Insights and Forecast - by Price Trend Analysis
- 9.1. Market Analysis, Insights and Forecast - by Production Analysis
- 10. Asia Pacific Fertilizer Industry in Africa Analysis, Insights and Forecast, 2019-2031
- 10.1. Market Analysis, Insights and Forecast - by Production Analysis
- 10.2. Market Analysis, Insights and Forecast - by Consumption Analysis
- 10.3. Market Analysis, Insights and Forecast - by Import Market Analysis (Value & Volume)
- 10.4. Market Analysis, Insights and Forecast - by Export Market Analysis (Value & Volume)
- 10.5. Market Analysis, Insights and Forecast - by Price Trend Analysis
- 10.1. Market Analysis, Insights and Forecast - by Production Analysis
- 11. South Africa Fertilizer Industry in Africa Analysis, Insights and Forecast, 2019-2031
- 12. Sudan Fertilizer Industry in Africa Analysis, Insights and Forecast, 2019-2031
- 13. Uganda Fertilizer Industry in Africa Analysis, Insights and Forecast, 2019-2031
- 14. Tanzania Fertilizer Industry in Africa Analysis, Insights and Forecast, 2019-2031
- 15. Kenya Fertilizer Industry in Africa Analysis, Insights and Forecast, 2019-2031
- 16. Rest of Africa Fertilizer Industry in Africa Analysis, Insights and Forecast, 2019-2031
- 17. Competitive Analysis
- 17.1. Global Market Share Analysis 2024
- 17.2. Company Profiles
- 17.2.1 Haifa Group
- 17.2.1.1. Overview
- 17.2.1.2. Products
- 17.2.1.3. SWOT Analysis
- 17.2.1.4. Recent Developments
- 17.2.1.5. Financials (Based on Availability)
- 17.2.2 Foskor
- 17.2.2.1. Overview
- 17.2.2.2. Products
- 17.2.2.3. SWOT Analysis
- 17.2.2.4. Recent Developments
- 17.2.2.5. Financials (Based on Availability)
- 17.2.3 Gavilon South Africa (MacroSource LLC)
- 17.2.3.1. Overview
- 17.2.3.2. Products
- 17.2.3.3. SWOT Analysis
- 17.2.3.4. Recent Developments
- 17.2.3.5. Financials (Based on Availability)
- 17.2.4 K+S Aktiengesellschaft
- 17.2.4.1. Overview
- 17.2.4.2. Products
- 17.2.4.3. SWOT Analysis
- 17.2.4.4. Recent Developments
- 17.2.4.5. Financials (Based on Availability)
- 17.2.5 Yara International AS
- 17.2.5.1. Overview
- 17.2.5.2. Products
- 17.2.5.3. SWOT Analysis
- 17.2.5.4. Recent Developments
- 17.2.5.5. Financials (Based on Availability)
- 17.2.6 UPL Limited
- 17.2.6.1. Overview
- 17.2.6.2. Products
- 17.2.6.3. SWOT Analysis
- 17.2.6.4. Recent Developments
- 17.2.6.5. Financials (Based on Availability)
- 17.2.7 ICL Group Ltd
- 17.2.7.1. Overview
- 17.2.7.2. Products
- 17.2.7.3. SWOT Analysis
- 17.2.7.4. Recent Developments
- 17.2.7.5. Financials (Based on Availability)
- 17.2.8 Kynoch Fertilizer
- 17.2.8.1. Overview
- 17.2.8.2. Products
- 17.2.8.3. SWOT Analysis
- 17.2.8.4. Recent Developments
- 17.2.8.5. Financials (Based on Availability)
- 17.2.1 Haifa Group
List of Figures
- Figure 1: Global Fertilizer Industry in Africa Revenue Breakdown (Million, %) by Region 2024 & 2032
- Figure 2: Africa Fertilizer Industry in Africa Revenue (Million), by Country 2024 & 2032
- Figure 3: Africa Fertilizer Industry in Africa Revenue Share (%), by Country 2024 & 2032
- Figure 4: North America Fertilizer Industry in Africa Revenue (Million), by Production Analysis 2024 & 2032
- Figure 5: North America Fertilizer Industry in Africa Revenue Share (%), by Production Analysis 2024 & 2032
- Figure 6: North America Fertilizer Industry in Africa Revenue (Million), by Consumption Analysis 2024 & 2032
- Figure 7: North America Fertilizer Industry in Africa Revenue Share (%), by Consumption Analysis 2024 & 2032
- Figure 8: North America Fertilizer Industry in Africa Revenue (Million), by Import Market Analysis (Value & Volume) 2024 & 2032
- Figure 9: North America Fertilizer Industry in Africa Revenue Share (%), by Import Market Analysis (Value & Volume) 2024 & 2032
- Figure 10: North America Fertilizer Industry in Africa Revenue (Million), by Export Market Analysis (Value & Volume) 2024 & 2032
- Figure 11: North America Fertilizer Industry in Africa Revenue Share (%), by Export Market Analysis (Value & Volume) 2024 & 2032
- Figure 12: North America Fertilizer Industry in Africa Revenue (Million), by Price Trend Analysis 2024 & 2032
- Figure 13: North America Fertilizer Industry in Africa Revenue Share (%), by Price Trend Analysis 2024 & 2032
- Figure 14: North America Fertilizer Industry in Africa Revenue (Million), by Country 2024 & 2032
- Figure 15: North America Fertilizer Industry in Africa Revenue Share (%), by Country 2024 & 2032
- Figure 16: South America Fertilizer Industry in Africa Revenue (Million), by Production Analysis 2024 & 2032
- Figure 17: South America Fertilizer Industry in Africa Revenue Share (%), by Production Analysis 2024 & 2032
- Figure 18: South America Fertilizer Industry in Africa Revenue (Million), by Consumption Analysis 2024 & 2032
- Figure 19: South America Fertilizer Industry in Africa Revenue Share (%), by Consumption Analysis 2024 & 2032
- Figure 20: South America Fertilizer Industry in Africa Revenue (Million), by Import Market Analysis (Value & Volume) 2024 & 2032
- Figure 21: South America Fertilizer Industry in Africa Revenue Share (%), by Import Market Analysis (Value & Volume) 2024 & 2032
- Figure 22: South America Fertilizer Industry in Africa Revenue (Million), by Export Market Analysis (Value & Volume) 2024 & 2032
- Figure 23: South America Fertilizer Industry in Africa Revenue Share (%), by Export Market Analysis (Value & Volume) 2024 & 2032
- Figure 24: South America Fertilizer Industry in Africa Revenue (Million), by Price Trend Analysis 2024 & 2032
- Figure 25: South America Fertilizer Industry in Africa Revenue Share (%), by Price Trend Analysis 2024 & 2032
- Figure 26: South America Fertilizer Industry in Africa Revenue (Million), by Country 2024 & 2032
- Figure 27: South America Fertilizer Industry in Africa Revenue Share (%), by Country 2024 & 2032
- Figure 28: Europe Fertilizer Industry in Africa Revenue (Million), by Production Analysis 2024 & 2032
- Figure 29: Europe Fertilizer Industry in Africa Revenue Share (%), by Production Analysis 2024 & 2032
- Figure 30: Europe Fertilizer Industry in Africa Revenue (Million), by Consumption Analysis 2024 & 2032
- Figure 31: Europe Fertilizer Industry in Africa Revenue Share (%), by Consumption Analysis 2024 & 2032
- Figure 32: Europe Fertilizer Industry in Africa Revenue (Million), by Import Market Analysis (Value & Volume) 2024 & 2032
- Figure 33: Europe Fertilizer Industry in Africa Revenue Share (%), by Import Market Analysis (Value & Volume) 2024 & 2032
- Figure 34: Europe Fertilizer Industry in Africa Revenue (Million), by Export Market Analysis (Value & Volume) 2024 & 2032
- Figure 35: Europe Fertilizer Industry in Africa Revenue Share (%), by Export Market Analysis (Value & Volume) 2024 & 2032
- Figure 36: Europe Fertilizer Industry in Africa Revenue (Million), by Price Trend Analysis 2024 & 2032
- Figure 37: Europe Fertilizer Industry in Africa Revenue Share (%), by Price Trend Analysis 2024 & 2032
- Figure 38: Europe Fertilizer Industry in Africa Revenue (Million), by Country 2024 & 2032
- Figure 39: Europe Fertilizer Industry in Africa Revenue Share (%), by Country 2024 & 2032
- Figure 40: Middle East & Africa Fertilizer Industry in Africa Revenue (Million), by Production Analysis 2024 & 2032
- Figure 41: Middle East & Africa Fertilizer Industry in Africa Revenue Share (%), by Production Analysis 2024 & 2032
- Figure 42: Middle East & Africa Fertilizer Industry in Africa Revenue (Million), by Consumption Analysis 2024 & 2032
- Figure 43: Middle East & Africa Fertilizer Industry in Africa Revenue Share (%), by Consumption Analysis 2024 & 2032
- Figure 44: Middle East & Africa Fertilizer Industry in Africa Revenue (Million), by Import Market Analysis (Value & Volume) 2024 & 2032
- Figure 45: Middle East & Africa Fertilizer Industry in Africa Revenue Share (%), by Import Market Analysis (Value & Volume) 2024 & 2032
- Figure 46: Middle East & Africa Fertilizer Industry in Africa Revenue (Million), by Export Market Analysis (Value & Volume) 2024 & 2032
- Figure 47: Middle East & Africa Fertilizer Industry in Africa Revenue Share (%), by Export Market Analysis (Value & Volume) 2024 & 2032
- Figure 48: Middle East & Africa Fertilizer Industry in Africa Revenue (Million), by Price Trend Analysis 2024 & 2032
- Figure 49: Middle East & Africa Fertilizer Industry in Africa Revenue Share (%), by Price Trend Analysis 2024 & 2032
- Figure 50: Middle East & Africa Fertilizer Industry in Africa Revenue (Million), by Country 2024 & 2032
- Figure 51: Middle East & Africa Fertilizer Industry in Africa Revenue Share (%), by Country 2024 & 2032
- Figure 52: Asia Pacific Fertilizer Industry in Africa Revenue (Million), by Production Analysis 2024 & 2032
- Figure 53: Asia Pacific Fertilizer Industry in Africa Revenue Share (%), by Production Analysis 2024 & 2032
- Figure 54: Asia Pacific Fertilizer Industry in Africa Revenue (Million), by Consumption Analysis 2024 & 2032
- Figure 55: Asia Pacific Fertilizer Industry in Africa Revenue Share (%), by Consumption Analysis 2024 & 2032
- Figure 56: Asia Pacific Fertilizer Industry in Africa Revenue (Million), by Import Market Analysis (Value & Volume) 2024 & 2032
- Figure 57: Asia Pacific Fertilizer Industry in Africa Revenue Share (%), by Import Market Analysis (Value & Volume) 2024 & 2032
- Figure 58: Asia Pacific Fertilizer Industry in Africa Revenue (Million), by Export Market Analysis (Value & Volume) 2024 & 2032
- Figure 59: Asia Pacific Fertilizer Industry in Africa Revenue Share (%), by Export Market Analysis (Value & Volume) 2024 & 2032
- Figure 60: Asia Pacific Fertilizer Industry in Africa Revenue (Million), by Price Trend Analysis 2024 & 2032
- Figure 61: Asia Pacific Fertilizer Industry in Africa Revenue Share (%), by Price Trend Analysis 2024 & 2032
- Figure 62: Asia Pacific Fertilizer Industry in Africa Revenue (Million), by Country 2024 & 2032
- Figure 63: Asia Pacific Fertilizer Industry in Africa Revenue Share (%), by Country 2024 & 2032
List of Tables
- Table 1: Global Fertilizer Industry in Africa Revenue Million Forecast, by Region 2019 & 2032
- Table 2: Global Fertilizer Industry in Africa Revenue Million Forecast, by Production Analysis 2019 & 2032
- Table 3: Global Fertilizer Industry in Africa Revenue Million Forecast, by Consumption Analysis 2019 & 2032
- Table 4: Global Fertilizer Industry in Africa Revenue Million Forecast, by Import Market Analysis (Value & Volume) 2019 & 2032
- Table 5: Global Fertilizer Industry in Africa Revenue Million Forecast, by Export Market Analysis (Value & Volume) 2019 & 2032
- Table 6: Global Fertilizer Industry in Africa Revenue Million Forecast, by Price Trend Analysis 2019 & 2032
- Table 7: Global Fertilizer Industry in Africa Revenue Million Forecast, by Region 2019 & 2032
- Table 8: Global Fertilizer Industry in Africa Revenue Million Forecast, by Country 2019 & 2032
- Table 9: South Africa Fertilizer Industry in Africa Revenue (Million) Forecast, by Application 2019 & 2032
- Table 10: Sudan Fertilizer Industry in Africa Revenue (Million) Forecast, by Application 2019 & 2032
- Table 11: Uganda Fertilizer Industry in Africa Revenue (Million) Forecast, by Application 2019 & 2032
- Table 12: Tanzania Fertilizer Industry in Africa Revenue (Million) Forecast, by Application 2019 & 2032
- Table 13: Kenya Fertilizer Industry in Africa Revenue (Million) Forecast, by Application 2019 & 2032
- Table 14: Rest of Africa Fertilizer Industry in Africa Revenue (Million) Forecast, by Application 2019 & 2032
- Table 15: Global Fertilizer Industry in Africa Revenue Million Forecast, by Production Analysis 2019 & 2032
- Table 16: Global Fertilizer Industry in Africa Revenue Million Forecast, by Consumption Analysis 2019 & 2032
- Table 17: Global Fertilizer Industry in Africa Revenue Million Forecast, by Import Market Analysis (Value & Volume) 2019 & 2032
- Table 18: Global Fertilizer Industry in Africa Revenue Million Forecast, by Export Market Analysis (Value & Volume) 2019 & 2032
- Table 19: Global Fertilizer Industry in Africa Revenue Million Forecast, by Price Trend Analysis 2019 & 2032
- Table 20: Global Fertilizer Industry in Africa Revenue Million Forecast, by Country 2019 & 2032
- Table 21: United States Fertilizer Industry in Africa Revenue (Million) Forecast, by Application 2019 & 2032
- Table 22: Canada Fertilizer Industry in Africa Revenue (Million) Forecast, by Application 2019 & 2032
- Table 23: Mexico Fertilizer Industry in Africa Revenue (Million) Forecast, by Application 2019 & 2032
- Table 24: Global Fertilizer Industry in Africa Revenue Million Forecast, by Production Analysis 2019 & 2032
- Table 25: Global Fertilizer Industry in Africa Revenue Million Forecast, by Consumption Analysis 2019 & 2032
- Table 26: Global Fertilizer Industry in Africa Revenue Million Forecast, by Import Market Analysis (Value & Volume) 2019 & 2032
- Table 27: Global Fertilizer Industry in Africa Revenue Million Forecast, by Export Market Analysis (Value & Volume) 2019 & 2032
- Table 28: Global Fertilizer Industry in Africa Revenue Million Forecast, by Price Trend Analysis 2019 & 2032
- Table 29: Global Fertilizer Industry in Africa Revenue Million Forecast, by Country 2019 & 2032
- Table 30: Brazil Fertilizer Industry in Africa Revenue (Million) Forecast, by Application 2019 & 2032
- Table 31: Argentina Fertilizer Industry in Africa Revenue (Million) Forecast, by Application 2019 & 2032
- Table 32: Rest of South America Fertilizer Industry in Africa Revenue (Million) Forecast, by Application 2019 & 2032
- Table 33: Global Fertilizer Industry in Africa Revenue Million Forecast, by Production Analysis 2019 & 2032
- Table 34: Global Fertilizer Industry in Africa Revenue Million Forecast, by Consumption Analysis 2019 & 2032
- Table 35: Global Fertilizer Industry in Africa Revenue Million Forecast, by Import Market Analysis (Value & Volume) 2019 & 2032
- Table 36: Global Fertilizer Industry in Africa Revenue Million Forecast, by Export Market Analysis (Value & Volume) 2019 & 2032
- Table 37: Global Fertilizer Industry in Africa Revenue Million Forecast, by Price Trend Analysis 2019 & 2032
- Table 38: Global Fertilizer Industry in Africa Revenue Million Forecast, by Country 2019 & 2032
- Table 39: United Kingdom Fertilizer Industry in Africa Revenue (Million) Forecast, by Application 2019 & 2032
- Table 40: Germany Fertilizer Industry in Africa Revenue (Million) Forecast, by Application 2019 & 2032
- Table 41: France Fertilizer Industry in Africa Revenue (Million) Forecast, by Application 2019 & 2032
- Table 42: Italy Fertilizer Industry in Africa Revenue (Million) Forecast, by Application 2019 & 2032
- Table 43: Spain Fertilizer Industry in Africa Revenue (Million) Forecast, by Application 2019 & 2032
- Table 44: Russia Fertilizer Industry in Africa Revenue (Million) Forecast, by Application 2019 & 2032
- Table 45: Benelux Fertilizer Industry in Africa Revenue (Million) Forecast, by Application 2019 & 2032
- Table 46: Nordics Fertilizer Industry in Africa Revenue (Million) Forecast, by Application 2019 & 2032
- Table 47: Rest of Europe Fertilizer Industry in Africa Revenue (Million) Forecast, by Application 2019 & 2032
- Table 48: Global Fertilizer Industry in Africa Revenue Million Forecast, by Production Analysis 2019 & 2032
- Table 49: Global Fertilizer Industry in Africa Revenue Million Forecast, by Consumption Analysis 2019 & 2032
- Table 50: Global Fertilizer Industry in Africa Revenue Million Forecast, by Import Market Analysis (Value & Volume) 2019 & 2032
- Table 51: Global Fertilizer Industry in Africa Revenue Million Forecast, by Export Market Analysis (Value & Volume) 2019 & 2032
- Table 52: Global Fertilizer Industry in Africa Revenue Million Forecast, by Price Trend Analysis 2019 & 2032
- Table 53: Global Fertilizer Industry in Africa Revenue Million Forecast, by Country 2019 & 2032
- Table 54: Turkey Fertilizer Industry in Africa Revenue (Million) Forecast, by Application 2019 & 2032
- Table 55: Israel Fertilizer Industry in Africa Revenue (Million) Forecast, by Application 2019 & 2032
- Table 56: GCC Fertilizer Industry in Africa Revenue (Million) Forecast, by Application 2019 & 2032
- Table 57: North Africa Fertilizer Industry in Africa Revenue (Million) Forecast, by Application 2019 & 2032
- Table 58: South Africa Fertilizer Industry in Africa Revenue (Million) Forecast, by Application 2019 & 2032
- Table 59: Rest of Middle East & Africa Fertilizer Industry in Africa Revenue (Million) Forecast, by Application 2019 & 2032
- Table 60: Global Fertilizer Industry in Africa Revenue Million Forecast, by Production Analysis 2019 & 2032
- Table 61: Global Fertilizer Industry in Africa Revenue Million Forecast, by Consumption Analysis 2019 & 2032
- Table 62: Global Fertilizer Industry in Africa Revenue Million Forecast, by Import Market Analysis (Value & Volume) 2019 & 2032
- Table 63: Global Fertilizer Industry in Africa Revenue Million Forecast, by Export Market Analysis (Value & Volume) 2019 & 2032
- Table 64: Global Fertilizer Industry in Africa Revenue Million Forecast, by Price Trend Analysis 2019 & 2032
- Table 65: Global Fertilizer Industry in Africa Revenue Million Forecast, by Country 2019 & 2032
- Table 66: China Fertilizer Industry in Africa Revenue (Million) Forecast, by Application 2019 & 2032
- Table 67: India Fertilizer Industry in Africa Revenue (Million) Forecast, by Application 2019 & 2032
- Table 68: Japan Fertilizer Industry in Africa Revenue (Million) Forecast, by Application 2019 & 2032
- Table 69: South Korea Fertilizer Industry in Africa Revenue (Million) Forecast, by Application 2019 & 2032
- Table 70: ASEAN Fertilizer Industry in Africa Revenue (Million) Forecast, by Application 2019 & 2032
- Table 71: Oceania Fertilizer Industry in Africa Revenue (Million) Forecast, by Application 2019 & 2032
- Table 72: Rest of Asia Pacific Fertilizer Industry in Africa Revenue (Million) Forecast, by Application 2019 & 2032
Frequently Asked Questions
1. What is the projected Compound Annual Growth Rate (CAGR) of the Fertilizer Industry in Africa?
The projected CAGR is approximately 9.02%.
2. Which companies are prominent players in the Fertilizer Industry in Africa?
Key companies in the market include Haifa Group, Foskor, Gavilon South Africa (MacroSource LLC), K+S Aktiengesellschaft, Yara International AS, UPL Limited, ICL Group Ltd, Kynoch Fertilizer.
3. What are the main segments of the Fertilizer Industry in Africa?
The market segments include Production Analysis, Consumption Analysis, Import Market Analysis (Value & Volume), Export Market Analysis (Value & Volume), Price Trend Analysis.
4. Can you provide details about the market size?
The market size is estimated to be USD XX Million as of 2022.
5. What are some drivers contributing to market growth?
Need for Custom Product Development; Use of CROs for Regulatory Services.
6. What are the notable trends driving market growth?
OTHER KEY INDUSTRY TRENDS COVERED IN THE REPORT.
7. Are there any restraints impacting market growth?
Data and Cyber Security Concerns; Lack of Experts and Professionals in this Industry.
8. Can you provide examples of recent developments in the market?
April 2023: K+S has acquired a 75% share of the fertilizer business of South African trading company Industrial Commodities Holdings (Pty) Ltd (ICH). In addition to expanding the core business, K+S is strengthening its operations in southern and eastern Africa as a result of this acquisition. The newly acquired fertilizer business in the future to be operated in a joint venture, under the name of FertivPty Ltd.January 2023: ICL has entered into a strategic partnership agreement with General Mills, in which it will be the supplier of strategic specialty phosphate solutions to General Mills. The long-term agreement will also focus on international expansion.May 2022: ICL launched three new NPK formulations of Solinure, a product with increased trace elements to optimize yields.
9. What pricing options are available for accessing the report?
Pricing options include single-user, multi-user, and enterprise licenses priced at USD 3800, USD 4500, and USD 5800 respectively.
10. Is the market size provided in terms of value or volume?
The market size is provided in terms of value, measured in Million.
11. Are there any specific market keywords associated with the report?
Yes, the market keyword associated with the report is "Fertilizer Industry in Africa," which aids in identifying and referencing the specific market segment covered.
12. How do I determine which pricing option suits my needs best?
The pricing options vary based on user requirements and access needs. Individual users may opt for single-user licenses, while businesses requiring broader access may choose multi-user or enterprise licenses for cost-effective access to the report.
13. Are there any additional resources or data provided in the Fertilizer Industry in Africa report?
While the report offers comprehensive insights, it's advisable to review the specific contents or supplementary materials provided to ascertain if additional resources or data are available.
14. How can I stay updated on further developments or reports in the Fertilizer Industry in Africa?
To stay informed about further developments, trends, and reports in the Fertilizer Industry in Africa, consider subscribing to industry newsletters, following relevant companies and organizations, or regularly checking reputable industry news sources and publications.
Methodology
Step 1 - Identification of Relevant Samples Size from Population Database


Step 2 - Approaches for Defining Global Market Size (Value, Volume* & Price*)

Note*: In applicable scenarios
Step 3 - Data Sources
Primary Research
- Web Analytics
- Survey Reports
- Research Institute
- Latest Research Reports
- Opinion Leaders
Secondary Research
- Annual Reports
- White Paper
- Latest Press Release
- Industry Association
- Paid Database
- Investor Presentations

Step 4 - Data Triangulation
Involves using different sources of information in order to increase the validity of a study
These sources are likely to be stakeholders in a program - participants, other researchers, program staff, other community members, and so on.
Then we put all data in single framework & apply various statistical tools to find out the dynamic on the market.
During the analysis stage, feedback from the stakeholder groups would be compared to determine areas of agreement as well as areas of divergence
