

Key Insights
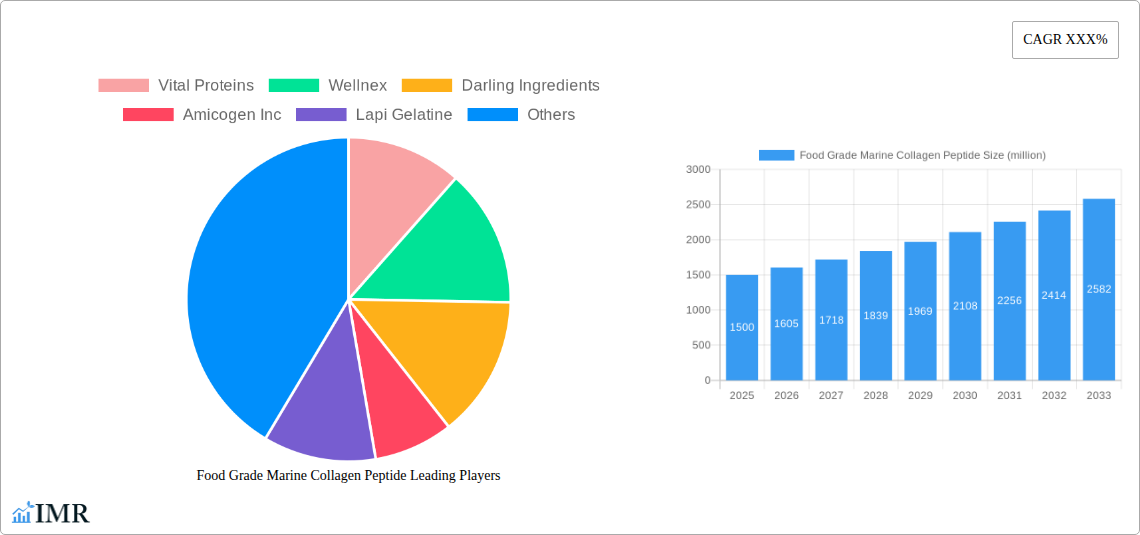
The global food grade marine collagen peptide market is projected for significant expansion, propelled by heightened consumer awareness of collagen's health advantages for skin, joints, and gut wellness. The increasing adoption of functional foods and beverages incorporating collagen peptides for enriched nutritional profiles further stimulates market growth. A projected Compound Annual Growth Rate (CAGR) of 14.9% from 2025 to 2033 signifies a substantial market opportunity. Key drivers include the development of novel product formulations, such as collagen-infused gummies, powders, and beverages, catering to diverse consumer preferences. Additionally, the growing demand for sustainably and ethically sourced marine collagen is influencing industry practices. While raw material price volatility and stringent regulatory frameworks present potential challenges, the overall market outlook remains optimistic. The market is segmented by product type (e.g., hydrolyzed collagen peptides, collagen hydrolysates), application (e.g., food and beverages, dietary supplements), and geography. Leading market participants, including Vital Proteins, Wellnex, and Rousselot, are actively engaged in product innovation and market expansion, fostering competition and shaping the market landscape.
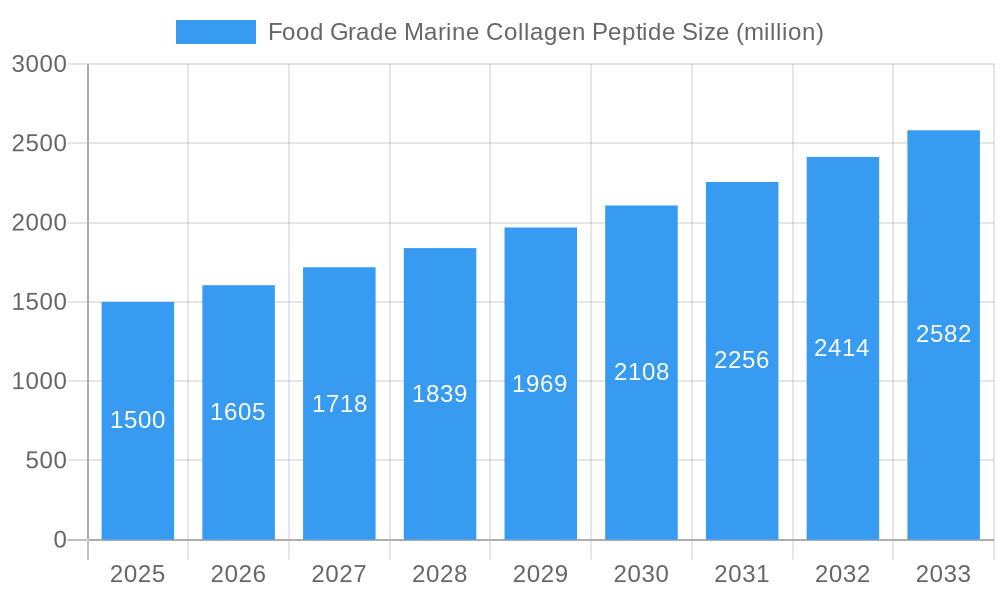
Food Grade Marine Collagen Peptide Market Size (In Million)
The current market size is estimated at 600.73 million in the base year 2025 and is anticipated to experience considerable growth. This expansion is attributed to rising disposable incomes, particularly in emerging economies within the Asia-Pacific region, alongside escalating health consciousness among consumers. The food and beverage application segment holds a dominant position due to the straightforward integration of collagen peptides into various food products and the prevailing trend of incorporating health-promoting ingredients into daily diets. The competitive environment features both established corporations and nascent companies prioritizing sustainability and distinctive product offerings. Future market success hinges on addressing challenges such as ensuring consistent product quality, mitigating potential allergen concerns, and fostering continuous innovation to meet evolving consumer demands.
Food Grade Marine Collagen Peptide Company Market Share
Food Grade Marine Collagen Peptide Market Report: 2019-2033
A comprehensive analysis of the food grade marine collagen peptide market, encompassing market dynamics, growth trends, competitive landscape, and future outlook. This report provides in-depth insights into the global food grade marine collagen peptide market, covering the period from 2019 to 2033. The study includes detailed analysis of market size, growth drivers, challenges, opportunities, and key players across various segments, including the parent market of collagen peptides and the child market of marine-sourced collagen. The report is essential for industry professionals, investors, and anyone seeking a complete understanding of this rapidly evolving market.
Food Grade Marine Collagen Peptide Market Dynamics & Structure
The global food grade marine collagen peptide market is characterized by moderate concentration, with key players holding significant market share. Technological innovation, particularly in extraction and purification processes, is a major driver. Stringent regulatory frameworks concerning food safety and labeling influence market dynamics. Competitive substitutes, such as plant-based protein alternatives, pose a challenge, but the unique benefits of marine collagen peptides, including biocompatibility and bioavailability, continue to drive demand. Market growth is fueled by increasing consumer awareness of health and wellness, particularly within the beauty and sports nutrition segments. M&A activity within the market has been moderate, with approximately xx deals recorded between 2019 and 2024, driven by consolidation and expansion strategies.
- Market Concentration: Moderately concentrated, with top 5 players holding approximately xx% market share in 2024.
- Technological Innovation: Focus on improved extraction methods, leading to higher purity and yield.
- Regulatory Landscape: Stringent food safety regulations and labeling requirements.
- Competitive Substitutes: Plant-based proteins and other collagen sources.
- End-User Demographics: Growing demand from health-conscious consumers and athletes.
- M&A Activity: xx deals recorded between 2019 and 2024 (estimated).
Food Grade Marine Collagen Peptide Growth Trends & Insights
The global food grade marine collagen peptide market experienced robust growth between 2019 and 2024, driven by increasing consumer demand for functional foods and supplements. The market size reached approximately $xx million in 2024, and is projected to reach $xx million by 2033, registering a CAGR of xx% during the forecast period (2025-2033). This growth is fueled by rising health awareness, increasing disposable incomes in developing economies, and the growing popularity of collagen-enhanced products in food and beverage applications. Technological advancements in extraction and processing techniques have led to improved product quality and efficiency, further fueling market expansion. Changing consumer preferences towards natural and sustainable products also contribute to market growth. Adoption rates for marine collagen peptides are increasing, particularly within the functional food and dietary supplement sectors.
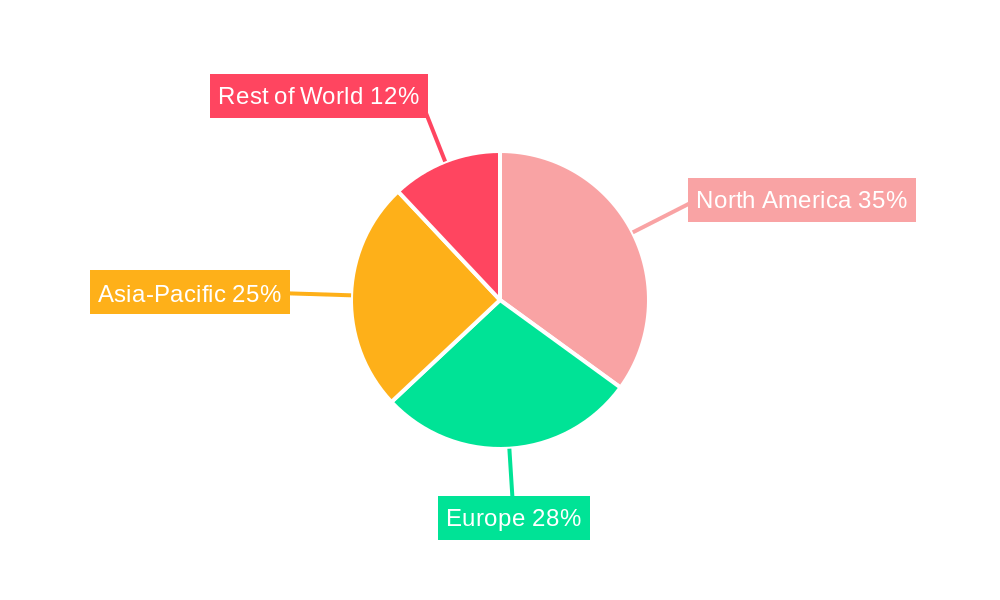
Dominant Regions, Countries, or Segments in Food Grade Marine Collagen Peptide
North America and Europe currently dominate the global food grade marine collagen peptide market, driven by high consumer awareness, strong regulatory frameworks, and established distribution channels. However, the Asia-Pacific region is anticipated to witness the fastest growth during the forecast period due to rising disposable incomes, expanding health and wellness markets, and increasing adoption of westernized dietary habits.
- Key Drivers in North America: High consumer awareness, established distribution networks, and strong regulatory frameworks.
- Key Drivers in Europe: Similar to North America, with a focus on premium and specialized product development.
- Key Drivers in Asia-Pacific: Rapidly increasing disposable incomes, and growing awareness of health benefits.
- Market Share: North America holds the largest market share (xx% in 2024), followed by Europe (xx%) and Asia-Pacific (xx%).
- Growth Potential: Asia-Pacific region shows the highest growth potential due to increasing demand for collagen products.
Food Grade Marine Collagen Peptide Product Landscape
The food grade marine collagen peptide market offers a range of products with varying molecular weights, purities, and functionalities, catering to different applications. Innovations focus on enhancing bioactivity, improving solubility, and creating more convenient delivery forms. Technological advancements in hydrolysis techniques and purification methods have resulted in products with superior quality and consistent performance, leading to improved consumer acceptance and broadened application possibilities. Unique selling propositions include enhanced bioavailability, improved skin health benefits, and joint support properties.
Key Drivers, Barriers & Challenges in Food Grade Marine Collagen Peptide
Key Drivers:
- Growing consumer demand for functional foods and supplements.
- Increasing awareness of the health benefits of collagen peptides.
- Technological advancements in extraction and processing techniques.
- Rising disposable incomes in emerging economies.
Challenges & Restraints:
- Fluctuations in raw material prices and supply chain disruptions (estimated impact: xx% reduction in production during 2022-2023 due to supply chain issues).
- Stringent regulatory requirements and labeling restrictions.
- Competition from other protein sources and alternative ingredients.
Emerging Opportunities in Food Grade Marine Collagen Peptide
Emerging opportunities lie in expanding into untapped markets, such as Latin America and Africa. The development of novel applications, such as incorporating marine collagen peptides into cosmeceutical products and functional beverages, also presents significant growth potential. Evolving consumer preferences toward clean-label and sustainable products will shape future market development.
Growth Accelerators in the Food Grade Marine Collagen Peptide Industry
Technological breakthroughs in extraction and processing methods, coupled with strategic partnerships between ingredient suppliers and food and beverage manufacturers, will drive long-term growth. Expansion into new geographic markets and the development of innovative product formulations will further accelerate market expansion. The increasing popularity of personalized nutrition and the growing adoption of direct-to-consumer models present substantial growth opportunities.
Key Players Shaping the Food Grade Marine Collagen Peptide Market
- Vital Proteins
- Wellnex
- Darling Ingredients
- Amicogen Inc
- Lapi Gelatine
- GELITA
- Nippi Collagen Peptides
- PB Leiner
- Nitta Gelatin
- Rousselot
Notable Milestones in Food Grade Marine Collagen Peptide Sector
- 2021: Launch of a new line of sustainably sourced marine collagen peptides by X company.
- 2022: Acquisition of a leading marine collagen peptide producer by Y company.
- 2023: Introduction of innovative collagen peptide delivery systems, leading to improved bioavailability.
- 2024: Publication of multiple clinical studies highlighting the health benefits of marine collagen peptides.
In-Depth Food Grade Marine Collagen Peptide Market Outlook
The future of the food grade marine collagen peptide market is bright, driven by continuous technological innovation, increasing consumer demand, and expansion into new markets. Strategic partnerships and collaborations between key players will further accelerate growth. The market is poised for significant expansion, with substantial opportunities for companies that invest in research and development, product innovation, and sustainable sourcing practices. The projected market size in 2033 presents a compelling investment opportunity.
Food Grade Marine Collagen Peptide Segmentation
-
1. Application
- 1.1. Food and Beverage
- 1.2. Drug
- 1.3. Health Products
- 1.4. Others
-
2. Type
- 2.1. Fish
- 2.2. Mussels
- 2.3. Seaweed
- 2.4. Others
Food Grade Marine Collagen Peptide Segmentation By Geography
-
1. North America
- 1.1. United States
- 1.2. Canada
- 1.3. Mexico
-
2. South America
- 2.1. Brazil
- 2.2. Argentina
- 2.3. Rest of South America
-
3. Europe
- 3.1. United Kingdom
- 3.2. Germany
- 3.3. France
- 3.4. Italy
- 3.5. Spain
- 3.6. Russia
- 3.7. Benelux
- 3.8. Nordics
- 3.9. Rest of Europe
-
4. Middle East & Africa
- 4.1. Turkey
- 4.2. Israel
- 4.3. GCC
- 4.4. North Africa
- 4.5. South Africa
- 4.6. Rest of Middle East & Africa
-
5. Asia Pacific
- 5.1. China
- 5.2. India
- 5.3. Japan
- 5.4. South Korea
- 5.5. ASEAN
- 5.6. Oceania
- 5.7. Rest of Asia Pacific
Food Grade Marine Collagen Peptide Regional Market Share
Geographic Coverage of Food Grade Marine Collagen Peptide
Food Grade Marine Collagen Peptide REPORT HIGHLIGHTS
| Aspects | Details |
|---|---|
| Study Period | 2020-2034 |
| Base Year | 2025 |
| Estimated Year | 2026 |
| Forecast Period | 2026-2034 |
| Historical Period | 2020-2025 |
| Growth Rate | CAGR of 14.9% from 2020-2034 |
| Segmentation |
|
Table of Contents
- 1. Introduction
- 1.1. Research Scope
- 1.2. Market Segmentation
- 1.3. Research Methodology
- 1.4. Definitions and Assumptions
- 2. Executive Summary
- 2.1. Introduction
- 3. Market Dynamics
- 3.1. Introduction
- 3.2. Market Drivers
- 3.3. Market Restrains
- 3.4. Market Trends
- 4. Market Factor Analysis
- 4.1. Porters Five Forces
- 4.2. Supply/Value Chain
- 4.3. PESTEL analysis
- 4.4. Market Entropy
- 4.5. Patent/Trademark Analysis
- 5. Global Food Grade Marine Collagen Peptide Analysis, Insights and Forecast, 2020-2032
- 5.1. Market Analysis, Insights and Forecast - by Application
- 5.1.1. Food and Beverage
- 5.1.2. Drug
- 5.1.3. Health Products
- 5.1.4. Others
- 5.2. Market Analysis, Insights and Forecast - by Type
- 5.2.1. Fish
- 5.2.2. Mussels
- 5.2.3. Seaweed
- 5.2.4. Others
- 5.3. Market Analysis, Insights and Forecast - by Region
- 5.3.1. North America
- 5.3.2. South America
- 5.3.3. Europe
- 5.3.4. Middle East & Africa
- 5.3.5. Asia Pacific
- 5.1. Market Analysis, Insights and Forecast - by Application
- 6. North America Food Grade Marine Collagen Peptide Analysis, Insights and Forecast, 2020-2032
- 6.1. Market Analysis, Insights and Forecast - by Application
- 6.1.1. Food and Beverage
- 6.1.2. Drug
- 6.1.3. Health Products
- 6.1.4. Others
- 6.2. Market Analysis, Insights and Forecast - by Type
- 6.2.1. Fish
- 6.2.2. Mussels
- 6.2.3. Seaweed
- 6.2.4. Others
- 6.1. Market Analysis, Insights and Forecast - by Application
- 7. South America Food Grade Marine Collagen Peptide Analysis, Insights and Forecast, 2020-2032
- 7.1. Market Analysis, Insights and Forecast - by Application
- 7.1.1. Food and Beverage
- 7.1.2. Drug
- 7.1.3. Health Products
- 7.1.4. Others
- 7.2. Market Analysis, Insights and Forecast - by Type
- 7.2.1. Fish
- 7.2.2. Mussels
- 7.2.3. Seaweed
- 7.2.4. Others
- 7.1. Market Analysis, Insights and Forecast - by Application
- 8. Europe Food Grade Marine Collagen Peptide Analysis, Insights and Forecast, 2020-2032
- 8.1. Market Analysis, Insights and Forecast - by Application
- 8.1.1. Food and Beverage
- 8.1.2. Drug
- 8.1.3. Health Products
- 8.1.4. Others
- 8.2. Market Analysis, Insights and Forecast - by Type
- 8.2.1. Fish
- 8.2.2. Mussels
- 8.2.3. Seaweed
- 8.2.4. Others
- 8.1. Market Analysis, Insights and Forecast - by Application
- 9. Middle East & Africa Food Grade Marine Collagen Peptide Analysis, Insights and Forecast, 2020-2032
- 9.1. Market Analysis, Insights and Forecast - by Application
- 9.1.1. Food and Beverage
- 9.1.2. Drug
- 9.1.3. Health Products
- 9.1.4. Others
- 9.2. Market Analysis, Insights and Forecast - by Type
- 9.2.1. Fish
- 9.2.2. Mussels
- 9.2.3. Seaweed
- 9.2.4. Others
- 9.1. Market Analysis, Insights and Forecast - by Application
- 10. Asia Pacific Food Grade Marine Collagen Peptide Analysis, Insights and Forecast, 2020-2032
- 10.1. Market Analysis, Insights and Forecast - by Application
- 10.1.1. Food and Beverage
- 10.1.2. Drug
- 10.1.3. Health Products
- 10.1.4. Others
- 10.2. Market Analysis, Insights and Forecast - by Type
- 10.2.1. Fish
- 10.2.2. Mussels
- 10.2.3. Seaweed
- 10.2.4. Others
- 10.1. Market Analysis, Insights and Forecast - by Application
- 11. Competitive Analysis
- 11.1. Global Market Share Analysis 2025
- 11.2. Company Profiles
- 11.2.1 Vital Proteins
- 11.2.1.1. Overview
- 11.2.1.2. Products
- 11.2.1.3. SWOT Analysis
- 11.2.1.4. Recent Developments
- 11.2.1.5. Financials (Based on Availability)
- 11.2.2 Wellnex
- 11.2.2.1. Overview
- 11.2.2.2. Products
- 11.2.2.3. SWOT Analysis
- 11.2.2.4. Recent Developments
- 11.2.2.5. Financials (Based on Availability)
- 11.2.3 Darling Ingredients
- 11.2.3.1. Overview
- 11.2.3.2. Products
- 11.2.3.3. SWOT Analysis
- 11.2.3.4. Recent Developments
- 11.2.3.5. Financials (Based on Availability)
- 11.2.4 Amicogen Inc
- 11.2.4.1. Overview
- 11.2.4.2. Products
- 11.2.4.3. SWOT Analysis
- 11.2.4.4. Recent Developments
- 11.2.4.5. Financials (Based on Availability)
- 11.2.5 Lapi Gelatine
- 11.2.5.1. Overview
- 11.2.5.2. Products
- 11.2.5.3. SWOT Analysis
- 11.2.5.4. Recent Developments
- 11.2.5.5. Financials (Based on Availability)
- 11.2.6 GELITA
- 11.2.6.1. Overview
- 11.2.6.2. Products
- 11.2.6.3. SWOT Analysis
- 11.2.6.4. Recent Developments
- 11.2.6.5. Financials (Based on Availability)
- 11.2.7 Nippi Collagen Peptides
- 11.2.7.1. Overview
- 11.2.7.2. Products
- 11.2.7.3. SWOT Analysis
- 11.2.7.4. Recent Developments
- 11.2.7.5. Financials (Based on Availability)
- 11.2.8 PB Leiner
- 11.2.8.1. Overview
- 11.2.8.2. Products
- 11.2.8.3. SWOT Analysis
- 11.2.8.4. Recent Developments
- 11.2.8.5. Financials (Based on Availability)
- 11.2.9 Nitta Gelatin
- 11.2.9.1. Overview
- 11.2.9.2. Products
- 11.2.9.3. SWOT Analysis
- 11.2.9.4. Recent Developments
- 11.2.9.5. Financials (Based on Availability)
- 11.2.10 Rousselot
- 11.2.10.1. Overview
- 11.2.10.2. Products
- 11.2.10.3. SWOT Analysis
- 11.2.10.4. Recent Developments
- 11.2.10.5. Financials (Based on Availability)
- 11.2.1 Vital Proteins
List of Figures
- Figure 1: Global Food Grade Marine Collagen Peptide Revenue Breakdown (million, %) by Region 2025 & 2033
- Figure 2: Global Food Grade Marine Collagen Peptide Volume Breakdown (K, %) by Region 2025 & 2033
- Figure 3: North America Food Grade Marine Collagen Peptide Revenue (million), by Application 2025 & 2033
- Figure 4: North America Food Grade Marine Collagen Peptide Volume (K), by Application 2025 & 2033
- Figure 5: North America Food Grade Marine Collagen Peptide Revenue Share (%), by Application 2025 & 2033
- Figure 6: North America Food Grade Marine Collagen Peptide Volume Share (%), by Application 2025 & 2033
- Figure 7: North America Food Grade Marine Collagen Peptide Revenue (million), by Type 2025 & 2033
- Figure 8: North America Food Grade Marine Collagen Peptide Volume (K), by Type 2025 & 2033
- Figure 9: North America Food Grade Marine Collagen Peptide Revenue Share (%), by Type 2025 & 2033
- Figure 10: North America Food Grade Marine Collagen Peptide Volume Share (%), by Type 2025 & 2033
- Figure 11: North America Food Grade Marine Collagen Peptide Revenue (million), by Country 2025 & 2033
- Figure 12: North America Food Grade Marine Collagen Peptide Volume (K), by Country 2025 & 2033
- Figure 13: North America Food Grade Marine Collagen Peptide Revenue Share (%), by Country 2025 & 2033
- Figure 14: North America Food Grade Marine Collagen Peptide Volume Share (%), by Country 2025 & 2033
- Figure 15: South America Food Grade Marine Collagen Peptide Revenue (million), by Application 2025 & 2033
- Figure 16: South America Food Grade Marine Collagen Peptide Volume (K), by Application 2025 & 2033
- Figure 17: South America Food Grade Marine Collagen Peptide Revenue Share (%), by Application 2025 & 2033
- Figure 18: South America Food Grade Marine Collagen Peptide Volume Share (%), by Application 2025 & 2033
- Figure 19: South America Food Grade Marine Collagen Peptide Revenue (million), by Type 2025 & 2033
- Figure 20: South America Food Grade Marine Collagen Peptide Volume (K), by Type 2025 & 2033
- Figure 21: South America Food Grade Marine Collagen Peptide Revenue Share (%), by Type 2025 & 2033
- Figure 22: South America Food Grade Marine Collagen Peptide Volume Share (%), by Type 2025 & 2033
- Figure 23: South America Food Grade Marine Collagen Peptide Revenue (million), by Country 2025 & 2033
- Figure 24: South America Food Grade Marine Collagen Peptide Volume (K), by Country 2025 & 2033
- Figure 25: South America Food Grade Marine Collagen Peptide Revenue Share (%), by Country 2025 & 2033
- Figure 26: South America Food Grade Marine Collagen Peptide Volume Share (%), by Country 2025 & 2033
- Figure 27: Europe Food Grade Marine Collagen Peptide Revenue (million), by Application 2025 & 2033
- Figure 28: Europe Food Grade Marine Collagen Peptide Volume (K), by Application 2025 & 2033
- Figure 29: Europe Food Grade Marine Collagen Peptide Revenue Share (%), by Application 2025 & 2033
- Figure 30: Europe Food Grade Marine Collagen Peptide Volume Share (%), by Application 2025 & 2033
- Figure 31: Europe Food Grade Marine Collagen Peptide Revenue (million), by Type 2025 & 2033
- Figure 32: Europe Food Grade Marine Collagen Peptide Volume (K), by Type 2025 & 2033
- Figure 33: Europe Food Grade Marine Collagen Peptide Revenue Share (%), by Type 2025 & 2033
- Figure 34: Europe Food Grade Marine Collagen Peptide Volume Share (%), by Type 2025 & 2033
- Figure 35: Europe Food Grade Marine Collagen Peptide Revenue (million), by Country 2025 & 2033
- Figure 36: Europe Food Grade Marine Collagen Peptide Volume (K), by Country 2025 & 2033
- Figure 37: Europe Food Grade Marine Collagen Peptide Revenue Share (%), by Country 2025 & 2033
- Figure 38: Europe Food Grade Marine Collagen Peptide Volume Share (%), by Country 2025 & 2033
- Figure 39: Middle East & Africa Food Grade Marine Collagen Peptide Revenue (million), by Application 2025 & 2033
- Figure 40: Middle East & Africa Food Grade Marine Collagen Peptide Volume (K), by Application 2025 & 2033
- Figure 41: Middle East & Africa Food Grade Marine Collagen Peptide Revenue Share (%), by Application 2025 & 2033
- Figure 42: Middle East & Africa Food Grade Marine Collagen Peptide Volume Share (%), by Application 2025 & 2033
- Figure 43: Middle East & Africa Food Grade Marine Collagen Peptide Revenue (million), by Type 2025 & 2033
- Figure 44: Middle East & Africa Food Grade Marine Collagen Peptide Volume (K), by Type 2025 & 2033
- Figure 45: Middle East & Africa Food Grade Marine Collagen Peptide Revenue Share (%), by Type 2025 & 2033
- Figure 46: Middle East & Africa Food Grade Marine Collagen Peptide Volume Share (%), by Type 2025 & 2033
- Figure 47: Middle East & Africa Food Grade Marine Collagen Peptide Revenue (million), by Country 2025 & 2033
- Figure 48: Middle East & Africa Food Grade Marine Collagen Peptide Volume (K), by Country 2025 & 2033
- Figure 49: Middle East & Africa Food Grade Marine Collagen Peptide Revenue Share (%), by Country 2025 & 2033
- Figure 50: Middle East & Africa Food Grade Marine Collagen Peptide Volume Share (%), by Country 2025 & 2033
- Figure 51: Asia Pacific Food Grade Marine Collagen Peptide Revenue (million), by Application 2025 & 2033
- Figure 52: Asia Pacific Food Grade Marine Collagen Peptide Volume (K), by Application 2025 & 2033
- Figure 53: Asia Pacific Food Grade Marine Collagen Peptide Revenue Share (%), by Application 2025 & 2033
- Figure 54: Asia Pacific Food Grade Marine Collagen Peptide Volume Share (%), by Application 2025 & 2033
- Figure 55: Asia Pacific Food Grade Marine Collagen Peptide Revenue (million), by Type 2025 & 2033
- Figure 56: Asia Pacific Food Grade Marine Collagen Peptide Volume (K), by Type 2025 & 2033
- Figure 57: Asia Pacific Food Grade Marine Collagen Peptide Revenue Share (%), by Type 2025 & 2033
- Figure 58: Asia Pacific Food Grade Marine Collagen Peptide Volume Share (%), by Type 2025 & 2033
- Figure 59: Asia Pacific Food Grade Marine Collagen Peptide Revenue (million), by Country 2025 & 2033
- Figure 60: Asia Pacific Food Grade Marine Collagen Peptide Volume (K), by Country 2025 & 2033
- Figure 61: Asia Pacific Food Grade Marine Collagen Peptide Revenue Share (%), by Country 2025 & 2033
- Figure 62: Asia Pacific Food Grade Marine Collagen Peptide Volume Share (%), by Country 2025 & 2033
List of Tables
- Table 1: Global Food Grade Marine Collagen Peptide Revenue million Forecast, by Application 2020 & 2033
- Table 2: Global Food Grade Marine Collagen Peptide Volume K Forecast, by Application 2020 & 2033
- Table 3: Global Food Grade Marine Collagen Peptide Revenue million Forecast, by Type 2020 & 2033
- Table 4: Global Food Grade Marine Collagen Peptide Volume K Forecast, by Type 2020 & 2033
- Table 5: Global Food Grade Marine Collagen Peptide Revenue million Forecast, by Region 2020 & 2033
- Table 6: Global Food Grade Marine Collagen Peptide Volume K Forecast, by Region 2020 & 2033
- Table 7: Global Food Grade Marine Collagen Peptide Revenue million Forecast, by Application 2020 & 2033
- Table 8: Global Food Grade Marine Collagen Peptide Volume K Forecast, by Application 2020 & 2033
- Table 9: Global Food Grade Marine Collagen Peptide Revenue million Forecast, by Type 2020 & 2033
- Table 10: Global Food Grade Marine Collagen Peptide Volume K Forecast, by Type 2020 & 2033
- Table 11: Global Food Grade Marine Collagen Peptide Revenue million Forecast, by Country 2020 & 2033
- Table 12: Global Food Grade Marine Collagen Peptide Volume K Forecast, by Country 2020 & 2033
- Table 13: United States Food Grade Marine Collagen Peptide Revenue (million) Forecast, by Application 2020 & 2033
- Table 14: United States Food Grade Marine Collagen Peptide Volume (K) Forecast, by Application 2020 & 2033
- Table 15: Canada Food Grade Marine Collagen Peptide Revenue (million) Forecast, by Application 2020 & 2033
- Table 16: Canada Food Grade Marine Collagen Peptide Volume (K) Forecast, by Application 2020 & 2033
- Table 17: Mexico Food Grade Marine Collagen Peptide Revenue (million) Forecast, by Application 2020 & 2033
- Table 18: Mexico Food Grade Marine Collagen Peptide Volume (K) Forecast, by Application 2020 & 2033
- Table 19: Global Food Grade Marine Collagen Peptide Revenue million Forecast, by Application 2020 & 2033
- Table 20: Global Food Grade Marine Collagen Peptide Volume K Forecast, by Application 2020 & 2033
- Table 21: Global Food Grade Marine Collagen Peptide Revenue million Forecast, by Type 2020 & 2033
- Table 22: Global Food Grade Marine Collagen Peptide Volume K Forecast, by Type 2020 & 2033
- Table 23: Global Food Grade Marine Collagen Peptide Revenue million Forecast, by Country 2020 & 2033
- Table 24: Global Food Grade Marine Collagen Peptide Volume K Forecast, by Country 2020 & 2033
- Table 25: Brazil Food Grade Marine Collagen Peptide Revenue (million) Forecast, by Application 2020 & 2033
- Table 26: Brazil Food Grade Marine Collagen Peptide Volume (K) Forecast, by Application 2020 & 2033
- Table 27: Argentina Food Grade Marine Collagen Peptide Revenue (million) Forecast, by Application 2020 & 2033
- Table 28: Argentina Food Grade Marine Collagen Peptide Volume (K) Forecast, by Application 2020 & 2033
- Table 29: Rest of South America Food Grade Marine Collagen Peptide Revenue (million) Forecast, by Application 2020 & 2033
- Table 30: Rest of South America Food Grade Marine Collagen Peptide Volume (K) Forecast, by Application 2020 & 2033
- Table 31: Global Food Grade Marine Collagen Peptide Revenue million Forecast, by Application 2020 & 2033
- Table 32: Global Food Grade Marine Collagen Peptide Volume K Forecast, by Application 2020 & 2033
- Table 33: Global Food Grade Marine Collagen Peptide Revenue million Forecast, by Type 2020 & 2033
- Table 34: Global Food Grade Marine Collagen Peptide Volume K Forecast, by Type 2020 & 2033
- Table 35: Global Food Grade Marine Collagen Peptide Revenue million Forecast, by Country 2020 & 2033
- Table 36: Global Food Grade Marine Collagen Peptide Volume K Forecast, by Country 2020 & 2033
- Table 37: United Kingdom Food Grade Marine Collagen Peptide Revenue (million) Forecast, by Application 2020 & 2033
- Table 38: United Kingdom Food Grade Marine Collagen Peptide Volume (K) Forecast, by Application 2020 & 2033
- Table 39: Germany Food Grade Marine Collagen Peptide Revenue (million) Forecast, by Application 2020 & 2033
- Table 40: Germany Food Grade Marine Collagen Peptide Volume (K) Forecast, by Application 2020 & 2033
- Table 41: France Food Grade Marine Collagen Peptide Revenue (million) Forecast, by Application 2020 & 2033
- Table 42: France Food Grade Marine Collagen Peptide Volume (K) Forecast, by Application 2020 & 2033
- Table 43: Italy Food Grade Marine Collagen Peptide Revenue (million) Forecast, by Application 2020 & 2033
- Table 44: Italy Food Grade Marine Collagen Peptide Volume (K) Forecast, by Application 2020 & 2033
- Table 45: Spain Food Grade Marine Collagen Peptide Revenue (million) Forecast, by Application 2020 & 2033
- Table 46: Spain Food Grade Marine Collagen Peptide Volume (K) Forecast, by Application 2020 & 2033
- Table 47: Russia Food Grade Marine Collagen Peptide Revenue (million) Forecast, by Application 2020 & 2033
- Table 48: Russia Food Grade Marine Collagen Peptide Volume (K) Forecast, by Application 2020 & 2033
- Table 49: Benelux Food Grade Marine Collagen Peptide Revenue (million) Forecast, by Application 2020 & 2033
- Table 50: Benelux Food Grade Marine Collagen Peptide Volume (K) Forecast, by Application 2020 & 2033
- Table 51: Nordics Food Grade Marine Collagen Peptide Revenue (million) Forecast, by Application 2020 & 2033
- Table 52: Nordics Food Grade Marine Collagen Peptide Volume (K) Forecast, by Application 2020 & 2033
- Table 53: Rest of Europe Food Grade Marine Collagen Peptide Revenue (million) Forecast, by Application 2020 & 2033
- Table 54: Rest of Europe Food Grade Marine Collagen Peptide Volume (K) Forecast, by Application 2020 & 2033
- Table 55: Global Food Grade Marine Collagen Peptide Revenue million Forecast, by Application 2020 & 2033
- Table 56: Global Food Grade Marine Collagen Peptide Volume K Forecast, by Application 2020 & 2033
- Table 57: Global Food Grade Marine Collagen Peptide Revenue million Forecast, by Type 2020 & 2033
- Table 58: Global Food Grade Marine Collagen Peptide Volume K Forecast, by Type 2020 & 2033
- Table 59: Global Food Grade Marine Collagen Peptide Revenue million Forecast, by Country 2020 & 2033
- Table 60: Global Food Grade Marine Collagen Peptide Volume K Forecast, by Country 2020 & 2033
- Table 61: Turkey Food Grade Marine Collagen Peptide Revenue (million) Forecast, by Application 2020 & 2033
- Table 62: Turkey Food Grade Marine Collagen Peptide Volume (K) Forecast, by Application 2020 & 2033
- Table 63: Israel Food Grade Marine Collagen Peptide Revenue (million) Forecast, by Application 2020 & 2033
- Table 64: Israel Food Grade Marine Collagen Peptide Volume (K) Forecast, by Application 2020 & 2033
- Table 65: GCC Food Grade Marine Collagen Peptide Revenue (million) Forecast, by Application 2020 & 2033
- Table 66: GCC Food Grade Marine Collagen Peptide Volume (K) Forecast, by Application 2020 & 2033
- Table 67: North Africa Food Grade Marine Collagen Peptide Revenue (million) Forecast, by Application 2020 & 2033
- Table 68: North Africa Food Grade Marine Collagen Peptide Volume (K) Forecast, by Application 2020 & 2033
- Table 69: South Africa Food Grade Marine Collagen Peptide Revenue (million) Forecast, by Application 2020 & 2033
- Table 70: South Africa Food Grade Marine Collagen Peptide Volume (K) Forecast, by Application 2020 & 2033
- Table 71: Rest of Middle East & Africa Food Grade Marine Collagen Peptide Revenue (million) Forecast, by Application 2020 & 2033
- Table 72: Rest of Middle East & Africa Food Grade Marine Collagen Peptide Volume (K) Forecast, by Application 2020 & 2033
- Table 73: Global Food Grade Marine Collagen Peptide Revenue million Forecast, by Application 2020 & 2033
- Table 74: Global Food Grade Marine Collagen Peptide Volume K Forecast, by Application 2020 & 2033
- Table 75: Global Food Grade Marine Collagen Peptide Revenue million Forecast, by Type 2020 & 2033
- Table 76: Global Food Grade Marine Collagen Peptide Volume K Forecast, by Type 2020 & 2033
- Table 77: Global Food Grade Marine Collagen Peptide Revenue million Forecast, by Country 2020 & 2033
- Table 78: Global Food Grade Marine Collagen Peptide Volume K Forecast, by Country 2020 & 2033
- Table 79: China Food Grade Marine Collagen Peptide Revenue (million) Forecast, by Application 2020 & 2033
- Table 80: China Food Grade Marine Collagen Peptide Volume (K) Forecast, by Application 2020 & 2033
- Table 81: India Food Grade Marine Collagen Peptide Revenue (million) Forecast, by Application 2020 & 2033
- Table 82: India Food Grade Marine Collagen Peptide Volume (K) Forecast, by Application 2020 & 2033
- Table 83: Japan Food Grade Marine Collagen Peptide Revenue (million) Forecast, by Application 2020 & 2033
- Table 84: Japan Food Grade Marine Collagen Peptide Volume (K) Forecast, by Application 2020 & 2033
- Table 85: South Korea Food Grade Marine Collagen Peptide Revenue (million) Forecast, by Application 2020 & 2033
- Table 86: South Korea Food Grade Marine Collagen Peptide Volume (K) Forecast, by Application 2020 & 2033
- Table 87: ASEAN Food Grade Marine Collagen Peptide Revenue (million) Forecast, by Application 2020 & 2033
- Table 88: ASEAN Food Grade Marine Collagen Peptide Volume (K) Forecast, by Application 2020 & 2033
- Table 89: Oceania Food Grade Marine Collagen Peptide Revenue (million) Forecast, by Application 2020 & 2033
- Table 90: Oceania Food Grade Marine Collagen Peptide Volume (K) Forecast, by Application 2020 & 2033
- Table 91: Rest of Asia Pacific Food Grade Marine Collagen Peptide Revenue (million) Forecast, by Application 2020 & 2033
- Table 92: Rest of Asia Pacific Food Grade Marine Collagen Peptide Volume (K) Forecast, by Application 2020 & 2033
Frequently Asked Questions
1. What is the projected Compound Annual Growth Rate (CAGR) of the Food Grade Marine Collagen Peptide?
The projected CAGR is approximately 14.9%.
2. Which companies are prominent players in the Food Grade Marine Collagen Peptide?
Key companies in the market include Vital Proteins, Wellnex, Darling Ingredients, Amicogen Inc, Lapi Gelatine, GELITA, Nippi Collagen Peptides, PB Leiner, Nitta Gelatin, Rousselot.
3. What are the main segments of the Food Grade Marine Collagen Peptide?
The market segments include Application, Type.
4. Can you provide details about the market size?
The market size is estimated to be USD 600.73 million as of 2022.
5. What are some drivers contributing to market growth?
N/A
6. What are the notable trends driving market growth?
N/A
7. Are there any restraints impacting market growth?
N/A
8. Can you provide examples of recent developments in the market?
N/A
9. What pricing options are available for accessing the report?
Pricing options include single-user, multi-user, and enterprise licenses priced at USD 3950.00, USD 5925.00, and USD 7900.00 respectively.
10. Is the market size provided in terms of value or volume?
The market size is provided in terms of value, measured in million and volume, measured in K.
11. Are there any specific market keywords associated with the report?
Yes, the market keyword associated with the report is "Food Grade Marine Collagen Peptide," which aids in identifying and referencing the specific market segment covered.
12. How do I determine which pricing option suits my needs best?
The pricing options vary based on user requirements and access needs. Individual users may opt for single-user licenses, while businesses requiring broader access may choose multi-user or enterprise licenses for cost-effective access to the report.
13. Are there any additional resources or data provided in the Food Grade Marine Collagen Peptide report?
While the report offers comprehensive insights, it's advisable to review the specific contents or supplementary materials provided to ascertain if additional resources or data are available.
14. How can I stay updated on further developments or reports in the Food Grade Marine Collagen Peptide?
To stay informed about further developments, trends, and reports in the Food Grade Marine Collagen Peptide, consider subscribing to industry newsletters, following relevant companies and organizations, or regularly checking reputable industry news sources and publications.
Methodology
Step 1 - Identification of Relevant Samples Size from Population Database


Step 2 - Approaches for Defining Global Market Size (Value, Volume* & Price*)

Note*: In applicable scenarios
Step 3 - Data Sources
Primary Research
- Web Analytics
- Survey Reports
- Research Institute
- Latest Research Reports
- Opinion Leaders
Secondary Research
- Annual Reports
- White Paper
- Latest Press Release
- Industry Association
- Paid Database
- Investor Presentations

Step 4 - Data Triangulation
Involves using different sources of information in order to increase the validity of a study
These sources are likely to be stakeholders in a program - participants, other researchers, program staff, other community members, and so on.
Then we put all data in single framework & apply various statistical tools to find out the dynamic on the market.
During the analysis stage, feedback from the stakeholder groups would be compared to determine areas of agreement as well as areas of divergence