

Key Insights
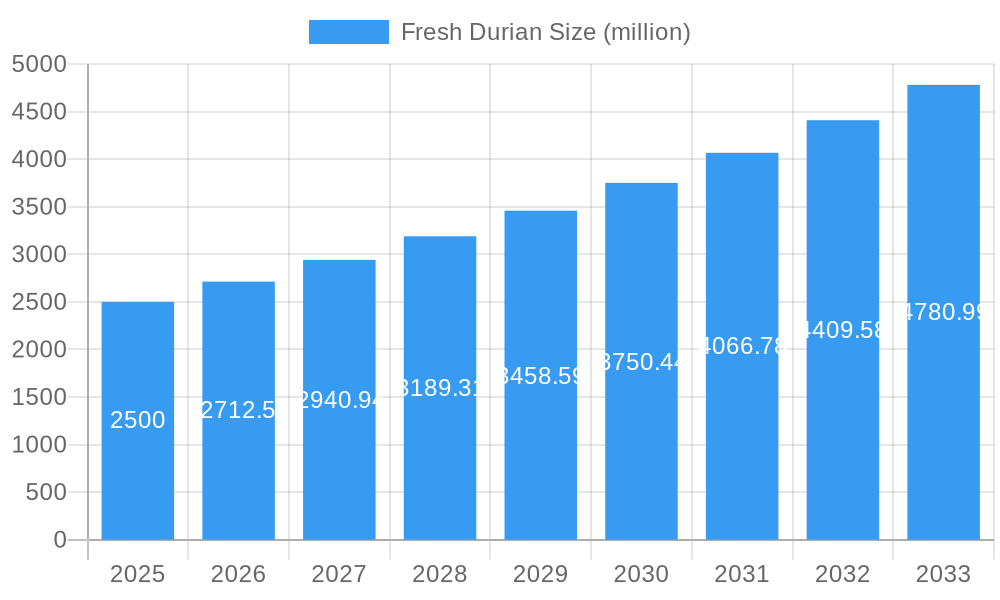
The global Fresh Durian market is poised for significant expansion, projected to reach an estimated market size of approximately $2,500 million by 2025, with a compelling Compound Annual Growth Rate (CAGR) of around 8.5% anticipated for the forecast period of 2025-2033. This robust growth trajectory is primarily propelled by escalating consumer demand for exotic and nutrient-rich fruits, particularly in emerging economies. The increasing popularity of durian's unique flavor profile, coupled with a growing awareness of its perceived health benefits, is a major driver. Furthermore, advancements in cultivation techniques, improved logistics and cold chain infrastructure, and the rise of e-commerce platforms facilitating direct-to-consumer sales are all contributing to market accessibility and sales volume. The market is also benefiting from a growing trend of culinary exploration and a rising middle class with increased disposable income willing to spend on premium food products. The diverse range of durian varieties, including popular ones like Musang King, Golden Pillow, and Red Prawn, caters to a broad spectrum of consumer preferences, further fueling market penetration.
Fresh Durian Market Size (In Billion)
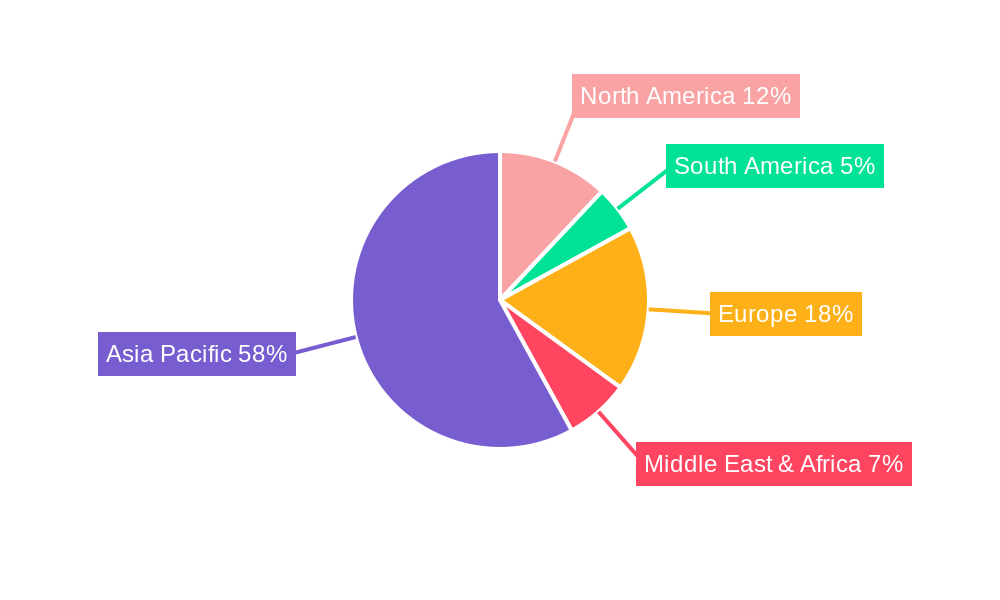
The market segmentation analysis reveals distinct opportunities across various applications and types. The Food Processing Plants segment, alongside the Fruit Shop application, is expected to witness substantial growth, driven by the increasing use of durian in value-added products such as desserts, ice cream, and beverages. While premium varieties like Musang King command higher prices and attract a dedicated consumer base, the availability of other types ensures broader market appeal. Geographically, the Asia Pacific region is expected to dominate the market, owing to its established durian cultivation and consumption habits, with China and ASEAN countries leading the demand. However, North America and Europe are emerging as significant growth markets, driven by increasing expatriate populations, adventurous food consumers, and growing interest in tropical fruits. Challenges such as the fruit's pungent aroma, its relatively short shelf life, and the complexities of international trade regulations remain factors to be monitored, but the overall outlook for the fresh durian market is exceptionally positive.
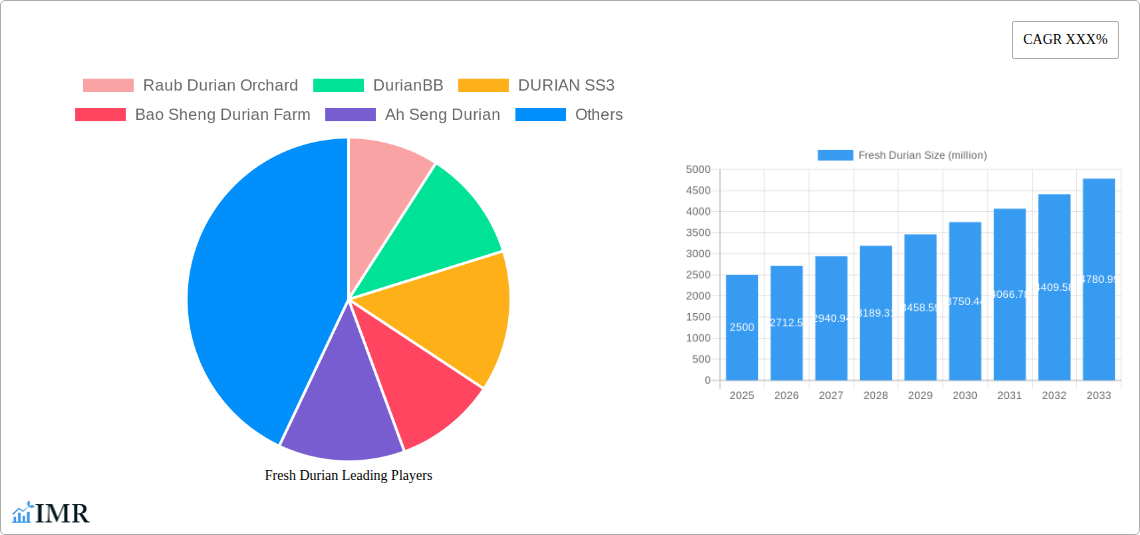
Fresh Durian Company Market Share
Unlocking the King of Fruits: Comprehensive Fresh Durian Market Report 2019-2033
This in-depth report offers a strategic analysis of the global Fresh Durian Market, providing crucial insights for industry professionals, investors, and stakeholders. With a focus on market dynamics, growth trajectories, regional dominance, product innovation, and key players, this report equips you with the knowledge to navigate the evolving landscape of this premium fruit. Our analysis spans from 2019 to 2033, with a base year of 2025, offering both historical context and forward-looking projections.
Fresh Durian Market Dynamics & Structure
The Fresh Durian Market exhibits a moderately concentrated structure, with a few key players dominating production and distribution in established regions, while numerous smaller entities contribute to regional supply and niche markets. Technological innovation is primarily driven by advancements in cultivation techniques, post-harvest management, and cold chain logistics, aimed at improving yield, quality, and shelf-life. Regulatory frameworks, particularly concerning food safety standards, import/export regulations, and agricultural subsidies, play a significant role in shaping market access and operational costs. Competitive product substitutes, such as other exotic fruits and processed durian products, exert some influence, but the unique sensory profile of fresh durian ensures its distinct market position. End-user demographics are increasingly diverse, encompassing affluent consumers, culinary enthusiasts, and a growing segment of health-conscious individuals attracted to its nutritional value. Mergers and Acquisitions (M&A) trends are moderately active, primarily focused on consolidating supply chains, acquiring prime cultivation land, and expanding distribution networks. For instance, recent M&A activities have seen larger players acquiring smaller orchards to secure supply and integrate downstream processing capabilities.
- Market Concentration: Moderately concentrated with a blend of large-scale producers and numerous smaller players.
- Technological Innovation Drivers: Improved cultivation, post-harvest handling, and cold chain logistics.
- Regulatory Frameworks: Food safety, import/export regulations, and agricultural policies.
- Competitive Substitutes: Other exotic fruits, processed durian products.
- End-User Demographics: Affluent consumers, culinary enthusiasts, health-conscious individuals.
- M&A Trends: Consolidation of supply chains, land acquisition, distribution network expansion. Anticipated M&A deal volume: 5-10 deals annually between 2025-2033.
Fresh Durian Growth Trends & Insights
The Fresh Durian Market is poised for robust expansion, driven by increasing consumer demand for premium and exotic fruits, coupled with a growing appreciation for its unique flavor and nutritional benefits. The market size is projected to witness a Compound Annual Growth Rate (CAGR) of approximately 8.5% between 2025 and 2033, escalating from an estimated XX million units in 2025 to XX million units by 2033. Adoption rates for premium durian varieties, such as Musang King and Golden Pillow, are accelerating, particularly in emerging markets. Technological disruptions are playing a pivotal role, with advancements in hydroponic farming, precision agriculture, and advanced packaging solutions enhancing production efficiency and extending the fruit's availability. Consumer behavior shifts are characterized by a heightened focus on provenance, sustainability, and the "farm-to-table" experience. This trend is fueling demand for organically grown and ethically sourced durians. Online retail platforms and direct-to-consumer models are gaining traction, facilitating wider market reach and offering consumers greater convenience. The increasing popularity of durian-themed cafes and desserts further bolsters consumption. The global supply chain is continuously being optimized to reduce transit times and spoilage, thereby increasing the availability of high-quality fresh durian in markets far from its origin. Educational campaigns highlighting durian's nutritional profile and culinary versatility are also contributing to its growing acceptance and demand.
Dominant Regions, Countries, or Segments in Fresh Durian
The Southeast Asian region, particularly Malaysia and Thailand, undeniably dominates the Fresh Durian Market, driven by ideal climatic conditions for cultivation and a deeply entrenched cultural appreciation for the fruit. Malaysia, with its established durian orchards and commitment to quality, consistently leads in the production of premium varieties like Musang King and Red Prawn. Thailand, a significant producer, excels in varieties such as Mon Thong, catering to both domestic and international markets. The Application segment of Fruit Shops is the primary driver of market growth, accounting for an estimated 45% of the total market share in 2025. These outlets cater directly to end consumers seeking fresh, high-quality durian. The Type segment of Musang King is a significant growth propeller, representing approximately 30% of the market share in 2025 and projected to grow at a CAGR of 10% through 2033, owing to its superior taste and texture.
- Leading Region: Southeast Asia (Malaysia, Thailand)
- Key Drivers: Favorable climate, established cultivation practices, strong domestic demand, export capabilities.
- Market Share (Regional): ~70% of global production.
- Dominant Country: Malaysia
- Key Drivers: High-quality durian varieties (Musang King, Red Prawn), sophisticated cultivation techniques, strong export focus.
- Market Share (Country): ~40% of regional production.
- Dominant Application Segment: Fruit Shops
- Key Drivers: Direct consumer access, demand for fresh produce, premium product positioning.
- Projected Market Share (2025): 45 million units.
- Dominant Type Segment: Musang King
- Key Drivers: Superior taste and texture, strong consumer preference, premium pricing potential.
- Projected Market Share (2025): 30 million units.
- CAGR (2025-2033): 10%.
Fresh Durian Product Landscape
The Fresh Durian product landscape is characterized by a focus on varietal diversity and quality enhancement. Innovations revolve around cultivating specific durian types known for their distinct flavor profiles and textures, such as the creamy Musang King, the sweet Golden Pillow, and the complex XO. Post-harvest technologies, including controlled atmosphere storage and advanced ethylene management, are crucial for extending shelf life and maintaining freshness during transit. The primary application remains direct consumption as fresh fruit, but its increasing use in high-end bakeries and food processing plants for specialty products like durian ice cream, pastries, and artisanal confections is noteworthy. Performance metrics are largely centered on sensory appeal (taste, aroma, texture), ripeness, and absence of blemishes.
Key Drivers, Barriers & Challenges in Fresh Durian
Key Drivers:
- Growing Demand for Exotic Fruits: Increasing global consumer appetite for unique and premium fruit experiences.
- Premiumization and Health Consciousness: Durian's perceived health benefits and its status as a luxury fruit.
- Technological Advancements: Improved cultivation and cold chain logistics enhance availability and quality.
- Emerging Market Growth: Rising disposable incomes in Asia and other regions fuel demand.
Barriers & Challenges:
- Perishable Nature: Short shelf life necessitates efficient and rapid supply chains.
- Seasonal Availability: Production is often tied to specific harvest seasons, impacting consistent supply.
- Logistical Complexities: The strong aroma and delicate nature pose challenges in transportation and storage.
- Regulatory Hurdles: Strict import/export regulations and quarantine measures in various countries.
- Competition from Processed Products: While fresh durian is premium, processed alternatives can offer wider availability and longer shelf life.
- Supply Chain Disruptions: Weather events, disease outbreaks, and geopolitical factors can impact supply. Estimated impact of supply chain disruptions: XX% loss in potential market value annually.
Emerging Opportunities in Fresh Durian
Emerging opportunities lie in expanding into untapped markets in North America and Europe, where consumer awareness is growing. The development of specialized durian e-commerce platforms, offering subscription boxes and direct-to-consumer sales, can cater to niche demand. Innovations in value-added products, such as premium durian pastes and dried durian chips with extended shelf life, can tap into new consumer segments. Sustainable and organic durian cultivation practices are gaining traction, offering a competitive advantage and appealing to environmentally conscious consumers. Furthermore, strategic partnerships with high-end restaurants and hotels can elevate durian's premium perception.
Growth Accelerators in the Fresh Durian Industry
The long-term growth of the Fresh Durian industry will be significantly accelerated by advancements in genetic research to develop more disease-resistant and higher-yielding durian varieties. Strategic partnerships between growers, logistics providers, and retailers will be crucial for optimizing the supply chain and reducing post-harvest losses. Furthermore, aggressive marketing campaigns focusing on durian's unique health benefits and culinary versatility, particularly in non-traditional markets, will drive broader consumer adoption. Investment in advanced cold chain infrastructure and smart packaging solutions will be critical for maintaining product quality across longer supply chains, effectively expanding the global reach of fresh durian.
Key Players Shaping the Fresh Durian Market
- Raub Durian Orchard
- DurianBB
- DURIAN SS3
- Bao Sheng Durian Farm
- Ah Seng Durian
- Durian366
- Mon Thong Durian
- Golden Pillow Durian
- DOKJIKI Durian
- Siam Durian
- Malas Durian
- Davao Durian
- Vinh Kim Durian
Notable Milestones in Fresh Durian Sector
- 2019: Increased investment in precision farming techniques in Malaysian durian orchards.
- 2020: Development of advanced ethylene scrubbing technologies to extend durian shelf life.
- 2021: Significant growth in online durian sales platforms, particularly in China and Southeast Asia.
- 2022: Introduction of temperature-controlled air cargo solutions for durian exports.
- 2023: Expansion of durian cultivation into new regions with suitable climates, such as parts of Australia.
- 2024: Growing consumer interest in sustainably and organically produced durian.
- 2025 (Estimated): Increased focus on traceability and blockchain technology for durian supply chains.
In-Depth Fresh Durian Market Outlook
The future outlook for the Fresh Durian Market is exceptionally promising, driven by a confluence of escalating consumer demand, technological innovation, and expanding market reach. Growth accelerators such as genetic research for superior varietals and optimized supply chain collaborations will solidify its position. Strategic marketing efforts targeting new demographics and regions, coupled with significant investments in cold chain infrastructure, will unlock unprecedented growth potential. The market is set to witness a sustained expansion, catering to a global palate eager for the "King of Fruits."
Fresh Durian Segmentation
-
1. Application
- 1.1. Fruit Shop
- 1.2. Bakery
- 1.3. Food Processing Plants
- 1.4. Other
-
2. Type
- 2.1. Musang King
- 2.2. Golden Pillow
- 2.3. XO
- 2.4. Red Prawn
- 2.5. Other
Fresh Durian Segmentation By Geography
-
1. North America
- 1.1. United States
- 1.2. Canada
- 1.3. Mexico
-
2. South America
- 2.1. Brazil
- 2.2. Argentina
- 2.3. Rest of South America
-
3. Europe
- 3.1. United Kingdom
- 3.2. Germany
- 3.3. France
- 3.4. Italy
- 3.5. Spain
- 3.6. Russia
- 3.7. Benelux
- 3.8. Nordics
- 3.9. Rest of Europe
-
4. Middle East & Africa
- 4.1. Turkey
- 4.2. Israel
- 4.3. GCC
- 4.4. North Africa
- 4.5. South Africa
- 4.6. Rest of Middle East & Africa
-
5. Asia Pacific
- 5.1. China
- 5.2. India
- 5.3. Japan
- 5.4. South Korea
- 5.5. ASEAN
- 5.6. Oceania
- 5.7. Rest of Asia Pacific
Fresh Durian Regional Market Share
Geographic Coverage of Fresh Durian
Fresh Durian REPORT HIGHLIGHTS
| Aspects | Details |
|---|---|
| Study Period | 2020-2034 |
| Base Year | 2025 |
| Estimated Year | 2026 |
| Forecast Period | 2026-2034 |
| Historical Period | 2020-2025 |
| Growth Rate | CAGR of 5.6% from 2020-2034 |
| Segmentation |
|
Table of Contents
- 1. Introduction
- 1.1. Research Scope
- 1.2. Market Segmentation
- 1.3. Research Methodology
- 1.4. Definitions and Assumptions
- 2. Executive Summary
- 2.1. Introduction
- 3. Market Dynamics
- 3.1. Introduction
- 3.2. Market Drivers
- 3.3. Market Restrains
- 3.4. Market Trends
- 4. Market Factor Analysis
- 4.1. Porters Five Forces
- 4.2. Supply/Value Chain
- 4.3. PESTEL analysis
- 4.4. Market Entropy
- 4.5. Patent/Trademark Analysis
- 5. Global Fresh Durian Analysis, Insights and Forecast, 2020-2032
- 5.1. Market Analysis, Insights and Forecast - by Application
- 5.1.1. Fruit Shop
- 5.1.2. Bakery
- 5.1.3. Food Processing Plants
- 5.1.4. Other
- 5.2. Market Analysis, Insights and Forecast - by Type
- 5.2.1. Musang King
- 5.2.2. Golden Pillow
- 5.2.3. XO
- 5.2.4. Red Prawn
- 5.2.5. Other
- 5.3. Market Analysis, Insights and Forecast - by Region
- 5.3.1. North America
- 5.3.2. South America
- 5.3.3. Europe
- 5.3.4. Middle East & Africa
- 5.3.5. Asia Pacific
- 5.1. Market Analysis, Insights and Forecast - by Application
- 6. North America Fresh Durian Analysis, Insights and Forecast, 2020-2032
- 6.1. Market Analysis, Insights and Forecast - by Application
- 6.1.1. Fruit Shop
- 6.1.2. Bakery
- 6.1.3. Food Processing Plants
- 6.1.4. Other
- 6.2. Market Analysis, Insights and Forecast - by Type
- 6.2.1. Musang King
- 6.2.2. Golden Pillow
- 6.2.3. XO
- 6.2.4. Red Prawn
- 6.2.5. Other
- 6.1. Market Analysis, Insights and Forecast - by Application
- 7. South America Fresh Durian Analysis, Insights and Forecast, 2020-2032
- 7.1. Market Analysis, Insights and Forecast - by Application
- 7.1.1. Fruit Shop
- 7.1.2. Bakery
- 7.1.3. Food Processing Plants
- 7.1.4. Other
- 7.2. Market Analysis, Insights and Forecast - by Type
- 7.2.1. Musang King
- 7.2.2. Golden Pillow
- 7.2.3. XO
- 7.2.4. Red Prawn
- 7.2.5. Other
- 7.1. Market Analysis, Insights and Forecast - by Application
- 8. Europe Fresh Durian Analysis, Insights and Forecast, 2020-2032
- 8.1. Market Analysis, Insights and Forecast - by Application
- 8.1.1. Fruit Shop
- 8.1.2. Bakery
- 8.1.3. Food Processing Plants
- 8.1.4. Other
- 8.2. Market Analysis, Insights and Forecast - by Type
- 8.2.1. Musang King
- 8.2.2. Golden Pillow
- 8.2.3. XO
- 8.2.4. Red Prawn
- 8.2.5. Other
- 8.1. Market Analysis, Insights and Forecast - by Application
- 9. Middle East & Africa Fresh Durian Analysis, Insights and Forecast, 2020-2032
- 9.1. Market Analysis, Insights and Forecast - by Application
- 9.1.1. Fruit Shop
- 9.1.2. Bakery
- 9.1.3. Food Processing Plants
- 9.1.4. Other
- 9.2. Market Analysis, Insights and Forecast - by Type
- 9.2.1. Musang King
- 9.2.2. Golden Pillow
- 9.2.3. XO
- 9.2.4. Red Prawn
- 9.2.5. Other
- 9.1. Market Analysis, Insights and Forecast - by Application
- 10. Asia Pacific Fresh Durian Analysis, Insights and Forecast, 2020-2032
- 10.1. Market Analysis, Insights and Forecast - by Application
- 10.1.1. Fruit Shop
- 10.1.2. Bakery
- 10.1.3. Food Processing Plants
- 10.1.4. Other
- 10.2. Market Analysis, Insights and Forecast - by Type
- 10.2.1. Musang King
- 10.2.2. Golden Pillow
- 10.2.3. XO
- 10.2.4. Red Prawn
- 10.2.5. Other
- 10.1. Market Analysis, Insights and Forecast - by Application
- 11. Competitive Analysis
- 11.1. Global Market Share Analysis 2025
- 11.2. Company Profiles
- 11.2.1 Raub Durian Orchard
- 11.2.1.1. Overview
- 11.2.1.2. Products
- 11.2.1.3. SWOT Analysis
- 11.2.1.4. Recent Developments
- 11.2.1.5. Financials (Based on Availability)
- 11.2.2 DurianBB
- 11.2.2.1. Overview
- 11.2.2.2. Products
- 11.2.2.3. SWOT Analysis
- 11.2.2.4. Recent Developments
- 11.2.2.5. Financials (Based on Availability)
- 11.2.3 DURIAN SS3
- 11.2.3.1. Overview
- 11.2.3.2. Products
- 11.2.3.3. SWOT Analysis
- 11.2.3.4. Recent Developments
- 11.2.3.5. Financials (Based on Availability)
- 11.2.4 Bao Sheng Durian Farm
- 11.2.4.1. Overview
- 11.2.4.2. Products
- 11.2.4.3. SWOT Analysis
- 11.2.4.4. Recent Developments
- 11.2.4.5. Financials (Based on Availability)
- 11.2.5 Ah Seng Durian
- 11.2.5.1. Overview
- 11.2.5.2. Products
- 11.2.5.3. SWOT Analysis
- 11.2.5.4. Recent Developments
- 11.2.5.5. Financials (Based on Availability)
- 11.2.6 Durian366
- 11.2.6.1. Overview
- 11.2.6.2. Products
- 11.2.6.3. SWOT Analysis
- 11.2.6.4. Recent Developments
- 11.2.6.5. Financials (Based on Availability)
- 11.2.7 Mon Thong Durian
- 11.2.7.1. Overview
- 11.2.7.2. Products
- 11.2.7.3. SWOT Analysis
- 11.2.7.4. Recent Developments
- 11.2.7.5. Financials (Based on Availability)
- 11.2.8 Golden Pillow Durian
- 11.2.8.1. Overview
- 11.2.8.2. Products
- 11.2.8.3. SWOT Analysis
- 11.2.8.4. Recent Developments
- 11.2.8.5. Financials (Based on Availability)
- 11.2.9 DOKJIKI Durian
- 11.2.9.1. Overview
- 11.2.9.2. Products
- 11.2.9.3. SWOT Analysis
- 11.2.9.4. Recent Developments
- 11.2.9.5. Financials (Based on Availability)
- 11.2.10 Siam Durian
- 11.2.10.1. Overview
- 11.2.10.2. Products
- 11.2.10.3. SWOT Analysis
- 11.2.10.4. Recent Developments
- 11.2.10.5. Financials (Based on Availability)
- 11.2.11 Malas Durian
- 11.2.11.1. Overview
- 11.2.11.2. Products
- 11.2.11.3. SWOT Analysis
- 11.2.11.4. Recent Developments
- 11.2.11.5. Financials (Based on Availability)
- 11.2.12 Davao Durian
- 11.2.12.1. Overview
- 11.2.12.2. Products
- 11.2.12.3. SWOT Analysis
- 11.2.12.4. Recent Developments
- 11.2.12.5. Financials (Based on Availability)
- 11.2.13 Vinh Kim Durian
- 11.2.13.1. Overview
- 11.2.13.2. Products
- 11.2.13.3. SWOT Analysis
- 11.2.13.4. Recent Developments
- 11.2.13.5. Financials (Based on Availability)
- 11.2.1 Raub Durian Orchard
List of Figures
- Figure 1: Global Fresh Durian Revenue Breakdown (undefined, %) by Region 2025 & 2033
- Figure 2: Global Fresh Durian Volume Breakdown (K, %) by Region 2025 & 2033
- Figure 3: North America Fresh Durian Revenue (undefined), by Application 2025 & 2033
- Figure 4: North America Fresh Durian Volume (K), by Application 2025 & 2033
- Figure 5: North America Fresh Durian Revenue Share (%), by Application 2025 & 2033
- Figure 6: North America Fresh Durian Volume Share (%), by Application 2025 & 2033
- Figure 7: North America Fresh Durian Revenue (undefined), by Type 2025 & 2033
- Figure 8: North America Fresh Durian Volume (K), by Type 2025 & 2033
- Figure 9: North America Fresh Durian Revenue Share (%), by Type 2025 & 2033
- Figure 10: North America Fresh Durian Volume Share (%), by Type 2025 & 2033
- Figure 11: North America Fresh Durian Revenue (undefined), by Country 2025 & 2033
- Figure 12: North America Fresh Durian Volume (K), by Country 2025 & 2033
- Figure 13: North America Fresh Durian Revenue Share (%), by Country 2025 & 2033
- Figure 14: North America Fresh Durian Volume Share (%), by Country 2025 & 2033
- Figure 15: South America Fresh Durian Revenue (undefined), by Application 2025 & 2033
- Figure 16: South America Fresh Durian Volume (K), by Application 2025 & 2033
- Figure 17: South America Fresh Durian Revenue Share (%), by Application 2025 & 2033
- Figure 18: South America Fresh Durian Volume Share (%), by Application 2025 & 2033
- Figure 19: South America Fresh Durian Revenue (undefined), by Type 2025 & 2033
- Figure 20: South America Fresh Durian Volume (K), by Type 2025 & 2033
- Figure 21: South America Fresh Durian Revenue Share (%), by Type 2025 & 2033
- Figure 22: South America Fresh Durian Volume Share (%), by Type 2025 & 2033
- Figure 23: South America Fresh Durian Revenue (undefined), by Country 2025 & 2033
- Figure 24: South America Fresh Durian Volume (K), by Country 2025 & 2033
- Figure 25: South America Fresh Durian Revenue Share (%), by Country 2025 & 2033
- Figure 26: South America Fresh Durian Volume Share (%), by Country 2025 & 2033
- Figure 27: Europe Fresh Durian Revenue (undefined), by Application 2025 & 2033
- Figure 28: Europe Fresh Durian Volume (K), by Application 2025 & 2033
- Figure 29: Europe Fresh Durian Revenue Share (%), by Application 2025 & 2033
- Figure 30: Europe Fresh Durian Volume Share (%), by Application 2025 & 2033
- Figure 31: Europe Fresh Durian Revenue (undefined), by Type 2025 & 2033
- Figure 32: Europe Fresh Durian Volume (K), by Type 2025 & 2033
- Figure 33: Europe Fresh Durian Revenue Share (%), by Type 2025 & 2033
- Figure 34: Europe Fresh Durian Volume Share (%), by Type 2025 & 2033
- Figure 35: Europe Fresh Durian Revenue (undefined), by Country 2025 & 2033
- Figure 36: Europe Fresh Durian Volume (K), by Country 2025 & 2033
- Figure 37: Europe Fresh Durian Revenue Share (%), by Country 2025 & 2033
- Figure 38: Europe Fresh Durian Volume Share (%), by Country 2025 & 2033
- Figure 39: Middle East & Africa Fresh Durian Revenue (undefined), by Application 2025 & 2033
- Figure 40: Middle East & Africa Fresh Durian Volume (K), by Application 2025 & 2033
- Figure 41: Middle East & Africa Fresh Durian Revenue Share (%), by Application 2025 & 2033
- Figure 42: Middle East & Africa Fresh Durian Volume Share (%), by Application 2025 & 2033
- Figure 43: Middle East & Africa Fresh Durian Revenue (undefined), by Type 2025 & 2033
- Figure 44: Middle East & Africa Fresh Durian Volume (K), by Type 2025 & 2033
- Figure 45: Middle East & Africa Fresh Durian Revenue Share (%), by Type 2025 & 2033
- Figure 46: Middle East & Africa Fresh Durian Volume Share (%), by Type 2025 & 2033
- Figure 47: Middle East & Africa Fresh Durian Revenue (undefined), by Country 2025 & 2033
- Figure 48: Middle East & Africa Fresh Durian Volume (K), by Country 2025 & 2033
- Figure 49: Middle East & Africa Fresh Durian Revenue Share (%), by Country 2025 & 2033
- Figure 50: Middle East & Africa Fresh Durian Volume Share (%), by Country 2025 & 2033
- Figure 51: Asia Pacific Fresh Durian Revenue (undefined), by Application 2025 & 2033
- Figure 52: Asia Pacific Fresh Durian Volume (K), by Application 2025 & 2033
- Figure 53: Asia Pacific Fresh Durian Revenue Share (%), by Application 2025 & 2033
- Figure 54: Asia Pacific Fresh Durian Volume Share (%), by Application 2025 & 2033
- Figure 55: Asia Pacific Fresh Durian Revenue (undefined), by Type 2025 & 2033
- Figure 56: Asia Pacific Fresh Durian Volume (K), by Type 2025 & 2033
- Figure 57: Asia Pacific Fresh Durian Revenue Share (%), by Type 2025 & 2033
- Figure 58: Asia Pacific Fresh Durian Volume Share (%), by Type 2025 & 2033
- Figure 59: Asia Pacific Fresh Durian Revenue (undefined), by Country 2025 & 2033
- Figure 60: Asia Pacific Fresh Durian Volume (K), by Country 2025 & 2033
- Figure 61: Asia Pacific Fresh Durian Revenue Share (%), by Country 2025 & 2033
- Figure 62: Asia Pacific Fresh Durian Volume Share (%), by Country 2025 & 2033
List of Tables
- Table 1: Global Fresh Durian Revenue undefined Forecast, by Application 2020 & 2033
- Table 2: Global Fresh Durian Volume K Forecast, by Application 2020 & 2033
- Table 3: Global Fresh Durian Revenue undefined Forecast, by Type 2020 & 2033
- Table 4: Global Fresh Durian Volume K Forecast, by Type 2020 & 2033
- Table 5: Global Fresh Durian Revenue undefined Forecast, by Region 2020 & 2033
- Table 6: Global Fresh Durian Volume K Forecast, by Region 2020 & 2033
- Table 7: Global Fresh Durian Revenue undefined Forecast, by Application 2020 & 2033
- Table 8: Global Fresh Durian Volume K Forecast, by Application 2020 & 2033
- Table 9: Global Fresh Durian Revenue undefined Forecast, by Type 2020 & 2033
- Table 10: Global Fresh Durian Volume K Forecast, by Type 2020 & 2033
- Table 11: Global Fresh Durian Revenue undefined Forecast, by Country 2020 & 2033
- Table 12: Global Fresh Durian Volume K Forecast, by Country 2020 & 2033
- Table 13: United States Fresh Durian Revenue (undefined) Forecast, by Application 2020 & 2033
- Table 14: United States Fresh Durian Volume (K) Forecast, by Application 2020 & 2033
- Table 15: Canada Fresh Durian Revenue (undefined) Forecast, by Application 2020 & 2033
- Table 16: Canada Fresh Durian Volume (K) Forecast, by Application 2020 & 2033
- Table 17: Mexico Fresh Durian Revenue (undefined) Forecast, by Application 2020 & 2033
- Table 18: Mexico Fresh Durian Volume (K) Forecast, by Application 2020 & 2033
- Table 19: Global Fresh Durian Revenue undefined Forecast, by Application 2020 & 2033
- Table 20: Global Fresh Durian Volume K Forecast, by Application 2020 & 2033
- Table 21: Global Fresh Durian Revenue undefined Forecast, by Type 2020 & 2033
- Table 22: Global Fresh Durian Volume K Forecast, by Type 2020 & 2033
- Table 23: Global Fresh Durian Revenue undefined Forecast, by Country 2020 & 2033
- Table 24: Global Fresh Durian Volume K Forecast, by Country 2020 & 2033
- Table 25: Brazil Fresh Durian Revenue (undefined) Forecast, by Application 2020 & 2033
- Table 26: Brazil Fresh Durian Volume (K) Forecast, by Application 2020 & 2033
- Table 27: Argentina Fresh Durian Revenue (undefined) Forecast, by Application 2020 & 2033
- Table 28: Argentina Fresh Durian Volume (K) Forecast, by Application 2020 & 2033
- Table 29: Rest of South America Fresh Durian Revenue (undefined) Forecast, by Application 2020 & 2033
- Table 30: Rest of South America Fresh Durian Volume (K) Forecast, by Application 2020 & 2033
- Table 31: Global Fresh Durian Revenue undefined Forecast, by Application 2020 & 2033
- Table 32: Global Fresh Durian Volume K Forecast, by Application 2020 & 2033
- Table 33: Global Fresh Durian Revenue undefined Forecast, by Type 2020 & 2033
- Table 34: Global Fresh Durian Volume K Forecast, by Type 2020 & 2033
- Table 35: Global Fresh Durian Revenue undefined Forecast, by Country 2020 & 2033
- Table 36: Global Fresh Durian Volume K Forecast, by Country 2020 & 2033
- Table 37: United Kingdom Fresh Durian Revenue (undefined) Forecast, by Application 2020 & 2033
- Table 38: United Kingdom Fresh Durian Volume (K) Forecast, by Application 2020 & 2033
- Table 39: Germany Fresh Durian Revenue (undefined) Forecast, by Application 2020 & 2033
- Table 40: Germany Fresh Durian Volume (K) Forecast, by Application 2020 & 2033
- Table 41: France Fresh Durian Revenue (undefined) Forecast, by Application 2020 & 2033
- Table 42: France Fresh Durian Volume (K) Forecast, by Application 2020 & 2033
- Table 43: Italy Fresh Durian Revenue (undefined) Forecast, by Application 2020 & 2033
- Table 44: Italy Fresh Durian Volume (K) Forecast, by Application 2020 & 2033
- Table 45: Spain Fresh Durian Revenue (undefined) Forecast, by Application 2020 & 2033
- Table 46: Spain Fresh Durian Volume (K) Forecast, by Application 2020 & 2033
- Table 47: Russia Fresh Durian Revenue (undefined) Forecast, by Application 2020 & 2033
- Table 48: Russia Fresh Durian Volume (K) Forecast, by Application 2020 & 2033
- Table 49: Benelux Fresh Durian Revenue (undefined) Forecast, by Application 2020 & 2033
- Table 50: Benelux Fresh Durian Volume (K) Forecast, by Application 2020 & 2033
- Table 51: Nordics Fresh Durian Revenue (undefined) Forecast, by Application 2020 & 2033
- Table 52: Nordics Fresh Durian Volume (K) Forecast, by Application 2020 & 2033
- Table 53: Rest of Europe Fresh Durian Revenue (undefined) Forecast, by Application 2020 & 2033
- Table 54: Rest of Europe Fresh Durian Volume (K) Forecast, by Application 2020 & 2033
- Table 55: Global Fresh Durian Revenue undefined Forecast, by Application 2020 & 2033
- Table 56: Global Fresh Durian Volume K Forecast, by Application 2020 & 2033
- Table 57: Global Fresh Durian Revenue undefined Forecast, by Type 2020 & 2033
- Table 58: Global Fresh Durian Volume K Forecast, by Type 2020 & 2033
- Table 59: Global Fresh Durian Revenue undefined Forecast, by Country 2020 & 2033
- Table 60: Global Fresh Durian Volume K Forecast, by Country 2020 & 2033
- Table 61: Turkey Fresh Durian Revenue (undefined) Forecast, by Application 2020 & 2033
- Table 62: Turkey Fresh Durian Volume (K) Forecast, by Application 2020 & 2033
- Table 63: Israel Fresh Durian Revenue (undefined) Forecast, by Application 2020 & 2033
- Table 64: Israel Fresh Durian Volume (K) Forecast, by Application 2020 & 2033
- Table 65: GCC Fresh Durian Revenue (undefined) Forecast, by Application 2020 & 2033
- Table 66: GCC Fresh Durian Volume (K) Forecast, by Application 2020 & 2033
- Table 67: North Africa Fresh Durian Revenue (undefined) Forecast, by Application 2020 & 2033
- Table 68: North Africa Fresh Durian Volume (K) Forecast, by Application 2020 & 2033
- Table 69: South Africa Fresh Durian Revenue (undefined) Forecast, by Application 2020 & 2033
- Table 70: South Africa Fresh Durian Volume (K) Forecast, by Application 2020 & 2033
- Table 71: Rest of Middle East & Africa Fresh Durian Revenue (undefined) Forecast, by Application 2020 & 2033
- Table 72: Rest of Middle East & Africa Fresh Durian Volume (K) Forecast, by Application 2020 & 2033
- Table 73: Global Fresh Durian Revenue undefined Forecast, by Application 2020 & 2033
- Table 74: Global Fresh Durian Volume K Forecast, by Application 2020 & 2033
- Table 75: Global Fresh Durian Revenue undefined Forecast, by Type 2020 & 2033
- Table 76: Global Fresh Durian Volume K Forecast, by Type 2020 & 2033
- Table 77: Global Fresh Durian Revenue undefined Forecast, by Country 2020 & 2033
- Table 78: Global Fresh Durian Volume K Forecast, by Country 2020 & 2033
- Table 79: China Fresh Durian Revenue (undefined) Forecast, by Application 2020 & 2033
- Table 80: China Fresh Durian Volume (K) Forecast, by Application 2020 & 2033
- Table 81: India Fresh Durian Revenue (undefined) Forecast, by Application 2020 & 2033
- Table 82: India Fresh Durian Volume (K) Forecast, by Application 2020 & 2033
- Table 83: Japan Fresh Durian Revenue (undefined) Forecast, by Application 2020 & 2033
- Table 84: Japan Fresh Durian Volume (K) Forecast, by Application 2020 & 2033
- Table 85: South Korea Fresh Durian Revenue (undefined) Forecast, by Application 2020 & 2033
- Table 86: South Korea Fresh Durian Volume (K) Forecast, by Application 2020 & 2033
- Table 87: ASEAN Fresh Durian Revenue (undefined) Forecast, by Application 2020 & 2033
- Table 88: ASEAN Fresh Durian Volume (K) Forecast, by Application 2020 & 2033
- Table 89: Oceania Fresh Durian Revenue (undefined) Forecast, by Application 2020 & 2033
- Table 90: Oceania Fresh Durian Volume (K) Forecast, by Application 2020 & 2033
- Table 91: Rest of Asia Pacific Fresh Durian Revenue (undefined) Forecast, by Application 2020 & 2033
- Table 92: Rest of Asia Pacific Fresh Durian Volume (K) Forecast, by Application 2020 & 2033
Frequently Asked Questions
1. What is the projected Compound Annual Growth Rate (CAGR) of the Fresh Durian?
The projected CAGR is approximately 5.6%.
2. Which companies are prominent players in the Fresh Durian?
Key companies in the market include Raub Durian Orchard, DurianBB, DURIAN SS3, Bao Sheng Durian Farm, Ah Seng Durian, Durian366, Mon Thong Durian, Golden Pillow Durian, DOKJIKI Durian, Siam Durian, Malas Durian, Davao Durian, Vinh Kim Durian.
3. What are the main segments of the Fresh Durian?
The market segments include Application, Type.
4. Can you provide details about the market size?
The market size is estimated to be USD XXX N/A as of 2022.
5. What are some drivers contributing to market growth?
N/A
6. What are the notable trends driving market growth?
N/A
7. Are there any restraints impacting market growth?
N/A
8. Can you provide examples of recent developments in the market?
N/A
9. What pricing options are available for accessing the report?
Pricing options include single-user, multi-user, and enterprise licenses priced at USD 3950.00, USD 5925.00, and USD 7900.00 respectively.
10. Is the market size provided in terms of value or volume?
The market size is provided in terms of value, measured in N/A and volume, measured in K.
11. Are there any specific market keywords associated with the report?
Yes, the market keyword associated with the report is "Fresh Durian," which aids in identifying and referencing the specific market segment covered.
12. How do I determine which pricing option suits my needs best?
The pricing options vary based on user requirements and access needs. Individual users may opt for single-user licenses, while businesses requiring broader access may choose multi-user or enterprise licenses for cost-effective access to the report.
13. Are there any additional resources or data provided in the Fresh Durian report?
While the report offers comprehensive insights, it's advisable to review the specific contents or supplementary materials provided to ascertain if additional resources or data are available.
14. How can I stay updated on further developments or reports in the Fresh Durian?
To stay informed about further developments, trends, and reports in the Fresh Durian, consider subscribing to industry newsletters, following relevant companies and organizations, or regularly checking reputable industry news sources and publications.
Methodology
Step 1 - Identification of Relevant Samples Size from Population Database


Step 2 - Approaches for Defining Global Market Size (Value, Volume* & Price*)

Note*: In applicable scenarios
Step 3 - Data Sources
Primary Research
- Web Analytics
- Survey Reports
- Research Institute
- Latest Research Reports
- Opinion Leaders
Secondary Research
- Annual Reports
- White Paper
- Latest Press Release
- Industry Association
- Paid Database
- Investor Presentations

Step 4 - Data Triangulation
Involves using different sources of information in order to increase the validity of a study
These sources are likely to be stakeholders in a program - participants, other researchers, program staff, other community members, and so on.
Then we put all data in single framework & apply various statistical tools to find out the dynamic on the market.
During the analysis stage, feedback from the stakeholder groups would be compared to determine areas of agreement as well as areas of divergence