

Key Insights
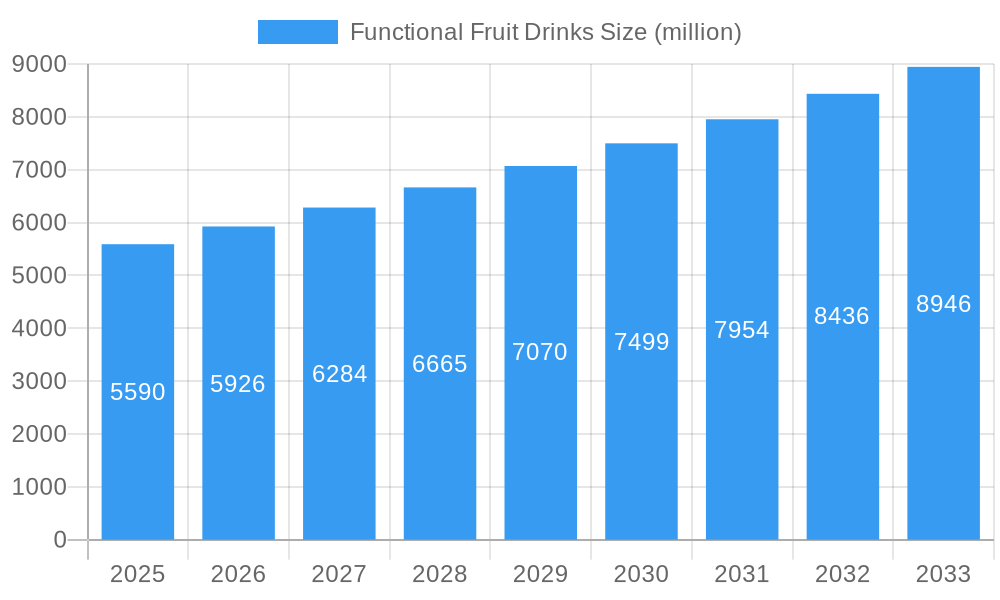
The functional fruit drinks market, valued at $5.59 billion in 2025, is projected to experience robust growth, exhibiting a compound annual growth rate (CAGR) of 5.8% from 2025 to 2033. This expansion is driven by several key factors. Increasing consumer awareness of health and wellness is fueling demand for beverages offering functional benefits beyond simple hydration. The rising prevalence of chronic diseases and a growing preference for natural and healthier alternatives to sugary soft drinks are further propelling market growth. Consumers are actively seeking beverages enriched with vitamins, antioxidants, probiotics, and other beneficial ingredients, leading to innovation in product formulations and increased market penetration of functional fruit drinks. The market is witnessing significant competition among established players like Monster Energy, Nestle, and PepsiCo, as well as smaller, specialized brands focused on niche segments like organic or superfruit-infused beverages. This competitive landscape fosters innovation and encourages the development of new flavors, formats, and functional properties to meet evolving consumer preferences.
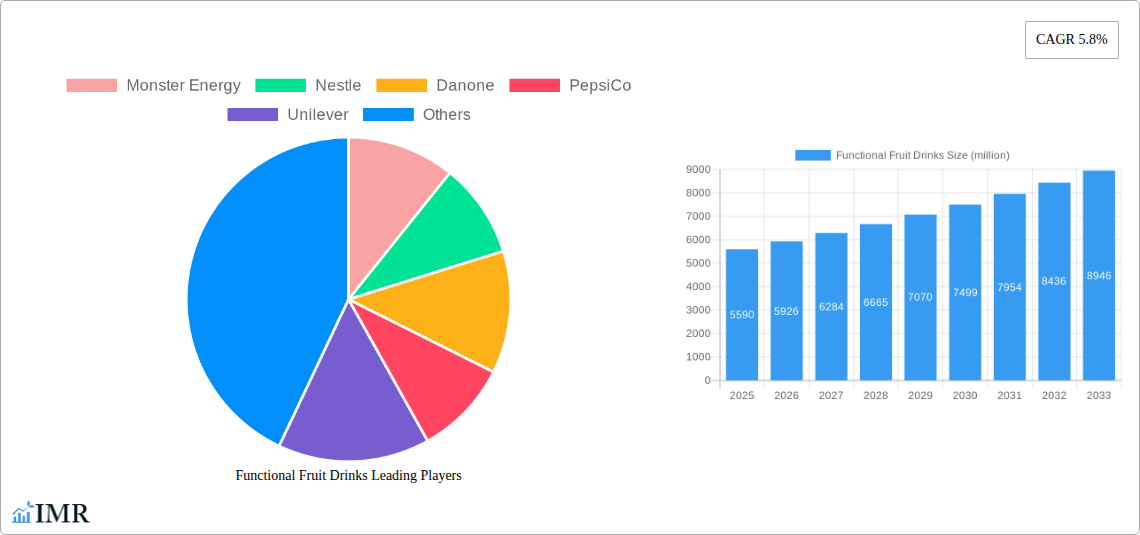
Functional Fruit Drinks Market Size (In Billion)
The market segmentation reveals diverse product categories catering to varied consumer needs. While precise segment breakdowns are not available, we can anticipate significant portions dedicated to fruit juice blends with added vitamins/minerals, probiotic-enhanced drinks, and those focusing on specific health benefits like immunity support or digestive health. Geographical variations will also influence market dynamics; regions with higher health consciousness and disposable incomes are likely to exhibit stronger growth than others. Potential restraints include price sensitivity in some markets, concerns about added sugar content even in functional drinks, and the challenge of maintaining the stability and shelf-life of certain functional ingredients. However, ongoing product innovation, strategic partnerships, and effective marketing campaigns are expected to mitigate these challenges and continue driving market growth.
Functional Fruit Drinks Company Market Share
Functional Fruit Drinks Market Report: 2019-2033
This comprehensive report provides a detailed analysis of the global functional fruit drinks market, offering invaluable insights for industry professionals, investors, and strategic decision-makers. The study period spans from 2019 to 2033, with 2025 serving as the base and estimated year. The report meticulously examines market dynamics, growth trends, leading players (including Monster Energy, Nestle, Danone, and PepsiCo), and future opportunities within this rapidly evolving sector. It dives deep into both parent (beverage market) and child (functional fruit drinks) markets to provide a complete understanding of the landscape.
Study Period: 2019–2033 Base Year: 2025 Estimated Year: 2025 Forecast Period: 2025–2033 Historical Period: 2019–2024
Functional Fruit Drinks Market Dynamics & Structure
The functional fruit drinks market is characterized by a dynamic interplay of factors shaping its structure and growth trajectory. Market concentration is moderate, with a few large multinational corporations holding significant shares alongside numerous smaller, specialized players. Technological innovation, particularly in areas like natural preservatives and enhanced functional ingredients (e.g., probiotics, added vitamins), is a key driver. Stringent regulatory frameworks regarding labeling and health claims significantly influence product development and marketing strategies. The market faces competition from other beverage categories, including sports drinks, juices, and enhanced water, creating a competitive landscape. Consumer demographics, particularly the growing health-conscious population, are a crucial factor driving demand. Furthermore, M&A activity has played a role in shaping market consolidation, with xx million units worth of deals recorded in the historical period (2019-2024).
- Market Concentration: Moderately concentrated, with top 5 players holding approximately xx% market share in 2024.
- Technological Innovation: Focus on natural ingredients, improved taste profiles, and functional enhancements.
- Regulatory Landscape: Stringent regulations regarding labeling and health claims impact product development.
- Competitive Substitutes: Sports drinks, juices, enhanced water pose significant competition.
- End-User Demographics: Growing health-conscious population fuels market demand, particularly among millennials and Gen Z.
- M&A Activity: xx million units worth of deals in 2019-2024, indicating consolidation trends.
Functional Fruit Drinks Growth Trends & Insights
The functional fruit drinks market experienced robust growth during the historical period (2019-2024), exhibiting a CAGR of xx%. This growth is attributed to several factors, including increasing consumer awareness of health and wellness, rising disposable incomes in emerging economies, and the proliferation of health and fitness-oriented lifestyles. The market size in 2024 was estimated at xx million units, and is projected to reach xx million units by 2033, reflecting a CAGR of xx% during the forecast period. Market penetration remains relatively low in several regions, presenting significant growth opportunities. Technological disruptions, such as the introduction of innovative packaging and delivery systems, are further enhancing market expansion. Consumer behavior shifts toward convenient, on-the-go consumption patterns also play a pivotal role.
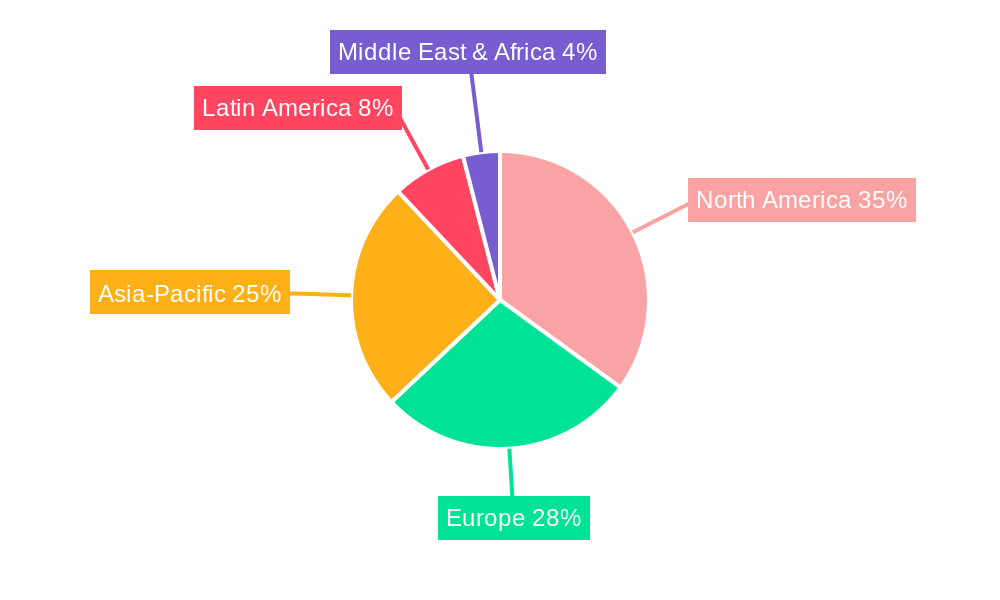
Dominant Regions, Countries, or Segments in Functional Fruit Drinks
North America currently holds the largest market share in the functional fruit drinks sector, driven by factors such as high consumer spending power, established distribution networks, and a strong focus on health and wellness. However, Asia-Pacific is projected to witness the fastest growth in the forecast period (2025-2033) due to rapidly expanding economies, growing middle class, and increasing health consciousness within the region. Within specific segments, fruit-based drinks with added vitamins and minerals are driving significant growth, exceeding xx million units in 2024.
- North America: High consumer spending, strong distribution networks, health-conscious population.
- Asia-Pacific: Rapid economic growth, expanding middle class, rising health awareness.
- Europe: Mature market with steady growth, focus on natural and organic options.
- Leading Segments: Vitamin-enhanced drinks, probiotic drinks.
Functional Fruit Drinks Product Landscape
Product innovation in the functional fruit drinks market is marked by a strong focus on natural ingredients, enhanced taste profiles, and functional benefits. Companies are increasingly incorporating superfoods, probiotics, and adaptogens to cater to the growing demand for healthier options. Unique selling propositions often emphasize the use of natural sweeteners, organic fruits, and transparent labeling. Technological advancements in packaging, such as aseptic processing and shelf-stable formats, enhance product longevity and convenience.
Key Drivers, Barriers & Challenges in Functional Fruit Drinks
Key Drivers:
- Growing health consciousness among consumers.
- Increasing disposable incomes in emerging markets.
- Technological advancements in product formulation and packaging.
- Government support for healthier food and beverage options.
Challenges & Restraints:
- Intense competition from established beverage brands.
- Fluctuations in raw material prices (e.g., fruits).
- Stringent regulatory requirements regarding labeling and health claims.
- Consumer concerns about added sugars and artificial ingredients. This has impacted growth by approximately xx million units annually in recent years.
Emerging Opportunities in Functional Fruit Drinks
Emerging opportunities lie in expanding into untapped markets, particularly in developing economies. There's also potential for innovative product development, such as incorporating emerging functional ingredients like collagen or nootropics. Further opportunities exist in catering to specific dietary needs and preferences, like offering gluten-free, vegan, or keto-friendly options.
Growth Accelerators in the Functional Fruit Drinks Industry
Strategic partnerships between beverage companies and health and wellness brands can accelerate market growth by leveraging existing distribution channels and expanding product reach. Technological breakthroughs in personalized nutrition and ingredient sourcing can also boost growth by catering to specific consumer needs. Expansion into new geographical markets, especially in emerging economies, is another key accelerator.
Key Players Shaping the Functional Fruit Drinks Market
- Monster Energy
- Nestle
- Danone
- PepsiCo
- Unilever
- Campbell
- GlaxoSmithKline
- Kraft Heinz
- Archer Daniels Midland (ADM)
- The Hain Celestial Group
- Fonterra
- Uni-President
- Del Monte Pacific
- Keurig Dr Pepper
- JDB Group
- RED BULL
- Suntory
Notable Milestones in Functional Fruit Drinks Sector
- 2020: Introduction of several plant-based functional fruit drinks by major players.
- 2021: Increased focus on sustainable packaging options within the industry.
- 2022: Significant investment in research and development of new functional ingredients.
- 2023: Several mergers and acquisitions aimed at consolidating market share.
In-Depth Functional Fruit Drinks Market Outlook
The functional fruit drinks market is poised for sustained growth, driven by the continued focus on health and wellness, the expansion into new markets, and ongoing product innovation. Strategic partnerships, investment in R&D, and adoption of sustainable practices will be crucial for long-term success. The market is expected to witness a significant increase in demand for premium, specialized products catering to niche consumer segments. This presents opportunities for both established players and emerging companies to gain market share and capitalize on the expanding market potential.
Functional Fruit Drinks Segmentation
-
1. Application
- 1.1. Offline Sale
- 1.2. Online Sale
-
2. Type
- 2.1. Lime
- 2.2. Mango
- 2.3. Apple
- 2.4. Strawberry
- 2.5. Others
Functional Fruit Drinks Segmentation By Geography
-
1. North America
- 1.1. United States
- 1.2. Canada
- 1.3. Mexico
-
2. South America
- 2.1. Brazil
- 2.2. Argentina
- 2.3. Rest of South America
-
3. Europe
- 3.1. United Kingdom
- 3.2. Germany
- 3.3. France
- 3.4. Italy
- 3.5. Spain
- 3.6. Russia
- 3.7. Benelux
- 3.8. Nordics
- 3.9. Rest of Europe
-
4. Middle East & Africa
- 4.1. Turkey
- 4.2. Israel
- 4.3. GCC
- 4.4. North Africa
- 4.5. South Africa
- 4.6. Rest of Middle East & Africa
-
5. Asia Pacific
- 5.1. China
- 5.2. India
- 5.3. Japan
- 5.4. South Korea
- 5.5. ASEAN
- 5.6. Oceania
- 5.7. Rest of Asia Pacific
Functional Fruit Drinks Regional Market Share
Geographic Coverage of Functional Fruit Drinks
Functional Fruit Drinks REPORT HIGHLIGHTS
| Aspects | Details |
|---|---|
| Study Period | 2020-2034 |
| Base Year | 2025 |
| Estimated Year | 2026 |
| Forecast Period | 2026-2034 |
| Historical Period | 2020-2025 |
| Growth Rate | CAGR of 5.8% from 2020-2034 |
| Segmentation |
|
Table of Contents
- 1. Introduction
- 1.1. Research Scope
- 1.2. Market Segmentation
- 1.3. Research Methodology
- 1.4. Definitions and Assumptions
- 2. Executive Summary
- 2.1. Introduction
- 3. Market Dynamics
- 3.1. Introduction
- 3.2. Market Drivers
- 3.3. Market Restrains
- 3.4. Market Trends
- 4. Market Factor Analysis
- 4.1. Porters Five Forces
- 4.2. Supply/Value Chain
- 4.3. PESTEL analysis
- 4.4. Market Entropy
- 4.5. Patent/Trademark Analysis
- 5. Global Functional Fruit Drinks Analysis, Insights and Forecast, 2020-2032
- 5.1. Market Analysis, Insights and Forecast - by Application
- 5.1.1. Offline Sale
- 5.1.2. Online Sale
- 5.2. Market Analysis, Insights and Forecast - by Type
- 5.2.1. Lime
- 5.2.2. Mango
- 5.2.3. Apple
- 5.2.4. Strawberry
- 5.2.5. Others
- 5.3. Market Analysis, Insights and Forecast - by Region
- 5.3.1. North America
- 5.3.2. South America
- 5.3.3. Europe
- 5.3.4. Middle East & Africa
- 5.3.5. Asia Pacific
- 5.1. Market Analysis, Insights and Forecast - by Application
- 6. North America Functional Fruit Drinks Analysis, Insights and Forecast, 2020-2032
- 6.1. Market Analysis, Insights and Forecast - by Application
- 6.1.1. Offline Sale
- 6.1.2. Online Sale
- 6.2. Market Analysis, Insights and Forecast - by Type
- 6.2.1. Lime
- 6.2.2. Mango
- 6.2.3. Apple
- 6.2.4. Strawberry
- 6.2.5. Others
- 6.1. Market Analysis, Insights and Forecast - by Application
- 7. South America Functional Fruit Drinks Analysis, Insights and Forecast, 2020-2032
- 7.1. Market Analysis, Insights and Forecast - by Application
- 7.1.1. Offline Sale
- 7.1.2. Online Sale
- 7.2. Market Analysis, Insights and Forecast - by Type
- 7.2.1. Lime
- 7.2.2. Mango
- 7.2.3. Apple
- 7.2.4. Strawberry
- 7.2.5. Others
- 7.1. Market Analysis, Insights and Forecast - by Application
- 8. Europe Functional Fruit Drinks Analysis, Insights and Forecast, 2020-2032
- 8.1. Market Analysis, Insights and Forecast - by Application
- 8.1.1. Offline Sale
- 8.1.2. Online Sale
- 8.2. Market Analysis, Insights and Forecast - by Type
- 8.2.1. Lime
- 8.2.2. Mango
- 8.2.3. Apple
- 8.2.4. Strawberry
- 8.2.5. Others
- 8.1. Market Analysis, Insights and Forecast - by Application
- 9. Middle East & Africa Functional Fruit Drinks Analysis, Insights and Forecast, 2020-2032
- 9.1. Market Analysis, Insights and Forecast - by Application
- 9.1.1. Offline Sale
- 9.1.2. Online Sale
- 9.2. Market Analysis, Insights and Forecast - by Type
- 9.2.1. Lime
- 9.2.2. Mango
- 9.2.3. Apple
- 9.2.4. Strawberry
- 9.2.5. Others
- 9.1. Market Analysis, Insights and Forecast - by Application
- 10. Asia Pacific Functional Fruit Drinks Analysis, Insights and Forecast, 2020-2032
- 10.1. Market Analysis, Insights and Forecast - by Application
- 10.1.1. Offline Sale
- 10.1.2. Online Sale
- 10.2. Market Analysis, Insights and Forecast - by Type
- 10.2.1. Lime
- 10.2.2. Mango
- 10.2.3. Apple
- 10.2.4. Strawberry
- 10.2.5. Others
- 10.1. Market Analysis, Insights and Forecast - by Application
- 11. Competitive Analysis
- 11.1. Global Market Share Analysis 2025
- 11.2. Company Profiles
- 11.2.1 Monster Energy
- 11.2.1.1. Overview
- 11.2.1.2. Products
- 11.2.1.3. SWOT Analysis
- 11.2.1.4. Recent Developments
- 11.2.1.5. Financials (Based on Availability)
- 11.2.2 Nestle
- 11.2.2.1. Overview
- 11.2.2.2. Products
- 11.2.2.3. SWOT Analysis
- 11.2.2.4. Recent Developments
- 11.2.2.5. Financials (Based on Availability)
- 11.2.3 Danone
- 11.2.3.1. Overview
- 11.2.3.2. Products
- 11.2.3.3. SWOT Analysis
- 11.2.3.4. Recent Developments
- 11.2.3.5. Financials (Based on Availability)
- 11.2.4 PepsiCo
- 11.2.4.1. Overview
- 11.2.4.2. Products
- 11.2.4.3. SWOT Analysis
- 11.2.4.4. Recent Developments
- 11.2.4.5. Financials (Based on Availability)
- 11.2.5 Unilever
- 11.2.5.1. Overview
- 11.2.5.2. Products
- 11.2.5.3. SWOT Analysis
- 11.2.5.4. Recent Developments
- 11.2.5.5. Financials (Based on Availability)
- 11.2.6 Campbell
- 11.2.6.1. Overview
- 11.2.6.2. Products
- 11.2.6.3. SWOT Analysis
- 11.2.6.4. Recent Developments
- 11.2.6.5. Financials (Based on Availability)
- 11.2.7 GlaxoSmithKline
- 11.2.7.1. Overview
- 11.2.7.2. Products
- 11.2.7.3. SWOT Analysis
- 11.2.7.4. Recent Developments
- 11.2.7.5. Financials (Based on Availability)
- 11.2.8 Kraft Heinz
- 11.2.8.1. Overview
- 11.2.8.2. Products
- 11.2.8.3. SWOT Analysis
- 11.2.8.4. Recent Developments
- 11.2.8.5. Financials (Based on Availability)
- 11.2.9 Archer Daniels Midland (ADM)
- 11.2.9.1. Overview
- 11.2.9.2. Products
- 11.2.9.3. SWOT Analysis
- 11.2.9.4. Recent Developments
- 11.2.9.5. Financials (Based on Availability)
- 11.2.10 The Hain Celestial Group
- 11.2.10.1. Overview
- 11.2.10.2. Products
- 11.2.10.3. SWOT Analysis
- 11.2.10.4. Recent Developments
- 11.2.10.5. Financials (Based on Availability)
- 11.2.11 Fonterra
- 11.2.11.1. Overview
- 11.2.11.2. Products
- 11.2.11.3. SWOT Analysis
- 11.2.11.4. Recent Developments
- 11.2.11.5. Financials (Based on Availability)
- 11.2.12 Uni-President
- 11.2.12.1. Overview
- 11.2.12.2. Products
- 11.2.12.3. SWOT Analysis
- 11.2.12.4. Recent Developments
- 11.2.12.5. Financials (Based on Availability)
- 11.2.13 Del Monte Pacific
- 11.2.13.1. Overview
- 11.2.13.2. Products
- 11.2.13.3. SWOT Analysis
- 11.2.13.4. Recent Developments
- 11.2.13.5. Financials (Based on Availability)
- 11.2.14 Keurig Dr Pepper
- 11.2.14.1. Overview
- 11.2.14.2. Products
- 11.2.14.3. SWOT Analysis
- 11.2.14.4. Recent Developments
- 11.2.14.5. Financials (Based on Availability)
- 11.2.15 JDB Group
- 11.2.15.1. Overview
- 11.2.15.2. Products
- 11.2.15.3. SWOT Analysis
- 11.2.15.4. Recent Developments
- 11.2.15.5. Financials (Based on Availability)
- 11.2.16 RED BULL
- 11.2.16.1. Overview
- 11.2.16.2. Products
- 11.2.16.3. SWOT Analysis
- 11.2.16.4. Recent Developments
- 11.2.16.5. Financials (Based on Availability)
- 11.2.17 Suntory
- 11.2.17.1. Overview
- 11.2.17.2. Products
- 11.2.17.3. SWOT Analysis
- 11.2.17.4. Recent Developments
- 11.2.17.5. Financials (Based on Availability)
- 11.2.1 Monster Energy
List of Figures
- Figure 1: Global Functional Fruit Drinks Revenue Breakdown (million, %) by Region 2025 & 2033
- Figure 2: Global Functional Fruit Drinks Volume Breakdown (K, %) by Region 2025 & 2033
- Figure 3: North America Functional Fruit Drinks Revenue (million), by Application 2025 & 2033
- Figure 4: North America Functional Fruit Drinks Volume (K), by Application 2025 & 2033
- Figure 5: North America Functional Fruit Drinks Revenue Share (%), by Application 2025 & 2033
- Figure 6: North America Functional Fruit Drinks Volume Share (%), by Application 2025 & 2033
- Figure 7: North America Functional Fruit Drinks Revenue (million), by Type 2025 & 2033
- Figure 8: North America Functional Fruit Drinks Volume (K), by Type 2025 & 2033
- Figure 9: North America Functional Fruit Drinks Revenue Share (%), by Type 2025 & 2033
- Figure 10: North America Functional Fruit Drinks Volume Share (%), by Type 2025 & 2033
- Figure 11: North America Functional Fruit Drinks Revenue (million), by Country 2025 & 2033
- Figure 12: North America Functional Fruit Drinks Volume (K), by Country 2025 & 2033
- Figure 13: North America Functional Fruit Drinks Revenue Share (%), by Country 2025 & 2033
- Figure 14: North America Functional Fruit Drinks Volume Share (%), by Country 2025 & 2033
- Figure 15: South America Functional Fruit Drinks Revenue (million), by Application 2025 & 2033
- Figure 16: South America Functional Fruit Drinks Volume (K), by Application 2025 & 2033
- Figure 17: South America Functional Fruit Drinks Revenue Share (%), by Application 2025 & 2033
- Figure 18: South America Functional Fruit Drinks Volume Share (%), by Application 2025 & 2033
- Figure 19: South America Functional Fruit Drinks Revenue (million), by Type 2025 & 2033
- Figure 20: South America Functional Fruit Drinks Volume (K), by Type 2025 & 2033
- Figure 21: South America Functional Fruit Drinks Revenue Share (%), by Type 2025 & 2033
- Figure 22: South America Functional Fruit Drinks Volume Share (%), by Type 2025 & 2033
- Figure 23: South America Functional Fruit Drinks Revenue (million), by Country 2025 & 2033
- Figure 24: South America Functional Fruit Drinks Volume (K), by Country 2025 & 2033
- Figure 25: South America Functional Fruit Drinks Revenue Share (%), by Country 2025 & 2033
- Figure 26: South America Functional Fruit Drinks Volume Share (%), by Country 2025 & 2033
- Figure 27: Europe Functional Fruit Drinks Revenue (million), by Application 2025 & 2033
- Figure 28: Europe Functional Fruit Drinks Volume (K), by Application 2025 & 2033
- Figure 29: Europe Functional Fruit Drinks Revenue Share (%), by Application 2025 & 2033
- Figure 30: Europe Functional Fruit Drinks Volume Share (%), by Application 2025 & 2033
- Figure 31: Europe Functional Fruit Drinks Revenue (million), by Type 2025 & 2033
- Figure 32: Europe Functional Fruit Drinks Volume (K), by Type 2025 & 2033
- Figure 33: Europe Functional Fruit Drinks Revenue Share (%), by Type 2025 & 2033
- Figure 34: Europe Functional Fruit Drinks Volume Share (%), by Type 2025 & 2033
- Figure 35: Europe Functional Fruit Drinks Revenue (million), by Country 2025 & 2033
- Figure 36: Europe Functional Fruit Drinks Volume (K), by Country 2025 & 2033
- Figure 37: Europe Functional Fruit Drinks Revenue Share (%), by Country 2025 & 2033
- Figure 38: Europe Functional Fruit Drinks Volume Share (%), by Country 2025 & 2033
- Figure 39: Middle East & Africa Functional Fruit Drinks Revenue (million), by Application 2025 & 2033
- Figure 40: Middle East & Africa Functional Fruit Drinks Volume (K), by Application 2025 & 2033
- Figure 41: Middle East & Africa Functional Fruit Drinks Revenue Share (%), by Application 2025 & 2033
- Figure 42: Middle East & Africa Functional Fruit Drinks Volume Share (%), by Application 2025 & 2033
- Figure 43: Middle East & Africa Functional Fruit Drinks Revenue (million), by Type 2025 & 2033
- Figure 44: Middle East & Africa Functional Fruit Drinks Volume (K), by Type 2025 & 2033
- Figure 45: Middle East & Africa Functional Fruit Drinks Revenue Share (%), by Type 2025 & 2033
- Figure 46: Middle East & Africa Functional Fruit Drinks Volume Share (%), by Type 2025 & 2033
- Figure 47: Middle East & Africa Functional Fruit Drinks Revenue (million), by Country 2025 & 2033
- Figure 48: Middle East & Africa Functional Fruit Drinks Volume (K), by Country 2025 & 2033
- Figure 49: Middle East & Africa Functional Fruit Drinks Revenue Share (%), by Country 2025 & 2033
- Figure 50: Middle East & Africa Functional Fruit Drinks Volume Share (%), by Country 2025 & 2033
- Figure 51: Asia Pacific Functional Fruit Drinks Revenue (million), by Application 2025 & 2033
- Figure 52: Asia Pacific Functional Fruit Drinks Volume (K), by Application 2025 & 2033
- Figure 53: Asia Pacific Functional Fruit Drinks Revenue Share (%), by Application 2025 & 2033
- Figure 54: Asia Pacific Functional Fruit Drinks Volume Share (%), by Application 2025 & 2033
- Figure 55: Asia Pacific Functional Fruit Drinks Revenue (million), by Type 2025 & 2033
- Figure 56: Asia Pacific Functional Fruit Drinks Volume (K), by Type 2025 & 2033
- Figure 57: Asia Pacific Functional Fruit Drinks Revenue Share (%), by Type 2025 & 2033
- Figure 58: Asia Pacific Functional Fruit Drinks Volume Share (%), by Type 2025 & 2033
- Figure 59: Asia Pacific Functional Fruit Drinks Revenue (million), by Country 2025 & 2033
- Figure 60: Asia Pacific Functional Fruit Drinks Volume (K), by Country 2025 & 2033
- Figure 61: Asia Pacific Functional Fruit Drinks Revenue Share (%), by Country 2025 & 2033
- Figure 62: Asia Pacific Functional Fruit Drinks Volume Share (%), by Country 2025 & 2033
List of Tables
- Table 1: Global Functional Fruit Drinks Revenue million Forecast, by Application 2020 & 2033
- Table 2: Global Functional Fruit Drinks Volume K Forecast, by Application 2020 & 2033
- Table 3: Global Functional Fruit Drinks Revenue million Forecast, by Type 2020 & 2033
- Table 4: Global Functional Fruit Drinks Volume K Forecast, by Type 2020 & 2033
- Table 5: Global Functional Fruit Drinks Revenue million Forecast, by Region 2020 & 2033
- Table 6: Global Functional Fruit Drinks Volume K Forecast, by Region 2020 & 2033
- Table 7: Global Functional Fruit Drinks Revenue million Forecast, by Application 2020 & 2033
- Table 8: Global Functional Fruit Drinks Volume K Forecast, by Application 2020 & 2033
- Table 9: Global Functional Fruit Drinks Revenue million Forecast, by Type 2020 & 2033
- Table 10: Global Functional Fruit Drinks Volume K Forecast, by Type 2020 & 2033
- Table 11: Global Functional Fruit Drinks Revenue million Forecast, by Country 2020 & 2033
- Table 12: Global Functional Fruit Drinks Volume K Forecast, by Country 2020 & 2033
- Table 13: United States Functional Fruit Drinks Revenue (million) Forecast, by Application 2020 & 2033
- Table 14: United States Functional Fruit Drinks Volume (K) Forecast, by Application 2020 & 2033
- Table 15: Canada Functional Fruit Drinks Revenue (million) Forecast, by Application 2020 & 2033
- Table 16: Canada Functional Fruit Drinks Volume (K) Forecast, by Application 2020 & 2033
- Table 17: Mexico Functional Fruit Drinks Revenue (million) Forecast, by Application 2020 & 2033
- Table 18: Mexico Functional Fruit Drinks Volume (K) Forecast, by Application 2020 & 2033
- Table 19: Global Functional Fruit Drinks Revenue million Forecast, by Application 2020 & 2033
- Table 20: Global Functional Fruit Drinks Volume K Forecast, by Application 2020 & 2033
- Table 21: Global Functional Fruit Drinks Revenue million Forecast, by Type 2020 & 2033
- Table 22: Global Functional Fruit Drinks Volume K Forecast, by Type 2020 & 2033
- Table 23: Global Functional Fruit Drinks Revenue million Forecast, by Country 2020 & 2033
- Table 24: Global Functional Fruit Drinks Volume K Forecast, by Country 2020 & 2033
- Table 25: Brazil Functional Fruit Drinks Revenue (million) Forecast, by Application 2020 & 2033
- Table 26: Brazil Functional Fruit Drinks Volume (K) Forecast, by Application 2020 & 2033
- Table 27: Argentina Functional Fruit Drinks Revenue (million) Forecast, by Application 2020 & 2033
- Table 28: Argentina Functional Fruit Drinks Volume (K) Forecast, by Application 2020 & 2033
- Table 29: Rest of South America Functional Fruit Drinks Revenue (million) Forecast, by Application 2020 & 2033
- Table 30: Rest of South America Functional Fruit Drinks Volume (K) Forecast, by Application 2020 & 2033
- Table 31: Global Functional Fruit Drinks Revenue million Forecast, by Application 2020 & 2033
- Table 32: Global Functional Fruit Drinks Volume K Forecast, by Application 2020 & 2033
- Table 33: Global Functional Fruit Drinks Revenue million Forecast, by Type 2020 & 2033
- Table 34: Global Functional Fruit Drinks Volume K Forecast, by Type 2020 & 2033
- Table 35: Global Functional Fruit Drinks Revenue million Forecast, by Country 2020 & 2033
- Table 36: Global Functional Fruit Drinks Volume K Forecast, by Country 2020 & 2033
- Table 37: United Kingdom Functional Fruit Drinks Revenue (million) Forecast, by Application 2020 & 2033
- Table 38: United Kingdom Functional Fruit Drinks Volume (K) Forecast, by Application 2020 & 2033
- Table 39: Germany Functional Fruit Drinks Revenue (million) Forecast, by Application 2020 & 2033
- Table 40: Germany Functional Fruit Drinks Volume (K) Forecast, by Application 2020 & 2033
- Table 41: France Functional Fruit Drinks Revenue (million) Forecast, by Application 2020 & 2033
- Table 42: France Functional Fruit Drinks Volume (K) Forecast, by Application 2020 & 2033
- Table 43: Italy Functional Fruit Drinks Revenue (million) Forecast, by Application 2020 & 2033
- Table 44: Italy Functional Fruit Drinks Volume (K) Forecast, by Application 2020 & 2033
- Table 45: Spain Functional Fruit Drinks Revenue (million) Forecast, by Application 2020 & 2033
- Table 46: Spain Functional Fruit Drinks Volume (K) Forecast, by Application 2020 & 2033
- Table 47: Russia Functional Fruit Drinks Revenue (million) Forecast, by Application 2020 & 2033
- Table 48: Russia Functional Fruit Drinks Volume (K) Forecast, by Application 2020 & 2033
- Table 49: Benelux Functional Fruit Drinks Revenue (million) Forecast, by Application 2020 & 2033
- Table 50: Benelux Functional Fruit Drinks Volume (K) Forecast, by Application 2020 & 2033
- Table 51: Nordics Functional Fruit Drinks Revenue (million) Forecast, by Application 2020 & 2033
- Table 52: Nordics Functional Fruit Drinks Volume (K) Forecast, by Application 2020 & 2033
- Table 53: Rest of Europe Functional Fruit Drinks Revenue (million) Forecast, by Application 2020 & 2033
- Table 54: Rest of Europe Functional Fruit Drinks Volume (K) Forecast, by Application 2020 & 2033
- Table 55: Global Functional Fruit Drinks Revenue million Forecast, by Application 2020 & 2033
- Table 56: Global Functional Fruit Drinks Volume K Forecast, by Application 2020 & 2033
- Table 57: Global Functional Fruit Drinks Revenue million Forecast, by Type 2020 & 2033
- Table 58: Global Functional Fruit Drinks Volume K Forecast, by Type 2020 & 2033
- Table 59: Global Functional Fruit Drinks Revenue million Forecast, by Country 2020 & 2033
- Table 60: Global Functional Fruit Drinks Volume K Forecast, by Country 2020 & 2033
- Table 61: Turkey Functional Fruit Drinks Revenue (million) Forecast, by Application 2020 & 2033
- Table 62: Turkey Functional Fruit Drinks Volume (K) Forecast, by Application 2020 & 2033
- Table 63: Israel Functional Fruit Drinks Revenue (million) Forecast, by Application 2020 & 2033
- Table 64: Israel Functional Fruit Drinks Volume (K) Forecast, by Application 2020 & 2033
- Table 65: GCC Functional Fruit Drinks Revenue (million) Forecast, by Application 2020 & 2033
- Table 66: GCC Functional Fruit Drinks Volume (K) Forecast, by Application 2020 & 2033
- Table 67: North Africa Functional Fruit Drinks Revenue (million) Forecast, by Application 2020 & 2033
- Table 68: North Africa Functional Fruit Drinks Volume (K) Forecast, by Application 2020 & 2033
- Table 69: South Africa Functional Fruit Drinks Revenue (million) Forecast, by Application 2020 & 2033
- Table 70: South Africa Functional Fruit Drinks Volume (K) Forecast, by Application 2020 & 2033
- Table 71: Rest of Middle East & Africa Functional Fruit Drinks Revenue (million) Forecast, by Application 2020 & 2033
- Table 72: Rest of Middle East & Africa Functional Fruit Drinks Volume (K) Forecast, by Application 2020 & 2033
- Table 73: Global Functional Fruit Drinks Revenue million Forecast, by Application 2020 & 2033
- Table 74: Global Functional Fruit Drinks Volume K Forecast, by Application 2020 & 2033
- Table 75: Global Functional Fruit Drinks Revenue million Forecast, by Type 2020 & 2033
- Table 76: Global Functional Fruit Drinks Volume K Forecast, by Type 2020 & 2033
- Table 77: Global Functional Fruit Drinks Revenue million Forecast, by Country 2020 & 2033
- Table 78: Global Functional Fruit Drinks Volume K Forecast, by Country 2020 & 2033
- Table 79: China Functional Fruit Drinks Revenue (million) Forecast, by Application 2020 & 2033
- Table 80: China Functional Fruit Drinks Volume (K) Forecast, by Application 2020 & 2033
- Table 81: India Functional Fruit Drinks Revenue (million) Forecast, by Application 2020 & 2033
- Table 82: India Functional Fruit Drinks Volume (K) Forecast, by Application 2020 & 2033
- Table 83: Japan Functional Fruit Drinks Revenue (million) Forecast, by Application 2020 & 2033
- Table 84: Japan Functional Fruit Drinks Volume (K) Forecast, by Application 2020 & 2033
- Table 85: South Korea Functional Fruit Drinks Revenue (million) Forecast, by Application 2020 & 2033
- Table 86: South Korea Functional Fruit Drinks Volume (K) Forecast, by Application 2020 & 2033
- Table 87: ASEAN Functional Fruit Drinks Revenue (million) Forecast, by Application 2020 & 2033
- Table 88: ASEAN Functional Fruit Drinks Volume (K) Forecast, by Application 2020 & 2033
- Table 89: Oceania Functional Fruit Drinks Revenue (million) Forecast, by Application 2020 & 2033
- Table 90: Oceania Functional Fruit Drinks Volume (K) Forecast, by Application 2020 & 2033
- Table 91: Rest of Asia Pacific Functional Fruit Drinks Revenue (million) Forecast, by Application 2020 & 2033
- Table 92: Rest of Asia Pacific Functional Fruit Drinks Volume (K) Forecast, by Application 2020 & 2033
Frequently Asked Questions
1. What is the projected Compound Annual Growth Rate (CAGR) of the Functional Fruit Drinks?
The projected CAGR is approximately 5.8%.
2. Which companies are prominent players in the Functional Fruit Drinks?
Key companies in the market include Monster Energy, Nestle, Danone, PepsiCo, Unilever, Campbell, GlaxoSmithKline, Kraft Heinz, Archer Daniels Midland (ADM), The Hain Celestial Group, Fonterra, Uni-President, Del Monte Pacific, Keurig Dr Pepper, JDB Group, RED BULL, Suntory.
3. What are the main segments of the Functional Fruit Drinks?
The market segments include Application, Type.
4. Can you provide details about the market size?
The market size is estimated to be USD 5590 million as of 2022.
5. What are some drivers contributing to market growth?
N/A
6. What are the notable trends driving market growth?
N/A
7. Are there any restraints impacting market growth?
N/A
8. Can you provide examples of recent developments in the market?
N/A
9. What pricing options are available for accessing the report?
Pricing options include single-user, multi-user, and enterprise licenses priced at USD 3950.00, USD 5925.00, and USD 7900.00 respectively.
10. Is the market size provided in terms of value or volume?
The market size is provided in terms of value, measured in million and volume, measured in K.
11. Are there any specific market keywords associated with the report?
Yes, the market keyword associated with the report is "Functional Fruit Drinks," which aids in identifying and referencing the specific market segment covered.
12. How do I determine which pricing option suits my needs best?
The pricing options vary based on user requirements and access needs. Individual users may opt for single-user licenses, while businesses requiring broader access may choose multi-user or enterprise licenses for cost-effective access to the report.
13. Are there any additional resources or data provided in the Functional Fruit Drinks report?
While the report offers comprehensive insights, it's advisable to review the specific contents or supplementary materials provided to ascertain if additional resources or data are available.
14. How can I stay updated on further developments or reports in the Functional Fruit Drinks?
To stay informed about further developments, trends, and reports in the Functional Fruit Drinks, consider subscribing to industry newsletters, following relevant companies and organizations, or regularly checking reputable industry news sources and publications.
Methodology
Step 1 - Identification of Relevant Samples Size from Population Database


Step 2 - Approaches for Defining Global Market Size (Value, Volume* & Price*)

Note*: In applicable scenarios
Step 3 - Data Sources
Primary Research
- Web Analytics
- Survey Reports
- Research Institute
- Latest Research Reports
- Opinion Leaders
Secondary Research
- Annual Reports
- White Paper
- Latest Press Release
- Industry Association
- Paid Database
- Investor Presentations

Step 4 - Data Triangulation
Involves using different sources of information in order to increase the validity of a study
These sources are likely to be stakeholders in a program - participants, other researchers, program staff, other community members, and so on.
Then we put all data in single framework & apply various statistical tools to find out the dynamic on the market.
During the analysis stage, feedback from the stakeholder groups would be compared to determine areas of agreement as well as areas of divergence