

Key Insights
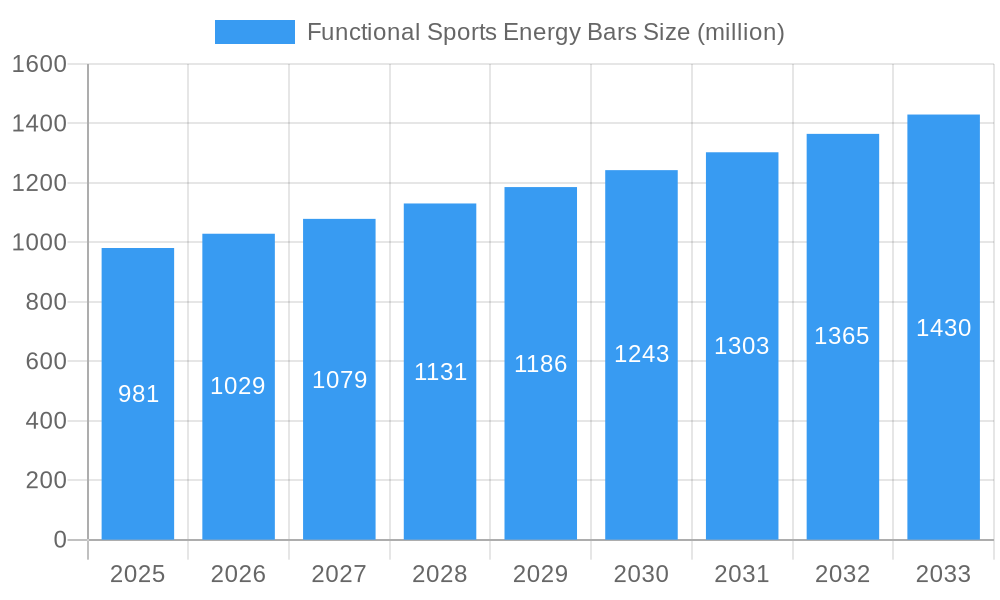
The global functional sports energy bars market is poised for robust expansion, projected to reach an estimated USD 981 million in 2025, with a compound annual growth rate (CAGR) of 4.9% expected to carry it through to 2033. This growth is primarily propelled by an increasing global emphasis on health and wellness, leading consumers to seek convenient and nutritious food options that support active lifestyles. The rising popularity of fitness activities, including running, cycling, and gym workouts, directly fuels the demand for energy bars as a go-to source of quick fuel and recovery. Furthermore, evolving consumer preferences towards natural ingredients and specialized dietary needs are shaping the market, with segments like gluten-free and nut-free options experiencing significant traction as consumers become more informed about product formulations and their impact on personal health. The convenience factor of these bars, easily portable and ready-to-consume, makes them ideal for busy individuals and athletes alike, further solidifying their market presence.
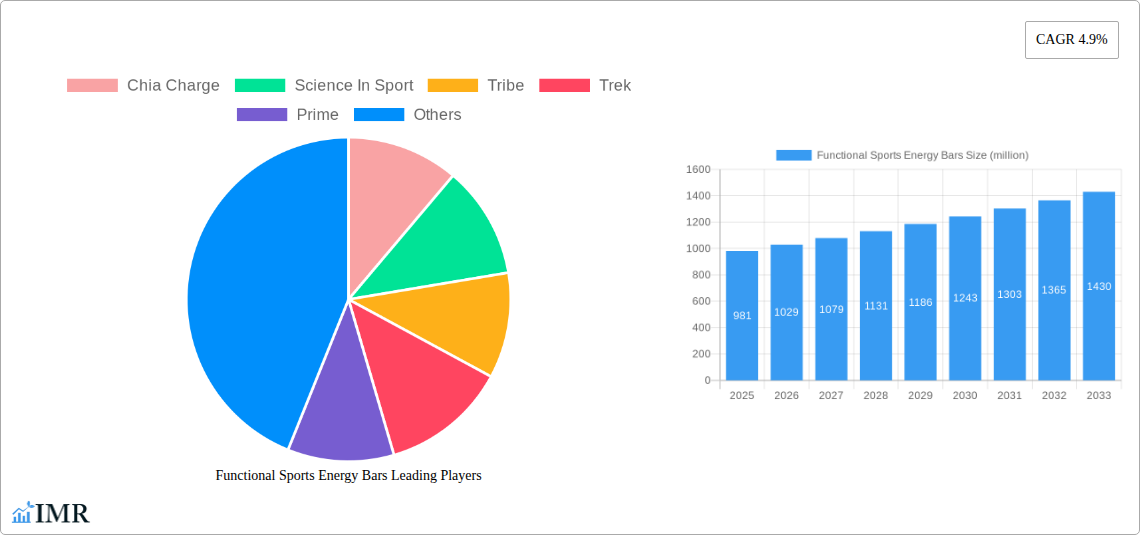
Functional Sports Energy Bars Market Size (In Million)
The market's trajectory is further influenced by a dynamic interplay of drivers and trends. Key drivers include the growing awareness of sports nutrition, the innovation in product development introducing diverse flavors and functional ingredients (such as added protein, vitamins, and adaptogens), and the expansion of distribution channels, especially online sales platforms, which offer greater accessibility and convenience. Trends such as the shift towards plant-based formulations and the demand for transparent labeling are also shaping product offerings. While the market demonstrates strong growth potential, certain restraints, such as the increasing competition from other convenient snack alternatives and the price sensitivity of some consumer segments, need to be navigated. However, the overall outlook remains overwhelmingly positive, driven by a sustained consumer commitment to health, performance, and convenient nutritional solutions, particularly within the burgeoning athletic and fitness communities.
Functional Sports Energy Bars Company Market Share
Functional Sports Energy Bars Market Dynamics & Structure
The functional sports energy bars market exhibits a dynamic and evolving structure, characterized by moderate to high concentration driven by strategic innovation and evolving consumer demands. Technological advancements in ingredient sourcing, formulation science, and sustainable packaging are key drivers, pushing brands to differentiate themselves. Regulatory frameworks, particularly concerning health claims and ingredient transparency, play a crucial role in shaping product development and market entry. Competitive product substitutes, including gels, chews, and powdered drink mixes, necessitate continuous innovation in taste, texture, and functional benefits to maintain market share. End-user demographics are increasingly diverse, encompassing elite athletes, recreational fitness enthusiasts, and health-conscious individuals seeking convenient and nutritious snacks. Mergers and acquisitions (M&A) trends reveal a strategic consolidation, with larger players acquiring innovative startups to expand their product portfolios and market reach. For instance, a significant volume of xx M&A deals have been observed, with an estimated xx million units in deal value during the historical period.
- Market Concentration: Moderate to high, with a few key players holding significant market share.
- Technological Innovation Drivers: Advanced ingredient science, novel delivery systems, sustainable packaging.
- Regulatory Frameworks: Stringent guidelines on health claims, ingredient labeling, and food safety standards.
- Competitive Product Substitutes: Sports gels, hydration powders, nutrient-dense snacks.
- End-User Demographics: Athletes (elite & recreational), fitness enthusiasts, health-conscious consumers.
- M&A Trends: Strategic acquisitions to enhance product offerings and market penetration.
Functional Sports Energy Bars Growth Trends & Insights
The functional sports energy bars market is poised for substantial growth, projecting a Compound Annual Growth Rate (CAGR) of XX% from 2019 to 2033. This robust expansion is fueled by escalating health and wellness awareness, coupled with the increasing participation in sports and physical activities globally. The market size, valued at $XXX million in 2019, is projected to reach $XXX million by 2033, demonstrating a significant upward trajectory. Adoption rates for these specialized nutrition products are steadily rising, driven by a growing understanding of their benefits in enhancing performance, aiding recovery, and providing sustained energy. Technological disruptions, such as the development of plant-based protein sources, adaptogens, and novel functional ingredients like CBD in sports nutrition, are creating new product categories and appealing to a wider consumer base. Consumer behavior shifts are also playing a pivotal role; consumers are increasingly seeking transparent ingredient lists, natural sweeteners, and products that cater to specific dietary needs like gluten-free and nut-free options. This demand for personalized nutrition is driving product diversification and innovation. The market penetration of functional sports energy bars is currently at XX%, with significant room for growth, especially in emerging economies. The shift towards preventative healthcare and proactive wellness management further accentuates the demand for functional foods, positioning energy bars as a convenient and effective solution for active lifestyles. The continuous evolution of research in sports nutrition, coupled with the accessibility of online retail platforms, is democratizing access to these specialized products, further accelerating their adoption.
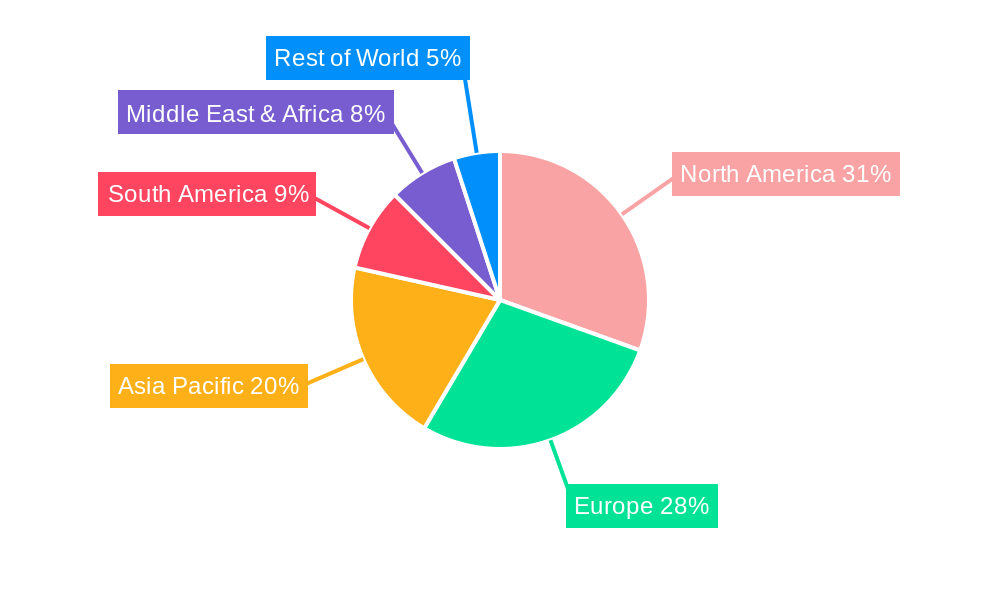
Dominant Regions, Countries, or Segments in Functional Sports Energy Bars
North America currently dominates the functional sports energy bars market, driven by a highly developed sports and fitness culture, significant disposable income, and a strong emphasis on health and wellness. The United States, in particular, leads this regional dominance, accounting for an estimated XX% of the global market share in the base year of 2025. Key drivers for this dominance include widespread participation in various sports, from professional to amateur levels, and a growing consumer base actively seeking performance-enhancing and recovery-focused nutrition.
Application: Online Sales Online sales represent a rapidly growing segment within the functional sports energy bars market, projected to experience a CAGR of XX% during the forecast period. This growth is attributed to the convenience offered by e-commerce platforms, the ability to access a wider variety of brands and products, and effective digital marketing strategies employed by manufacturers.
- E-commerce Growth: Increasing preference for online purchasing for convenience and wider selection.
- Digital Marketing Impact: Targeted advertising and influencer collaborations driving online demand.
- Subscription Models: Growing popularity of subscription services for recurring purchases.
Application: Offline Sales Offline sales, encompassing supermarkets, hypermarkets, specialty sports stores, and convenience stores, still hold a significant market share. However, its growth rate is projected to be slower than online sales, at an estimated CAGR of XX%. This segment benefits from impulse purchases and the ability for consumers to physically inspect products.
- Retail Penetration: Wide availability in diverse retail channels.
- Impulse Purchases: Strategic product placement in high-traffic areas.
- In-Store Promotions: Discount offers and bundle deals driving sales.
Type: Gluten Free The gluten-free segment is a significant growth driver within the functional sports energy bars market, driven by increasing awareness of celiac disease and gluten sensitivity, as well as a general perception of gluten-free as a healthier option. This segment is projected to grow at a CAGR of XX%.
- Dietary Restrictions: Catering to a growing population with gluten-related health issues.
- Health Perception: Gluten-free often associated with a healthier, more natural product.
- Product Innovation: Development of innovative gluten-free formulations with appealing tastes.
Type: Nut Free The nut-free segment is another crucial area of expansion, particularly for individuals with severe nut allergies. This niche, while smaller than gluten-free, is experiencing rapid growth with a CAGR of XX%, driven by increased consumer safety concerns and a demand for inclusive product offerings.
- Allergy Concerns: Addressing the critical need for allergy-safe options.
- Parent Market Appeal: Significant traction within the parent market of families with allergic children.
- Specialized Manufacturing: Focus on dedicated nut-free production facilities.
Functional Sports Energy Bars Product Landscape
The functional sports energy bars product landscape is characterized by continuous innovation, focusing on enhanced performance benefits, improved taste profiles, and clean ingredient formulations. Companies are increasingly investing in research and development to create bars with specific functional attributes, such as sustained energy release, muscle recovery support, cognitive enhancement, and hydration optimization. Product applications span across pre-workout fuel, intra-workout sustenance, and post-workout recovery, catering to diverse athletic needs. Unique selling propositions often revolve around natural ingredients, allergen-free formulations, and the incorporation of superfoods and adaptogens. Technological advancements are leading to the development of bars with optimized macronutrient ratios, advanced carbohydrate blends for better glycogen replenishment, and protein isolates for accelerated muscle repair.
Key Drivers, Barriers & Challenges in Functional Sports Energy Bars
Key Drivers:
- Rising Health and Wellness Consciousness: Increasing consumer focus on active lifestyles and preventative health.
- Growth in Sports Participation: Escalating numbers of individuals engaging in recreational and professional sports.
- Demand for Convenience: Busy lifestyles driving demand for portable and quick nutrition solutions.
- Technological Advancements: Innovations in ingredient formulation and functional benefits.
- Increasing Disposable Income: Higher purchasing power for premium and specialized food products.
Barriers & Challenges:
- Supply Chain Volatility: Fluctuations in the availability and cost of raw materials.
- Regulatory Hurdles: Stringent regulations on health claims and ingredient sourcing.
- Intense Competition: Crowded market with numerous established and emerging brands.
- Price Sensitivity: Consumer willingness to pay premium prices for functional benefits.
- Consumer Education: Need to effectively communicate the specific functional benefits of products.
Emerging Opportunities in Functional Sports Energy Bars
Emerging opportunities in the functional sports energy bars sector lie in the development of personalized nutrition solutions tailored to individual metabolic profiles and training regimens. The burgeoning plant-based movement presents a significant avenue, with demand for vegan and vegetarian-friendly bars utilizing novel protein sources like pea, rice, and hemp. Furthermore, the integration of bio-active compounds such as adaptogens (e.g., ashwagandha, rhodiola) and nootropics for cognitive enhancement during endurance activities offers a compelling niche. Tapping into the growing market of "everyday athletes" and individuals seeking functional snacks for general well-being, beyond elite performance, represents another vast untapped market.
Growth Accelerators in the Functional Sports Energy Bars Industry
Growth accelerators in the functional sports energy bars industry are predominantly driven by continuous product innovation and strategic market expansion. The development of bars with unique ingredient combinations, such as those incorporating probiotics for gut health or sustained-release carbohydrates for prolonged energy, significantly boosts market appeal. Strategic partnerships with fitness influencers, athletic organizations, and health professionals are crucial for brand credibility and wider consumer outreach. Furthermore, expansion into emerging economies with growing disposable incomes and increasing interest in fitness activities presents substantial long-term growth potential. The adoption of sustainable sourcing and eco-friendly packaging also resonates with an increasingly environmentally conscious consumer base, acting as a significant growth catalyst.
Key Players Shaping the Functional Sports Energy Bars Market
- Chia Charge
- Science In Sport
- Tribe
- Trek
- Prime
- Clif Bar
- Battle Oats
- High5
- Eastman
- General Mills
- Luna Bar
- Nature Valley
- PROBAR
- Kate's Real Food
- TAOS BAKES
- Bobo's Oat Bars
Notable Milestones in Functional Sports Energy Bars Sector
- 2019: Launch of innovative plant-based protein bars with unique flavor profiles.
- 2020: Increased focus on allergen-free formulations, particularly nut-free and gluten-free options.
- 2021: Significant M&A activity as larger corporations acquire niche brands for portfolio expansion.
- 2022: Introduction of bars with added functional ingredients like adaptogens and nootropics.
- 2023: Enhanced sustainability initiatives in packaging and ingredient sourcing gain prominence.
- 2024: Rise of personalized nutrition platforms offering custom-formulated energy bars.
In-Depth Functional Sports Energy Bars Market Outlook
The functional sports energy bars market is projected to maintain a strong upward trajectory, driven by sustained consumer demand for convenient, performance-enhancing nutrition and the industry's commitment to innovation. Key growth accelerators include the ongoing development of specialized formulations targeting specific athletic needs, the expanding appeal of plant-based and allergen-free options, and strategic market penetration into developing regions. Future market potential is immense, with opportunities to further leverage technological advancements in ingredient science and explore novel applications beyond traditional sports nutrition, such as cognitive support and immune health. Strategic partnerships, sustainable practices, and a focus on transparent ingredient sourcing will be crucial for continued market leadership and capturing evolving consumer preferences.
Functional Sports Energy Bars Segmentation
-
1. Application
- 1.1. Online Sales
- 1.2. Offline Sales
-
2. Type
- 2.1. Gluten Free
- 2.2. Nut Free
Functional Sports Energy Bars Segmentation By Geography
-
1. North America
- 1.1. United States
- 1.2. Canada
- 1.3. Mexico
-
2. South America
- 2.1. Brazil
- 2.2. Argentina
- 2.3. Rest of South America
-
3. Europe
- 3.1. United Kingdom
- 3.2. Germany
- 3.3. France
- 3.4. Italy
- 3.5. Spain
- 3.6. Russia
- 3.7. Benelux
- 3.8. Nordics
- 3.9. Rest of Europe
-
4. Middle East & Africa
- 4.1. Turkey
- 4.2. Israel
- 4.3. GCC
- 4.4. North Africa
- 4.5. South Africa
- 4.6. Rest of Middle East & Africa
-
5. Asia Pacific
- 5.1. China
- 5.2. India
- 5.3. Japan
- 5.4. South Korea
- 5.5. ASEAN
- 5.6. Oceania
- 5.7. Rest of Asia Pacific
Functional Sports Energy Bars Regional Market Share
Geographic Coverage of Functional Sports Energy Bars
Functional Sports Energy Bars REPORT HIGHLIGHTS
| Aspects | Details |
|---|---|
| Study Period | 2020-2034 |
| Base Year | 2025 |
| Estimated Year | 2026 |
| Forecast Period | 2026-2034 |
| Historical Period | 2020-2025 |
| Growth Rate | CAGR of 4.9% from 2020-2034 |
| Segmentation |
|
Table of Contents
- 1. Introduction
- 1.1. Research Scope
- 1.2. Market Segmentation
- 1.3. Research Methodology
- 1.4. Definitions and Assumptions
- 2. Executive Summary
- 2.1. Introduction
- 3. Market Dynamics
- 3.1. Introduction
- 3.2. Market Drivers
- 3.3. Market Restrains
- 3.4. Market Trends
- 4. Market Factor Analysis
- 4.1. Porters Five Forces
- 4.2. Supply/Value Chain
- 4.3. PESTEL analysis
- 4.4. Market Entropy
- 4.5. Patent/Trademark Analysis
- 5. Global Functional Sports Energy Bars Analysis, Insights and Forecast, 2020-2032
- 5.1. Market Analysis, Insights and Forecast - by Application
- 5.1.1. Online Sales
- 5.1.2. Offline Sales
- 5.2. Market Analysis, Insights and Forecast - by Type
- 5.2.1. Gluten Free
- 5.2.2. Nut Free
- 5.3. Market Analysis, Insights and Forecast - by Region
- 5.3.1. North America
- 5.3.2. South America
- 5.3.3. Europe
- 5.3.4. Middle East & Africa
- 5.3.5. Asia Pacific
- 5.1. Market Analysis, Insights and Forecast - by Application
- 6. North America Functional Sports Energy Bars Analysis, Insights and Forecast, 2020-2032
- 6.1. Market Analysis, Insights and Forecast - by Application
- 6.1.1. Online Sales
- 6.1.2. Offline Sales
- 6.2. Market Analysis, Insights and Forecast - by Type
- 6.2.1. Gluten Free
- 6.2.2. Nut Free
- 6.1. Market Analysis, Insights and Forecast - by Application
- 7. South America Functional Sports Energy Bars Analysis, Insights and Forecast, 2020-2032
- 7.1. Market Analysis, Insights and Forecast - by Application
- 7.1.1. Online Sales
- 7.1.2. Offline Sales
- 7.2. Market Analysis, Insights and Forecast - by Type
- 7.2.1. Gluten Free
- 7.2.2. Nut Free
- 7.1. Market Analysis, Insights and Forecast - by Application
- 8. Europe Functional Sports Energy Bars Analysis, Insights and Forecast, 2020-2032
- 8.1. Market Analysis, Insights and Forecast - by Application
- 8.1.1. Online Sales
- 8.1.2. Offline Sales
- 8.2. Market Analysis, Insights and Forecast - by Type
- 8.2.1. Gluten Free
- 8.2.2. Nut Free
- 8.1. Market Analysis, Insights and Forecast - by Application
- 9. Middle East & Africa Functional Sports Energy Bars Analysis, Insights and Forecast, 2020-2032
- 9.1. Market Analysis, Insights and Forecast - by Application
- 9.1.1. Online Sales
- 9.1.2. Offline Sales
- 9.2. Market Analysis, Insights and Forecast - by Type
- 9.2.1. Gluten Free
- 9.2.2. Nut Free
- 9.1. Market Analysis, Insights and Forecast - by Application
- 10. Asia Pacific Functional Sports Energy Bars Analysis, Insights and Forecast, 2020-2032
- 10.1. Market Analysis, Insights and Forecast - by Application
- 10.1.1. Online Sales
- 10.1.2. Offline Sales
- 10.2. Market Analysis, Insights and Forecast - by Type
- 10.2.1. Gluten Free
- 10.2.2. Nut Free
- 10.1. Market Analysis, Insights and Forecast - by Application
- 11. Competitive Analysis
- 11.1. Global Market Share Analysis 2025
- 11.2. Company Profiles
- 11.2.1 Chia Charge
- 11.2.1.1. Overview
- 11.2.1.2. Products
- 11.2.1.3. SWOT Analysis
- 11.2.1.4. Recent Developments
- 11.2.1.5. Financials (Based on Availability)
- 11.2.2 Science In Sport
- 11.2.2.1. Overview
- 11.2.2.2. Products
- 11.2.2.3. SWOT Analysis
- 11.2.2.4. Recent Developments
- 11.2.2.5. Financials (Based on Availability)
- 11.2.3 Tribe
- 11.2.3.1. Overview
- 11.2.3.2. Products
- 11.2.3.3. SWOT Analysis
- 11.2.3.4. Recent Developments
- 11.2.3.5. Financials (Based on Availability)
- 11.2.4 Trek
- 11.2.4.1. Overview
- 11.2.4.2. Products
- 11.2.4.3. SWOT Analysis
- 11.2.4.4. Recent Developments
- 11.2.4.5. Financials (Based on Availability)
- 11.2.5 Prime
- 11.2.5.1. Overview
- 11.2.5.2. Products
- 11.2.5.3. SWOT Analysis
- 11.2.5.4. Recent Developments
- 11.2.5.5. Financials (Based on Availability)
- 11.2.6 Clif Bar
- 11.2.6.1. Overview
- 11.2.6.2. Products
- 11.2.6.3. SWOT Analysis
- 11.2.6.4. Recent Developments
- 11.2.6.5. Financials (Based on Availability)
- 11.2.7 Battle Oats
- 11.2.7.1. Overview
- 11.2.7.2. Products
- 11.2.7.3. SWOT Analysis
- 11.2.7.4. Recent Developments
- 11.2.7.5. Financials (Based on Availability)
- 11.2.8 High5
- 11.2.8.1. Overview
- 11.2.8.2. Products
- 11.2.8.3. SWOT Analysis
- 11.2.8.4. Recent Developments
- 11.2.8.5. Financials (Based on Availability)
- 11.2.9 Eastman
- 11.2.9.1. Overview
- 11.2.9.2. Products
- 11.2.9.3. SWOT Analysis
- 11.2.9.4. Recent Developments
- 11.2.9.5. Financials (Based on Availability)
- 11.2.10 General Mills
- 11.2.10.1. Overview
- 11.2.10.2. Products
- 11.2.10.3. SWOT Analysis
- 11.2.10.4. Recent Developments
- 11.2.10.5. Financials (Based on Availability)
- 11.2.11 Luna Bar
- 11.2.11.1. Overview
- 11.2.11.2. Products
- 11.2.11.3. SWOT Analysis
- 11.2.11.4. Recent Developments
- 11.2.11.5. Financials (Based on Availability)
- 11.2.12 Nature Valley
- 11.2.12.1. Overview
- 11.2.12.2. Products
- 11.2.12.3. SWOT Analysis
- 11.2.12.4. Recent Developments
- 11.2.12.5. Financials (Based on Availability)
- 11.2.13 PROBAR
- 11.2.13.1. Overview
- 11.2.13.2. Products
- 11.2.13.3. SWOT Analysis
- 11.2.13.4. Recent Developments
- 11.2.13.5. Financials (Based on Availability)
- 11.2.14 Kate's Real Food
- 11.2.14.1. Overview
- 11.2.14.2. Products
- 11.2.14.3. SWOT Analysis
- 11.2.14.4. Recent Developments
- 11.2.14.5. Financials (Based on Availability)
- 11.2.15 TAOS BAKES
- 11.2.15.1. Overview
- 11.2.15.2. Products
- 11.2.15.3. SWOT Analysis
- 11.2.15.4. Recent Developments
- 11.2.15.5. Financials (Based on Availability)
- 11.2.16 Bobo's Oat Bars
- 11.2.16.1. Overview
- 11.2.16.2. Products
- 11.2.16.3. SWOT Analysis
- 11.2.16.4. Recent Developments
- 11.2.16.5. Financials (Based on Availability)
- 11.2.1 Chia Charge
List of Figures
- Figure 1: Global Functional Sports Energy Bars Revenue Breakdown (million, %) by Region 2025 & 2033
- Figure 2: Global Functional Sports Energy Bars Volume Breakdown (K, %) by Region 2025 & 2033
- Figure 3: North America Functional Sports Energy Bars Revenue (million), by Application 2025 & 2033
- Figure 4: North America Functional Sports Energy Bars Volume (K), by Application 2025 & 2033
- Figure 5: North America Functional Sports Energy Bars Revenue Share (%), by Application 2025 & 2033
- Figure 6: North America Functional Sports Energy Bars Volume Share (%), by Application 2025 & 2033
- Figure 7: North America Functional Sports Energy Bars Revenue (million), by Type 2025 & 2033
- Figure 8: North America Functional Sports Energy Bars Volume (K), by Type 2025 & 2033
- Figure 9: North America Functional Sports Energy Bars Revenue Share (%), by Type 2025 & 2033
- Figure 10: North America Functional Sports Energy Bars Volume Share (%), by Type 2025 & 2033
- Figure 11: North America Functional Sports Energy Bars Revenue (million), by Country 2025 & 2033
- Figure 12: North America Functional Sports Energy Bars Volume (K), by Country 2025 & 2033
- Figure 13: North America Functional Sports Energy Bars Revenue Share (%), by Country 2025 & 2033
- Figure 14: North America Functional Sports Energy Bars Volume Share (%), by Country 2025 & 2033
- Figure 15: South America Functional Sports Energy Bars Revenue (million), by Application 2025 & 2033
- Figure 16: South America Functional Sports Energy Bars Volume (K), by Application 2025 & 2033
- Figure 17: South America Functional Sports Energy Bars Revenue Share (%), by Application 2025 & 2033
- Figure 18: South America Functional Sports Energy Bars Volume Share (%), by Application 2025 & 2033
- Figure 19: South America Functional Sports Energy Bars Revenue (million), by Type 2025 & 2033
- Figure 20: South America Functional Sports Energy Bars Volume (K), by Type 2025 & 2033
- Figure 21: South America Functional Sports Energy Bars Revenue Share (%), by Type 2025 & 2033
- Figure 22: South America Functional Sports Energy Bars Volume Share (%), by Type 2025 & 2033
- Figure 23: South America Functional Sports Energy Bars Revenue (million), by Country 2025 & 2033
- Figure 24: South America Functional Sports Energy Bars Volume (K), by Country 2025 & 2033
- Figure 25: South America Functional Sports Energy Bars Revenue Share (%), by Country 2025 & 2033
- Figure 26: South America Functional Sports Energy Bars Volume Share (%), by Country 2025 & 2033
- Figure 27: Europe Functional Sports Energy Bars Revenue (million), by Application 2025 & 2033
- Figure 28: Europe Functional Sports Energy Bars Volume (K), by Application 2025 & 2033
- Figure 29: Europe Functional Sports Energy Bars Revenue Share (%), by Application 2025 & 2033
- Figure 30: Europe Functional Sports Energy Bars Volume Share (%), by Application 2025 & 2033
- Figure 31: Europe Functional Sports Energy Bars Revenue (million), by Type 2025 & 2033
- Figure 32: Europe Functional Sports Energy Bars Volume (K), by Type 2025 & 2033
- Figure 33: Europe Functional Sports Energy Bars Revenue Share (%), by Type 2025 & 2033
- Figure 34: Europe Functional Sports Energy Bars Volume Share (%), by Type 2025 & 2033
- Figure 35: Europe Functional Sports Energy Bars Revenue (million), by Country 2025 & 2033
- Figure 36: Europe Functional Sports Energy Bars Volume (K), by Country 2025 & 2033
- Figure 37: Europe Functional Sports Energy Bars Revenue Share (%), by Country 2025 & 2033
- Figure 38: Europe Functional Sports Energy Bars Volume Share (%), by Country 2025 & 2033
- Figure 39: Middle East & Africa Functional Sports Energy Bars Revenue (million), by Application 2025 & 2033
- Figure 40: Middle East & Africa Functional Sports Energy Bars Volume (K), by Application 2025 & 2033
- Figure 41: Middle East & Africa Functional Sports Energy Bars Revenue Share (%), by Application 2025 & 2033
- Figure 42: Middle East & Africa Functional Sports Energy Bars Volume Share (%), by Application 2025 & 2033
- Figure 43: Middle East & Africa Functional Sports Energy Bars Revenue (million), by Type 2025 & 2033
- Figure 44: Middle East & Africa Functional Sports Energy Bars Volume (K), by Type 2025 & 2033
- Figure 45: Middle East & Africa Functional Sports Energy Bars Revenue Share (%), by Type 2025 & 2033
- Figure 46: Middle East & Africa Functional Sports Energy Bars Volume Share (%), by Type 2025 & 2033
- Figure 47: Middle East & Africa Functional Sports Energy Bars Revenue (million), by Country 2025 & 2033
- Figure 48: Middle East & Africa Functional Sports Energy Bars Volume (K), by Country 2025 & 2033
- Figure 49: Middle East & Africa Functional Sports Energy Bars Revenue Share (%), by Country 2025 & 2033
- Figure 50: Middle East & Africa Functional Sports Energy Bars Volume Share (%), by Country 2025 & 2033
- Figure 51: Asia Pacific Functional Sports Energy Bars Revenue (million), by Application 2025 & 2033
- Figure 52: Asia Pacific Functional Sports Energy Bars Volume (K), by Application 2025 & 2033
- Figure 53: Asia Pacific Functional Sports Energy Bars Revenue Share (%), by Application 2025 & 2033
- Figure 54: Asia Pacific Functional Sports Energy Bars Volume Share (%), by Application 2025 & 2033
- Figure 55: Asia Pacific Functional Sports Energy Bars Revenue (million), by Type 2025 & 2033
- Figure 56: Asia Pacific Functional Sports Energy Bars Volume (K), by Type 2025 & 2033
- Figure 57: Asia Pacific Functional Sports Energy Bars Revenue Share (%), by Type 2025 & 2033
- Figure 58: Asia Pacific Functional Sports Energy Bars Volume Share (%), by Type 2025 & 2033
- Figure 59: Asia Pacific Functional Sports Energy Bars Revenue (million), by Country 2025 & 2033
- Figure 60: Asia Pacific Functional Sports Energy Bars Volume (K), by Country 2025 & 2033
- Figure 61: Asia Pacific Functional Sports Energy Bars Revenue Share (%), by Country 2025 & 2033
- Figure 62: Asia Pacific Functional Sports Energy Bars Volume Share (%), by Country 2025 & 2033
List of Tables
- Table 1: Global Functional Sports Energy Bars Revenue million Forecast, by Application 2020 & 2033
- Table 2: Global Functional Sports Energy Bars Volume K Forecast, by Application 2020 & 2033
- Table 3: Global Functional Sports Energy Bars Revenue million Forecast, by Type 2020 & 2033
- Table 4: Global Functional Sports Energy Bars Volume K Forecast, by Type 2020 & 2033
- Table 5: Global Functional Sports Energy Bars Revenue million Forecast, by Region 2020 & 2033
- Table 6: Global Functional Sports Energy Bars Volume K Forecast, by Region 2020 & 2033
- Table 7: Global Functional Sports Energy Bars Revenue million Forecast, by Application 2020 & 2033
- Table 8: Global Functional Sports Energy Bars Volume K Forecast, by Application 2020 & 2033
- Table 9: Global Functional Sports Energy Bars Revenue million Forecast, by Type 2020 & 2033
- Table 10: Global Functional Sports Energy Bars Volume K Forecast, by Type 2020 & 2033
- Table 11: Global Functional Sports Energy Bars Revenue million Forecast, by Country 2020 & 2033
- Table 12: Global Functional Sports Energy Bars Volume K Forecast, by Country 2020 & 2033
- Table 13: United States Functional Sports Energy Bars Revenue (million) Forecast, by Application 2020 & 2033
- Table 14: United States Functional Sports Energy Bars Volume (K) Forecast, by Application 2020 & 2033
- Table 15: Canada Functional Sports Energy Bars Revenue (million) Forecast, by Application 2020 & 2033
- Table 16: Canada Functional Sports Energy Bars Volume (K) Forecast, by Application 2020 & 2033
- Table 17: Mexico Functional Sports Energy Bars Revenue (million) Forecast, by Application 2020 & 2033
- Table 18: Mexico Functional Sports Energy Bars Volume (K) Forecast, by Application 2020 & 2033
- Table 19: Global Functional Sports Energy Bars Revenue million Forecast, by Application 2020 & 2033
- Table 20: Global Functional Sports Energy Bars Volume K Forecast, by Application 2020 & 2033
- Table 21: Global Functional Sports Energy Bars Revenue million Forecast, by Type 2020 & 2033
- Table 22: Global Functional Sports Energy Bars Volume K Forecast, by Type 2020 & 2033
- Table 23: Global Functional Sports Energy Bars Revenue million Forecast, by Country 2020 & 2033
- Table 24: Global Functional Sports Energy Bars Volume K Forecast, by Country 2020 & 2033
- Table 25: Brazil Functional Sports Energy Bars Revenue (million) Forecast, by Application 2020 & 2033
- Table 26: Brazil Functional Sports Energy Bars Volume (K) Forecast, by Application 2020 & 2033
- Table 27: Argentina Functional Sports Energy Bars Revenue (million) Forecast, by Application 2020 & 2033
- Table 28: Argentina Functional Sports Energy Bars Volume (K) Forecast, by Application 2020 & 2033
- Table 29: Rest of South America Functional Sports Energy Bars Revenue (million) Forecast, by Application 2020 & 2033
- Table 30: Rest of South America Functional Sports Energy Bars Volume (K) Forecast, by Application 2020 & 2033
- Table 31: Global Functional Sports Energy Bars Revenue million Forecast, by Application 2020 & 2033
- Table 32: Global Functional Sports Energy Bars Volume K Forecast, by Application 2020 & 2033
- Table 33: Global Functional Sports Energy Bars Revenue million Forecast, by Type 2020 & 2033
- Table 34: Global Functional Sports Energy Bars Volume K Forecast, by Type 2020 & 2033
- Table 35: Global Functional Sports Energy Bars Revenue million Forecast, by Country 2020 & 2033
- Table 36: Global Functional Sports Energy Bars Volume K Forecast, by Country 2020 & 2033
- Table 37: United Kingdom Functional Sports Energy Bars Revenue (million) Forecast, by Application 2020 & 2033
- Table 38: United Kingdom Functional Sports Energy Bars Volume (K) Forecast, by Application 2020 & 2033
- Table 39: Germany Functional Sports Energy Bars Revenue (million) Forecast, by Application 2020 & 2033
- Table 40: Germany Functional Sports Energy Bars Volume (K) Forecast, by Application 2020 & 2033
- Table 41: France Functional Sports Energy Bars Revenue (million) Forecast, by Application 2020 & 2033
- Table 42: France Functional Sports Energy Bars Volume (K) Forecast, by Application 2020 & 2033
- Table 43: Italy Functional Sports Energy Bars Revenue (million) Forecast, by Application 2020 & 2033
- Table 44: Italy Functional Sports Energy Bars Volume (K) Forecast, by Application 2020 & 2033
- Table 45: Spain Functional Sports Energy Bars Revenue (million) Forecast, by Application 2020 & 2033
- Table 46: Spain Functional Sports Energy Bars Volume (K) Forecast, by Application 2020 & 2033
- Table 47: Russia Functional Sports Energy Bars Revenue (million) Forecast, by Application 2020 & 2033
- Table 48: Russia Functional Sports Energy Bars Volume (K) Forecast, by Application 2020 & 2033
- Table 49: Benelux Functional Sports Energy Bars Revenue (million) Forecast, by Application 2020 & 2033
- Table 50: Benelux Functional Sports Energy Bars Volume (K) Forecast, by Application 2020 & 2033
- Table 51: Nordics Functional Sports Energy Bars Revenue (million) Forecast, by Application 2020 & 2033
- Table 52: Nordics Functional Sports Energy Bars Volume (K) Forecast, by Application 2020 & 2033
- Table 53: Rest of Europe Functional Sports Energy Bars Revenue (million) Forecast, by Application 2020 & 2033
- Table 54: Rest of Europe Functional Sports Energy Bars Volume (K) Forecast, by Application 2020 & 2033
- Table 55: Global Functional Sports Energy Bars Revenue million Forecast, by Application 2020 & 2033
- Table 56: Global Functional Sports Energy Bars Volume K Forecast, by Application 2020 & 2033
- Table 57: Global Functional Sports Energy Bars Revenue million Forecast, by Type 2020 & 2033
- Table 58: Global Functional Sports Energy Bars Volume K Forecast, by Type 2020 & 2033
- Table 59: Global Functional Sports Energy Bars Revenue million Forecast, by Country 2020 & 2033
- Table 60: Global Functional Sports Energy Bars Volume K Forecast, by Country 2020 & 2033
- Table 61: Turkey Functional Sports Energy Bars Revenue (million) Forecast, by Application 2020 & 2033
- Table 62: Turkey Functional Sports Energy Bars Volume (K) Forecast, by Application 2020 & 2033
- Table 63: Israel Functional Sports Energy Bars Revenue (million) Forecast, by Application 2020 & 2033
- Table 64: Israel Functional Sports Energy Bars Volume (K) Forecast, by Application 2020 & 2033
- Table 65: GCC Functional Sports Energy Bars Revenue (million) Forecast, by Application 2020 & 2033
- Table 66: GCC Functional Sports Energy Bars Volume (K) Forecast, by Application 2020 & 2033
- Table 67: North Africa Functional Sports Energy Bars Revenue (million) Forecast, by Application 2020 & 2033
- Table 68: North Africa Functional Sports Energy Bars Volume (K) Forecast, by Application 2020 & 2033
- Table 69: South Africa Functional Sports Energy Bars Revenue (million) Forecast, by Application 2020 & 2033
- Table 70: South Africa Functional Sports Energy Bars Volume (K) Forecast, by Application 2020 & 2033
- Table 71: Rest of Middle East & Africa Functional Sports Energy Bars Revenue (million) Forecast, by Application 2020 & 2033
- Table 72: Rest of Middle East & Africa Functional Sports Energy Bars Volume (K) Forecast, by Application 2020 & 2033
- Table 73: Global Functional Sports Energy Bars Revenue million Forecast, by Application 2020 & 2033
- Table 74: Global Functional Sports Energy Bars Volume K Forecast, by Application 2020 & 2033
- Table 75: Global Functional Sports Energy Bars Revenue million Forecast, by Type 2020 & 2033
- Table 76: Global Functional Sports Energy Bars Volume K Forecast, by Type 2020 & 2033
- Table 77: Global Functional Sports Energy Bars Revenue million Forecast, by Country 2020 & 2033
- Table 78: Global Functional Sports Energy Bars Volume K Forecast, by Country 2020 & 2033
- Table 79: China Functional Sports Energy Bars Revenue (million) Forecast, by Application 2020 & 2033
- Table 80: China Functional Sports Energy Bars Volume (K) Forecast, by Application 2020 & 2033
- Table 81: India Functional Sports Energy Bars Revenue (million) Forecast, by Application 2020 & 2033
- Table 82: India Functional Sports Energy Bars Volume (K) Forecast, by Application 2020 & 2033
- Table 83: Japan Functional Sports Energy Bars Revenue (million) Forecast, by Application 2020 & 2033
- Table 84: Japan Functional Sports Energy Bars Volume (K) Forecast, by Application 2020 & 2033
- Table 85: South Korea Functional Sports Energy Bars Revenue (million) Forecast, by Application 2020 & 2033
- Table 86: South Korea Functional Sports Energy Bars Volume (K) Forecast, by Application 2020 & 2033
- Table 87: ASEAN Functional Sports Energy Bars Revenue (million) Forecast, by Application 2020 & 2033
- Table 88: ASEAN Functional Sports Energy Bars Volume (K) Forecast, by Application 2020 & 2033
- Table 89: Oceania Functional Sports Energy Bars Revenue (million) Forecast, by Application 2020 & 2033
- Table 90: Oceania Functional Sports Energy Bars Volume (K) Forecast, by Application 2020 & 2033
- Table 91: Rest of Asia Pacific Functional Sports Energy Bars Revenue (million) Forecast, by Application 2020 & 2033
- Table 92: Rest of Asia Pacific Functional Sports Energy Bars Volume (K) Forecast, by Application 2020 & 2033
Frequently Asked Questions
1. What is the projected Compound Annual Growth Rate (CAGR) of the Functional Sports Energy Bars?
The projected CAGR is approximately 4.9%.
2. Which companies are prominent players in the Functional Sports Energy Bars?
Key companies in the market include Chia Charge, Science In Sport, Tribe, Trek, Prime, Clif Bar, Battle Oats, High5, Eastman, General Mills, Luna Bar, Nature Valley, PROBAR, Kate's Real Food, TAOS BAKES, Bobo's Oat Bars.
3. What are the main segments of the Functional Sports Energy Bars?
The market segments include Application, Type.
4. Can you provide details about the market size?
The market size is estimated to be USD 981 million as of 2022.
5. What are some drivers contributing to market growth?
N/A
6. What are the notable trends driving market growth?
N/A
7. Are there any restraints impacting market growth?
N/A
8. Can you provide examples of recent developments in the market?
N/A
9. What pricing options are available for accessing the report?
Pricing options include single-user, multi-user, and enterprise licenses priced at USD 3950.00, USD 5925.00, and USD 7900.00 respectively.
10. Is the market size provided in terms of value or volume?
The market size is provided in terms of value, measured in million and volume, measured in K.
11. Are there any specific market keywords associated with the report?
Yes, the market keyword associated with the report is "Functional Sports Energy Bars," which aids in identifying and referencing the specific market segment covered.
12. How do I determine which pricing option suits my needs best?
The pricing options vary based on user requirements and access needs. Individual users may opt for single-user licenses, while businesses requiring broader access may choose multi-user or enterprise licenses for cost-effective access to the report.
13. Are there any additional resources or data provided in the Functional Sports Energy Bars report?
While the report offers comprehensive insights, it's advisable to review the specific contents or supplementary materials provided to ascertain if additional resources or data are available.
14. How can I stay updated on further developments or reports in the Functional Sports Energy Bars?
To stay informed about further developments, trends, and reports in the Functional Sports Energy Bars, consider subscribing to industry newsletters, following relevant companies and organizations, or regularly checking reputable industry news sources and publications.
Methodology
Step 1 - Identification of Relevant Samples Size from Population Database


Step 2 - Approaches for Defining Global Market Size (Value, Volume* & Price*)

Note*: In applicable scenarios
Step 3 - Data Sources
Primary Research
- Web Analytics
- Survey Reports
- Research Institute
- Latest Research Reports
- Opinion Leaders
Secondary Research
- Annual Reports
- White Paper
- Latest Press Release
- Industry Association
- Paid Database
- Investor Presentations

Step 4 - Data Triangulation
Involves using different sources of information in order to increase the validity of a study
These sources are likely to be stakeholders in a program - participants, other researchers, program staff, other community members, and so on.
Then we put all data in single framework & apply various statistical tools to find out the dynamic on the market.
During the analysis stage, feedback from the stakeholder groups would be compared to determine areas of agreement as well as areas of divergence