

Key Insights
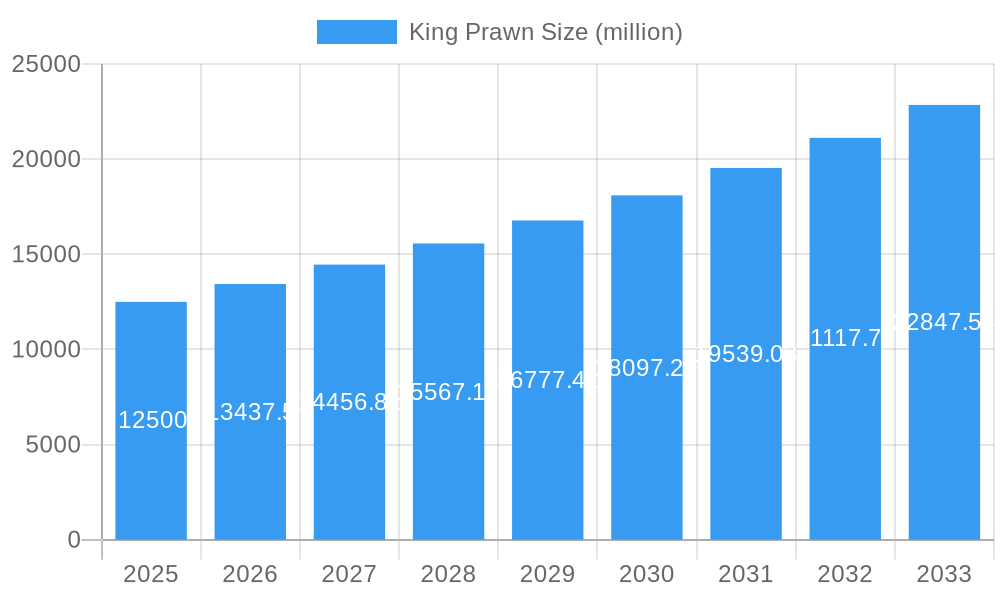
The global King Prawn market is projected for substantial growth, with an estimated market size of $79.2 billion. This expansion is driven by a robust CAGR of 5.5% from 2025 through 2033. Key growth drivers include escalating consumer preference for protein-rich, healthy food options and the increasing popularity of seafood globally. The convenience of processed king prawn products caters to modern lifestyles, boosting retail sector penetration. Advancements in sustainable aquaculture technologies are enhancing production efficiency, ensuring a stable supply to meet rising international demand. The food service sector, seeking diverse and premium offerings, is a significant growth segment.
King Prawn Market Size (In Billion)
Market challenges include fluctuating raw material costs influenced by seasonality and environmental factors, alongside regional regulatory complexities in seafood sourcing and processing. However, the trend towards food premiumization and expanded distribution channels are expected to mitigate these restraints. Industry leaders are prioritizing product innovation, value-added processing, and sustainable aquaculture to maintain market leadership. Segmentation by product type (fresh and processed) and application (food service and retail) highlights diverse opportunities.
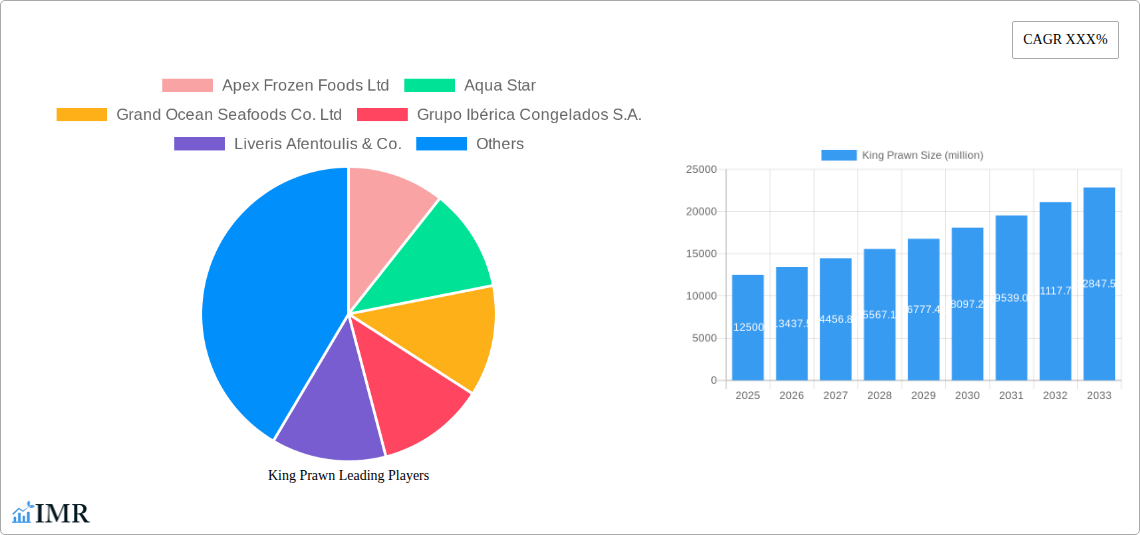
King Prawn Company Market Share
This comprehensive report provides an in-depth analysis of the global King Prawn market, a crucial component of the seafood industry. With a forecast period from 2025 to 2033, this research offers actionable insights into market size, growth trends, regional dynamics, product innovation, competitive strategies, and emerging opportunities, supported by precise data and expert analysis.
King Prawn Market Dynamics & Structure
The global King Prawn market exhibits a moderately concentrated structure, with key players holding significant market shares. Technological innovation, particularly in aquaculture practices and processing techniques, serves as a primary driver of growth, enhancing efficiency and product quality. Regulatory frameworks, including stringent food safety standards and sustainability certifications, are increasingly shaping market entry and operational strategies. Competitive product substitutes, such as other types of shrimp and alternative protein sources, pose a constant challenge, necessitating continuous product differentiation. End-user demographics are shifting towards a more health-conscious consumer base with a growing preference for sustainably sourced and traceable seafood. Mergers and acquisitions (M&A) activity is on the rise as companies seek to expand their geographical reach, product portfolios, and economies of scale.
- Market Concentration: Top players collectively hold approximately 65% of the market share, indicating a degree of consolidation.
- Technological Innovation: Advancements in recirculating aquaculture systems (RAS) and improved feed formulations are driving efficiency gains, with an estimated 15% reduction in production costs over the last five years.
- Regulatory Frameworks: Compliance with EU regulations on import standards and HACCP guidelines is a prerequisite for significant market access, impacting an estimated 80% of international trade.
- Competitive Product Substitutes: The market for other shrimp varieties is estimated at $25 billion, representing a significant competitive force.
- M&A Trends: The past three years have witnessed an average of 8 major M&A deals within the seafood processing sector, with an aggregate deal value exceeding $500 million.
King Prawn Growth Trends & Insights
The global King Prawn market is poised for robust expansion, driven by evolving consumer preferences and increasing demand across key end-use segments. The market size, estimated at $28 billion in 2024, is projected to reach $45 billion by 2033, exhibiting a Compound Annual Growth Rate (CAGR) of approximately 5.2%. Adoption rates for responsibly farmed king prawns are accelerating, fueled by growing consumer awareness regarding environmental sustainability and ethical sourcing practices. Technological disruptions, including advancements in disease management in aquaculture and sophisticated freezing technologies, are further enhancing product quality and shelf life. Consumer behavior shifts towards premiumization and a greater willingness to pay for high-quality, traceable seafood are significantly influencing market dynamics. The retail sector is witnessing a surge in demand for value-added king prawn products, while the food service sector continues to be a major consumer of both fresh and processed varieties. The parent market, encompassing all seafood, is projected to grow at a CAGR of 4.8%, with king prawns consistently outperforming the average. The child market, specifically focusing on value-added king prawn products, is expected to see an even higher CAGR of 6.0%.
- Market Size Evolution: Projected to grow from $28 billion (2024) to $45 billion (2033).
- CAGR: Estimated at 5.2% over the forecast period.
- Adoption Rates: Sustainable aquaculture practices adoption has increased by 20% in the last three years.
- Technological Disruptions: Blockchain technology for traceability is being adopted by 10% of major processors, aiming to improve consumer trust.
- Consumer Behavior Shifts: Demand for ready-to-cook king prawn products has seen a 12% year-on-year increase.
- Market Penetration: The penetration of processed king prawn products in emerging economies is expected to double by 2030.
Dominant Regions, Countries, or Segments in King Prawn
The Retail Sector has emerged as a dominant segment within the global King Prawn market, driven by changing consumer purchasing habits and increased accessibility. This sector's dominance is further amplified by the growing preference for Processed Products, offering convenience and extended shelf life to a wider consumer base. Geographically, Asia Pacific remains a powerhouse, driven by its vast domestic consumption and significant production capabilities, particularly in countries like Vietnam and Thailand. The region's economic growth, rising disposable incomes, and established seafood culture contribute significantly to its leading position. North America and Europe also represent substantial markets, with a strong emphasis on premium and sustainably sourced king prawns, catering to a more discerning consumer.
- Dominant Segment: The Retail Sector is projected to account for 55% of the total King Prawn market revenue by 2028, up from 48% in 2024.
- Dominant Product Type: Processed Products are expected to witness a CAGR of 6.5% over the forecast period, outpacing Fresh Products at 4.5%.
- Leading Region: Asia Pacific is estimated to hold over 40% of the global market share, driven by a market size of approximately $11.2 billion in 2024.
- Key Drivers in Asia Pacific:
- Rapid urbanization and a growing middle class.
- Strong tradition of seafood consumption.
- Government support for aquaculture development, with over $1.5 billion invested in the past decade.
- Drivers for Retail Sector Dominance:
- Convenience and availability through supermarkets and online platforms.
- Product innovation in ready-to-cook and meal-kit formats.
- Increased marketing efforts by retailers highlighting health benefits.
- Growth Potential in North America & Europe:
- Focus on sustainability and traceability, with a premium price point for certified products.
- Expansion of direct-to-consumer (DTC) models, projecting a 10% annual growth.
King Prawn Product Landscape
Innovations in the King Prawn market are largely centered around enhancing convenience and sustainability. Value-added products, such as pre-marinated, breaded, and fully cooked king prawns, are gaining traction, catering to busy lifestyles and simplifying home cooking. Advancements in processing technologies, including rapid freezing techniques and improved packaging, are crucial for maintaining product freshness and extending shelf life, thereby reducing waste. The integration of blockchain technology for enhanced traceability is a significant development, offering consumers transparency about the origin and journey of their food. Performance metrics are increasingly focused on factors like protein content, freshness indicators, and the absence of additives.
Key Drivers, Barriers & Challenges in King Prawn
Key Drivers:
- Growing global demand for protein-rich foods: A rising population and increased health consciousness are fueling demand for seafood, with king prawns being a preferred choice due to their nutritional value and taste.
- Technological advancements in aquaculture: Improved breeding techniques, disease management, and feed optimization are increasing yields and reducing production costs, making king prawns more accessible.
- Expansion of the processed food industry: The demand for convenient, ready-to-cook, and ready-to-eat king prawn products is on the rise, especially in urban areas.
- Increasing disposable incomes: Growing economies, particularly in emerging markets, are leading to higher consumer spending on premium food items like king prawns.
Barriers & Challenges:
- Environmental concerns and sustainability pressures: Overfishing, habitat destruction, and the use of harmful chemicals in some aquaculture practices pose significant challenges, leading to stricter regulations and consumer scrutiny.
- Disease outbreaks in aquaculture: Viral and bacterial diseases can lead to significant losses in production, impacting supply and price stability. Estimated losses due to disease outbreaks can reach 5-10% of annual production value.
- Fluctuating raw material prices and supply chain disruptions: Factors like climate change, geopolitical events, and energy costs can impact the availability and cost of feed and other essential inputs, leading to price volatility.
- Stringent import regulations and trade barriers: Different countries have varying food safety standards and import quotas, creating complexities for international trade and market access.
- Competition from alternative protein sources: The growing popularity of plant-based proteins and other seafood varieties presents ongoing competitive pressure.
Emerging Opportunities in King Prawn
Emerging opportunities lie in the development of specialized king prawn products catering to niche markets, such as low-sodium or high-protein options for health-conscious consumers. The untapped potential in developing economies, with their growing middle class and increasing adoption of Western dietary habits, presents a significant growth avenue. Innovations in sustainable aquaculture, such as integrated multi-trophic aquaculture (IMTA) systems, offer the potential for reduced environmental impact and improved resource utilization. Furthermore, the direct-to-consumer (DTC) e-commerce model for premium seafood products is a burgeoning opportunity, allowing for greater control over the supply chain and enhanced customer engagement.
Growth Accelerators in the King Prawn Industry
The long-term growth of the King Prawn industry will be significantly accelerated by continued advancements in sustainable aquaculture technologies, focusing on disease resistance, feed efficiency, and reduced environmental footprint. Strategic partnerships between aquaculture producers, processors, and retailers will be crucial for ensuring a stable and predictable supply chain and for co-developing innovative product offerings. Market expansion strategies, particularly targeting the growing middle-class populations in Asia and Africa, will unlock new demand centers. Furthermore, the integration of digital technologies for enhanced traceability and consumer engagement will build trust and loyalty, driving sustained demand.
Key Players Shaping the King Prawn Market
- Apex Frozen Foods Ltd
- Aqua Star
- Grand Ocean Seafoods Co. Ltd
- Grupo Ibérica Congelados S.A.
- Liveris Afentoulis & Co.
- Mazzetta Company LLC
- Nordic Seafood A/S (Nissui Corporation)
- Ocean More Foods Co. Ltd
- Pacific Seafood
- Seaprimexco Vietnam
- Sea Harvest
- Charoen Pokphand Foods
- Thai Union Group
- Cargill
- Flogro
- Wicked Leeks
- Vertical Oceans
- Great Britain Prawns
- Australian Ocean King Prawn Company
Notable Milestones in King Prawn Sector
- 2019: Launch of ASC-certified king prawns by several major retailers, boosting consumer confidence in sustainable sourcing.
- 2020: Significant investment in land-based recirculating aquaculture systems (RAS) for king prawn farming in Europe, promising reduced environmental impact.
- 2021: Increased adoption of blockchain technology for traceability by leading processors, offering enhanced transparency to consumers.
- 2022: Introduction of plant-based king prawn alternatives gaining traction in mainstream markets, presenting a competitive innovation.
- 2023: Major acquisition of a vertically integrated king prawn farm by a global food conglomerate, signaling consolidation trends.
- 2024: Government initiatives in Southeast Asia to promote disease-resistant strains of king prawns, aiming to increase production stability.
In-Depth King Prawn Market Outlook
The King Prawn market outlook is exceptionally positive, driven by a confluence of factors including rising global demand for premium seafood, ongoing technological advancements in aquaculture, and a growing consumer preference for sustainable and traceable products. Growth accelerators such as strategic market expansion into emerging economies and the development of value-added, convenient food options will continue to propel the industry forward. The increasing focus on health and wellness will further bolster the demand for nutrient-rich king prawns. Companies that invest in sustainable practices, innovative product development, and robust supply chain management are well-positioned to capitalize on the significant future market potential.
King Prawn Segmentation
-
1. Application
- 1.1. Food Service Sector
- 1.2. Retail Sector
-
2. Type
- 2.1. Fresh Products
- 2.2. Processed Products
King Prawn Segmentation By Geography
-
1. North America
- 1.1. United States
- 1.2. Canada
- 1.3. Mexico
-
2. South America
- 2.1. Brazil
- 2.2. Argentina
- 2.3. Rest of South America
-
3. Europe
- 3.1. United Kingdom
- 3.2. Germany
- 3.3. France
- 3.4. Italy
- 3.5. Spain
- 3.6. Russia
- 3.7. Benelux
- 3.8. Nordics
- 3.9. Rest of Europe
-
4. Middle East & Africa
- 4.1. Turkey
- 4.2. Israel
- 4.3. GCC
- 4.4. North Africa
- 4.5. South Africa
- 4.6. Rest of Middle East & Africa
-
5. Asia Pacific
- 5.1. China
- 5.2. India
- 5.3. Japan
- 5.4. South Korea
- 5.5. ASEAN
- 5.6. Oceania
- 5.7. Rest of Asia Pacific
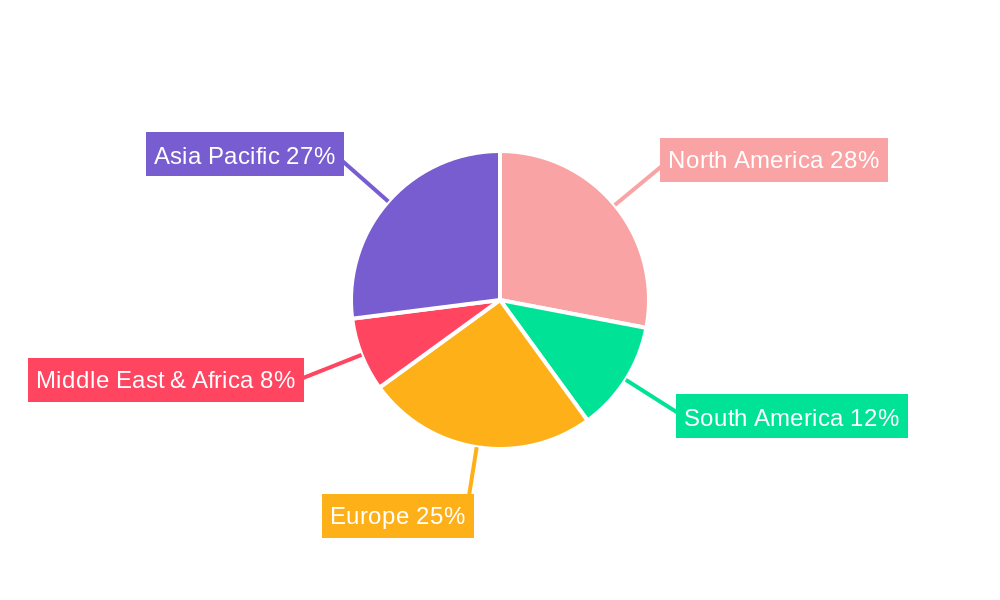
King Prawn Regional Market Share
Geographic Coverage of King Prawn
King Prawn REPORT HIGHLIGHTS
| Aspects | Details |
|---|---|
| Study Period | 2020-2034 |
| Base Year | 2025 |
| Estimated Year | 2026 |
| Forecast Period | 2026-2034 |
| Historical Period | 2020-2025 |
| Growth Rate | CAGR of 5.5% from 2020-2034 |
| Segmentation |
|
Table of Contents
- 1. Introduction
- 1.1. Research Scope
- 1.2. Market Segmentation
- 1.3. Research Methodology
- 1.4. Definitions and Assumptions
- 2. Executive Summary
- 2.1. Introduction
- 3. Market Dynamics
- 3.1. Introduction
- 3.2. Market Drivers
- 3.3. Market Restrains
- 3.4. Market Trends
- 4. Market Factor Analysis
- 4.1. Porters Five Forces
- 4.2. Supply/Value Chain
- 4.3. PESTEL analysis
- 4.4. Market Entropy
- 4.5. Patent/Trademark Analysis
- 5. Global King Prawn Analysis, Insights and Forecast, 2020-2032
- 5.1. Market Analysis, Insights and Forecast - by Application
- 5.1.1. Food Service Sector
- 5.1.2. Retail Sector
- 5.2. Market Analysis, Insights and Forecast - by Type
- 5.2.1. Fresh Products
- 5.2.2. Processed Products
- 5.3. Market Analysis, Insights and Forecast - by Region
- 5.3.1. North America
- 5.3.2. South America
- 5.3.3. Europe
- 5.3.4. Middle East & Africa
- 5.3.5. Asia Pacific
- 5.1. Market Analysis, Insights and Forecast - by Application
- 6. North America King Prawn Analysis, Insights and Forecast, 2020-2032
- 6.1. Market Analysis, Insights and Forecast - by Application
- 6.1.1. Food Service Sector
- 6.1.2. Retail Sector
- 6.2. Market Analysis, Insights and Forecast - by Type
- 6.2.1. Fresh Products
- 6.2.2. Processed Products
- 6.1. Market Analysis, Insights and Forecast - by Application
- 7. South America King Prawn Analysis, Insights and Forecast, 2020-2032
- 7.1. Market Analysis, Insights and Forecast - by Application
- 7.1.1. Food Service Sector
- 7.1.2. Retail Sector
- 7.2. Market Analysis, Insights and Forecast - by Type
- 7.2.1. Fresh Products
- 7.2.2. Processed Products
- 7.1. Market Analysis, Insights and Forecast - by Application
- 8. Europe King Prawn Analysis, Insights and Forecast, 2020-2032
- 8.1. Market Analysis, Insights and Forecast - by Application
- 8.1.1. Food Service Sector
- 8.1.2. Retail Sector
- 8.2. Market Analysis, Insights and Forecast - by Type
- 8.2.1. Fresh Products
- 8.2.2. Processed Products
- 8.1. Market Analysis, Insights and Forecast - by Application
- 9. Middle East & Africa King Prawn Analysis, Insights and Forecast, 2020-2032
- 9.1. Market Analysis, Insights and Forecast - by Application
- 9.1.1. Food Service Sector
- 9.1.2. Retail Sector
- 9.2. Market Analysis, Insights and Forecast - by Type
- 9.2.1. Fresh Products
- 9.2.2. Processed Products
- 9.1. Market Analysis, Insights and Forecast - by Application
- 10. Asia Pacific King Prawn Analysis, Insights and Forecast, 2020-2032
- 10.1. Market Analysis, Insights and Forecast - by Application
- 10.1.1. Food Service Sector
- 10.1.2. Retail Sector
- 10.2. Market Analysis, Insights and Forecast - by Type
- 10.2.1. Fresh Products
- 10.2.2. Processed Products
- 10.1. Market Analysis, Insights and Forecast - by Application
- 11. Competitive Analysis
- 11.1. Global Market Share Analysis 2025
- 11.2. Company Profiles
- 11.2.1 Apex Frozen Foods Ltd
- 11.2.1.1. Overview
- 11.2.1.2. Products
- 11.2.1.3. SWOT Analysis
- 11.2.1.4. Recent Developments
- 11.2.1.5. Financials (Based on Availability)
- 11.2.2 Aqua Star
- 11.2.2.1. Overview
- 11.2.2.2. Products
- 11.2.2.3. SWOT Analysis
- 11.2.2.4. Recent Developments
- 11.2.2.5. Financials (Based on Availability)
- 11.2.3 Grand Ocean Seafoods Co. Ltd
- 11.2.3.1. Overview
- 11.2.3.2. Products
- 11.2.3.3. SWOT Analysis
- 11.2.3.4. Recent Developments
- 11.2.3.5. Financials (Based on Availability)
- 11.2.4 Grupo Ibérica Congelados S.A.
- 11.2.4.1. Overview
- 11.2.4.2. Products
- 11.2.4.3. SWOT Analysis
- 11.2.4.4. Recent Developments
- 11.2.4.5. Financials (Based on Availability)
- 11.2.5 Liveris Afentoulis & Co.
- 11.2.5.1. Overview
- 11.2.5.2. Products
- 11.2.5.3. SWOT Analysis
- 11.2.5.4. Recent Developments
- 11.2.5.5. Financials (Based on Availability)
- 11.2.6 Mazzetta Company LLC
- 11.2.6.1. Overview
- 11.2.6.2. Products
- 11.2.6.3. SWOT Analysis
- 11.2.6.4. Recent Developments
- 11.2.6.5. Financials (Based on Availability)
- 11.2.7 Nordic Seafood A/S (Nissui Corporation)
- 11.2.7.1. Overview
- 11.2.7.2. Products
- 11.2.7.3. SWOT Analysis
- 11.2.7.4. Recent Developments
- 11.2.7.5. Financials (Based on Availability)
- 11.2.8 Ocean More Foods Co. Ltd
- 11.2.8.1. Overview
- 11.2.8.2. Products
- 11.2.8.3. SWOT Analysis
- 11.2.8.4. Recent Developments
- 11.2.8.5. Financials (Based on Availability)
- 11.2.9 Pacific Seafood
- 11.2.9.1. Overview
- 11.2.9.2. Products
- 11.2.9.3. SWOT Analysis
- 11.2.9.4. Recent Developments
- 11.2.9.5. Financials (Based on Availability)
- 11.2.10 Seaprimexco Vietnam
- 11.2.10.1. Overview
- 11.2.10.2. Products
- 11.2.10.3. SWOT Analysis
- 11.2.10.4. Recent Developments
- 11.2.10.5. Financials (Based on Availability)
- 11.2.11 Sea Harvest
- 11.2.11.1. Overview
- 11.2.11.2. Products
- 11.2.11.3. SWOT Analysis
- 11.2.11.4. Recent Developments
- 11.2.11.5. Financials (Based on Availability)
- 11.2.12 Charoen Pokphand Foods
- 11.2.12.1. Overview
- 11.2.12.2. Products
- 11.2.12.3. SWOT Analysis
- 11.2.12.4. Recent Developments
- 11.2.12.5. Financials (Based on Availability)
- 11.2.13 Thai Union Group
- 11.2.13.1. Overview
- 11.2.13.2. Products
- 11.2.13.3. SWOT Analysis
- 11.2.13.4. Recent Developments
- 11.2.13.5. Financials (Based on Availability)
- 11.2.14 Cargill
- 11.2.14.1. Overview
- 11.2.14.2. Products
- 11.2.14.3. SWOT Analysis
- 11.2.14.4. Recent Developments
- 11.2.14.5. Financials (Based on Availability)
- 11.2.15 Flogro
- 11.2.15.1. Overview
- 11.2.15.2. Products
- 11.2.15.3. SWOT Analysis
- 11.2.15.4. Recent Developments
- 11.2.15.5. Financials (Based on Availability)
- 11.2.16 Wicked Leeks
- 11.2.16.1. Overview
- 11.2.16.2. Products
- 11.2.16.3. SWOT Analysis
- 11.2.16.4. Recent Developments
- 11.2.16.5. Financials (Based on Availability)
- 11.2.17 Vertical Oceans
- 11.2.17.1. Overview
- 11.2.17.2. Products
- 11.2.17.3. SWOT Analysis
- 11.2.17.4. Recent Developments
- 11.2.17.5. Financials (Based on Availability)
- 11.2.18 Great Britain Prawns
- 11.2.18.1. Overview
- 11.2.18.2. Products
- 11.2.18.3. SWOT Analysis
- 11.2.18.4. Recent Developments
- 11.2.18.5. Financials (Based on Availability)
- 11.2.19 Australian Ocean King Prawn Company
- 11.2.19.1. Overview
- 11.2.19.2. Products
- 11.2.19.3. SWOT Analysis
- 11.2.19.4. Recent Developments
- 11.2.19.5. Financials (Based on Availability)
- 11.2.1 Apex Frozen Foods Ltd
List of Figures
- Figure 1: Global King Prawn Revenue Breakdown (billion, %) by Region 2025 & 2033
- Figure 2: North America King Prawn Revenue (billion), by Application 2025 & 2033
- Figure 3: North America King Prawn Revenue Share (%), by Application 2025 & 2033
- Figure 4: North America King Prawn Revenue (billion), by Type 2025 & 2033
- Figure 5: North America King Prawn Revenue Share (%), by Type 2025 & 2033
- Figure 6: North America King Prawn Revenue (billion), by Country 2025 & 2033
- Figure 7: North America King Prawn Revenue Share (%), by Country 2025 & 2033
- Figure 8: South America King Prawn Revenue (billion), by Application 2025 & 2033
- Figure 9: South America King Prawn Revenue Share (%), by Application 2025 & 2033
- Figure 10: South America King Prawn Revenue (billion), by Type 2025 & 2033
- Figure 11: South America King Prawn Revenue Share (%), by Type 2025 & 2033
- Figure 12: South America King Prawn Revenue (billion), by Country 2025 & 2033
- Figure 13: South America King Prawn Revenue Share (%), by Country 2025 & 2033
- Figure 14: Europe King Prawn Revenue (billion), by Application 2025 & 2033
- Figure 15: Europe King Prawn Revenue Share (%), by Application 2025 & 2033
- Figure 16: Europe King Prawn Revenue (billion), by Type 2025 & 2033
- Figure 17: Europe King Prawn Revenue Share (%), by Type 2025 & 2033
- Figure 18: Europe King Prawn Revenue (billion), by Country 2025 & 2033
- Figure 19: Europe King Prawn Revenue Share (%), by Country 2025 & 2033
- Figure 20: Middle East & Africa King Prawn Revenue (billion), by Application 2025 & 2033
- Figure 21: Middle East & Africa King Prawn Revenue Share (%), by Application 2025 & 2033
- Figure 22: Middle East & Africa King Prawn Revenue (billion), by Type 2025 & 2033
- Figure 23: Middle East & Africa King Prawn Revenue Share (%), by Type 2025 & 2033
- Figure 24: Middle East & Africa King Prawn Revenue (billion), by Country 2025 & 2033
- Figure 25: Middle East & Africa King Prawn Revenue Share (%), by Country 2025 & 2033
- Figure 26: Asia Pacific King Prawn Revenue (billion), by Application 2025 & 2033
- Figure 27: Asia Pacific King Prawn Revenue Share (%), by Application 2025 & 2033
- Figure 28: Asia Pacific King Prawn Revenue (billion), by Type 2025 & 2033
- Figure 29: Asia Pacific King Prawn Revenue Share (%), by Type 2025 & 2033
- Figure 30: Asia Pacific King Prawn Revenue (billion), by Country 2025 & 2033
- Figure 31: Asia Pacific King Prawn Revenue Share (%), by Country 2025 & 2033
List of Tables
- Table 1: Global King Prawn Revenue billion Forecast, by Application 2020 & 2033
- Table 2: Global King Prawn Revenue billion Forecast, by Type 2020 & 2033
- Table 3: Global King Prawn Revenue billion Forecast, by Region 2020 & 2033
- Table 4: Global King Prawn Revenue billion Forecast, by Application 2020 & 2033
- Table 5: Global King Prawn Revenue billion Forecast, by Type 2020 & 2033
- Table 6: Global King Prawn Revenue billion Forecast, by Country 2020 & 2033
- Table 7: United States King Prawn Revenue (billion) Forecast, by Application 2020 & 2033
- Table 8: Canada King Prawn Revenue (billion) Forecast, by Application 2020 & 2033
- Table 9: Mexico King Prawn Revenue (billion) Forecast, by Application 2020 & 2033
- Table 10: Global King Prawn Revenue billion Forecast, by Application 2020 & 2033
- Table 11: Global King Prawn Revenue billion Forecast, by Type 2020 & 2033
- Table 12: Global King Prawn Revenue billion Forecast, by Country 2020 & 2033
- Table 13: Brazil King Prawn Revenue (billion) Forecast, by Application 2020 & 2033
- Table 14: Argentina King Prawn Revenue (billion) Forecast, by Application 2020 & 2033
- Table 15: Rest of South America King Prawn Revenue (billion) Forecast, by Application 2020 & 2033
- Table 16: Global King Prawn Revenue billion Forecast, by Application 2020 & 2033
- Table 17: Global King Prawn Revenue billion Forecast, by Type 2020 & 2033
- Table 18: Global King Prawn Revenue billion Forecast, by Country 2020 & 2033
- Table 19: United Kingdom King Prawn Revenue (billion) Forecast, by Application 2020 & 2033
- Table 20: Germany King Prawn Revenue (billion) Forecast, by Application 2020 & 2033
- Table 21: France King Prawn Revenue (billion) Forecast, by Application 2020 & 2033
- Table 22: Italy King Prawn Revenue (billion) Forecast, by Application 2020 & 2033
- Table 23: Spain King Prawn Revenue (billion) Forecast, by Application 2020 & 2033
- Table 24: Russia King Prawn Revenue (billion) Forecast, by Application 2020 & 2033
- Table 25: Benelux King Prawn Revenue (billion) Forecast, by Application 2020 & 2033
- Table 26: Nordics King Prawn Revenue (billion) Forecast, by Application 2020 & 2033
- Table 27: Rest of Europe King Prawn Revenue (billion) Forecast, by Application 2020 & 2033
- Table 28: Global King Prawn Revenue billion Forecast, by Application 2020 & 2033
- Table 29: Global King Prawn Revenue billion Forecast, by Type 2020 & 2033
- Table 30: Global King Prawn Revenue billion Forecast, by Country 2020 & 2033
- Table 31: Turkey King Prawn Revenue (billion) Forecast, by Application 2020 & 2033
- Table 32: Israel King Prawn Revenue (billion) Forecast, by Application 2020 & 2033
- Table 33: GCC King Prawn Revenue (billion) Forecast, by Application 2020 & 2033
- Table 34: North Africa King Prawn Revenue (billion) Forecast, by Application 2020 & 2033
- Table 35: South Africa King Prawn Revenue (billion) Forecast, by Application 2020 & 2033
- Table 36: Rest of Middle East & Africa King Prawn Revenue (billion) Forecast, by Application 2020 & 2033
- Table 37: Global King Prawn Revenue billion Forecast, by Application 2020 & 2033
- Table 38: Global King Prawn Revenue billion Forecast, by Type 2020 & 2033
- Table 39: Global King Prawn Revenue billion Forecast, by Country 2020 & 2033
- Table 40: China King Prawn Revenue (billion) Forecast, by Application 2020 & 2033
- Table 41: India King Prawn Revenue (billion) Forecast, by Application 2020 & 2033
- Table 42: Japan King Prawn Revenue (billion) Forecast, by Application 2020 & 2033
- Table 43: South Korea King Prawn Revenue (billion) Forecast, by Application 2020 & 2033
- Table 44: ASEAN King Prawn Revenue (billion) Forecast, by Application 2020 & 2033
- Table 45: Oceania King Prawn Revenue (billion) Forecast, by Application 2020 & 2033
- Table 46: Rest of Asia Pacific King Prawn Revenue (billion) Forecast, by Application 2020 & 2033
Frequently Asked Questions
1. What is the projected Compound Annual Growth Rate (CAGR) of the King Prawn?
The projected CAGR is approximately 5.5%.
2. Which companies are prominent players in the King Prawn?
Key companies in the market include Apex Frozen Foods Ltd, Aqua Star, Grand Ocean Seafoods Co. Ltd, Grupo Ibérica Congelados S.A., Liveris Afentoulis & Co., Mazzetta Company LLC, Nordic Seafood A/S (Nissui Corporation), Ocean More Foods Co. Ltd, Pacific Seafood, Seaprimexco Vietnam, Sea Harvest, Charoen Pokphand Foods, Thai Union Group, Cargill, Flogro, Wicked Leeks, Vertical Oceans, Great Britain Prawns, Australian Ocean King Prawn Company.
3. What are the main segments of the King Prawn?
The market segments include Application, Type.
4. Can you provide details about the market size?
The market size is estimated to be USD 79.2 billion as of 2022.
5. What are some drivers contributing to market growth?
N/A
6. What are the notable trends driving market growth?
N/A
7. Are there any restraints impacting market growth?
N/A
8. Can you provide examples of recent developments in the market?
N/A
9. What pricing options are available for accessing the report?
Pricing options include single-user, multi-user, and enterprise licenses priced at USD 2900.00, USD 4350.00, and USD 5800.00 respectively.
10. Is the market size provided in terms of value or volume?
The market size is provided in terms of value, measured in billion.
11. Are there any specific market keywords associated with the report?
Yes, the market keyword associated with the report is "King Prawn," which aids in identifying and referencing the specific market segment covered.
12. How do I determine which pricing option suits my needs best?
The pricing options vary based on user requirements and access needs. Individual users may opt for single-user licenses, while businesses requiring broader access may choose multi-user or enterprise licenses for cost-effective access to the report.
13. Are there any additional resources or data provided in the King Prawn report?
While the report offers comprehensive insights, it's advisable to review the specific contents or supplementary materials provided to ascertain if additional resources or data are available.
14. How can I stay updated on further developments or reports in the King Prawn?
To stay informed about further developments, trends, and reports in the King Prawn, consider subscribing to industry newsletters, following relevant companies and organizations, or regularly checking reputable industry news sources and publications.
Methodology
Step 1 - Identification of Relevant Samples Size from Population Database


Step 2 - Approaches for Defining Global Market Size (Value, Volume* & Price*)

Note*: In applicable scenarios
Step 3 - Data Sources
Primary Research
- Web Analytics
- Survey Reports
- Research Institute
- Latest Research Reports
- Opinion Leaders
Secondary Research
- Annual Reports
- White Paper
- Latest Press Release
- Industry Association
- Paid Database
- Investor Presentations

Step 4 - Data Triangulation
Involves using different sources of information in order to increase the validity of a study
These sources are likely to be stakeholders in a program - participants, other researchers, program staff, other community members, and so on.
Then we put all data in single framework & apply various statistical tools to find out the dynamic on the market.
During the analysis stage, feedback from the stakeholder groups would be compared to determine areas of agreement as well as areas of divergence